Trend speed vector oscillator
- Indicadores
- Versión: 1.1
- Activaciones: 5

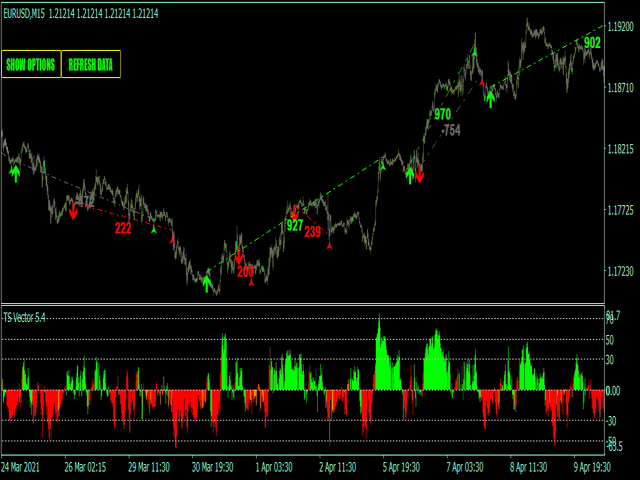
Vector de velocidad de tendencia - es el oscilador para el trading manual. El sistema mide la dirección de la tendencia y su velocidad.
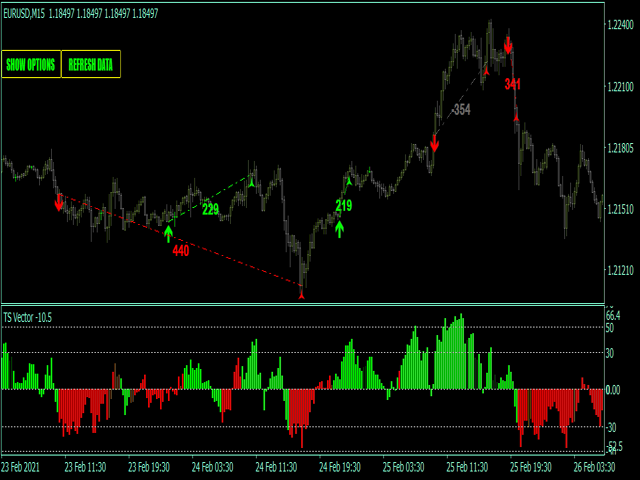
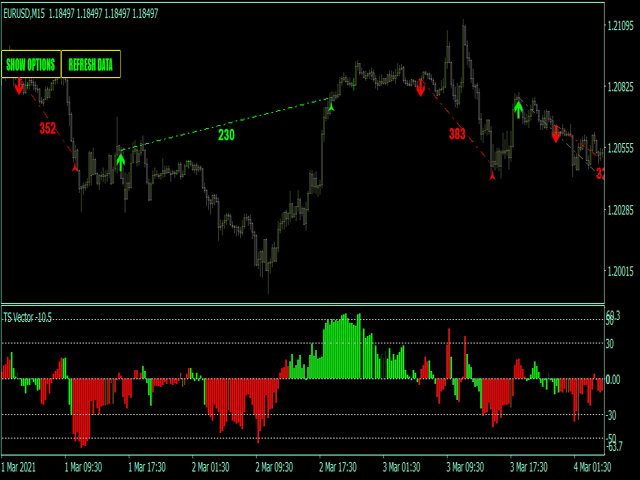
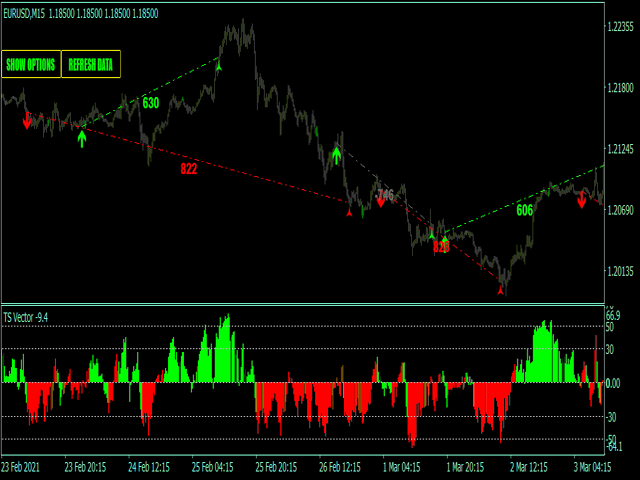
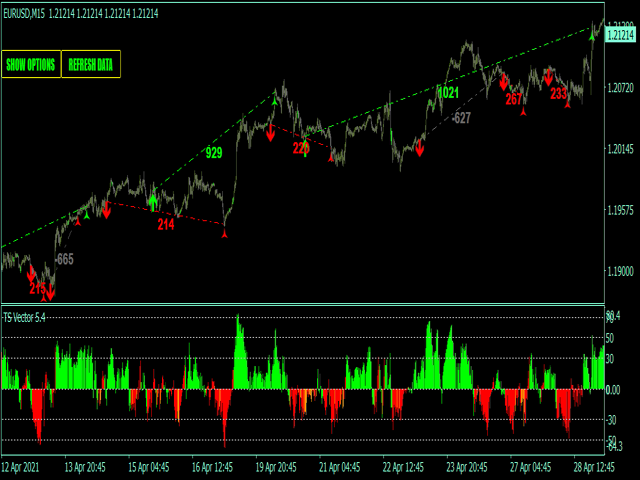
El histograma muestra 4 colores:
- Cal --> Fuerte movimiento alcista con buena velocidad de ganancia;
- Verde --> Movimiento alcista con baja velocidad de ganancia
- Rojo --> Fuerte movimiento bajista con buena velocidad de ganancia;
- Naranja --> Movimiento a la baja con baja velocidad de ganancia
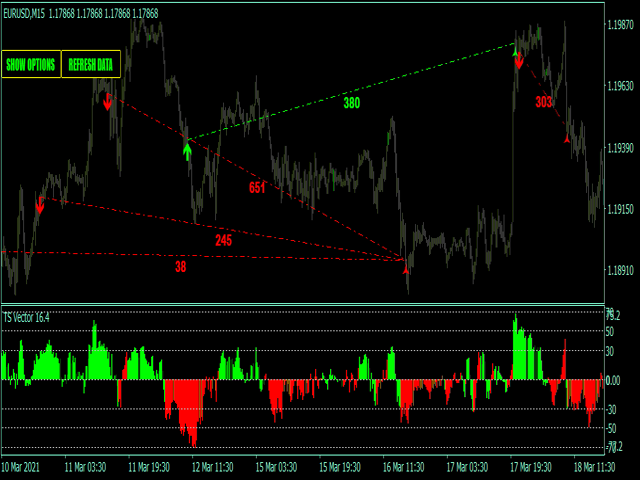
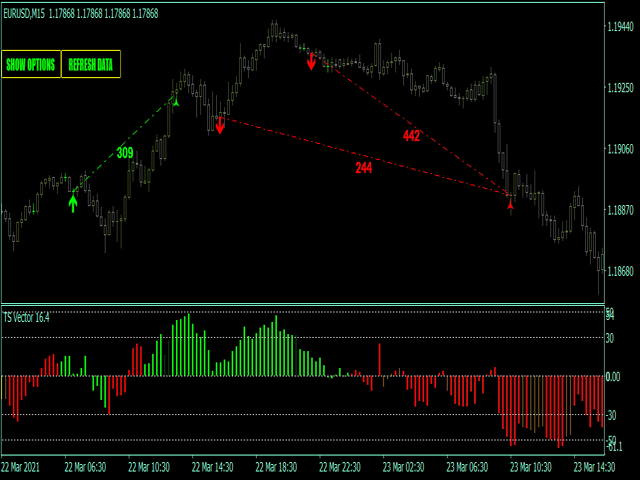
Los histogramas verde y naranja muestran los movimientos débiles del mercado y estos lugares están excluidos de los puntos de señal. La flecha de compra se traza durante un fuerte movimiento bajista cuando la velocidad de ganancia bajista es baja y aparece un fondo inverso alcista. La flecha de venta se traza durante un fuerte movimiento alcista cuando la velocidad de ganancia alcista es baja y aparece un fondo inverso bajista.
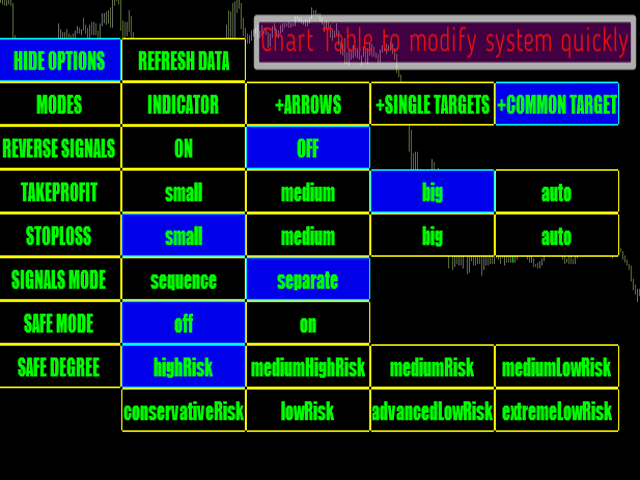
Entradas ajustables del indicador principal :
- marketTrendPeriod - periodo para los cálculos del indicador principal;
- marketSpeedTrigger - medidas de 10 - hasta 60 ;
Características del indicador principal
- Las señales no se repintan, tardan o desaparecen;
- Cada señal se produce en la apertura de la nueva barra (el sistema utiliza sólo las señales confirmadas);
- Indicador tiene alertas, correo y notificaciones Push (permite el comercio fuera de la PC, desde el teléfono inteligente / aplicación móvil);
- Indicador tiene objetivos de ganancias / pérdidas;
Recomendaciones para el comercio
- EURUSD, GBPUSD, GBPJPY, AUDUSD, USDJPY;
- Mejores marcos temporales - M5-M30 timeframe;