Murrey Math Levels MT4
- Indikatoren
-
KEENBASE SOFTWARE SOLUTIONS
 Keenbase Trading entwickelt professionelle MetaTrader 4- und MetaTrader 5-Indikatoren sowie Expert Advisors, die Trader dabei unterstützen, fundiertere Handelsentscheidungen zu treffen.
 - Version: 1.3
- Aktualisiert: 10 Mai 2024
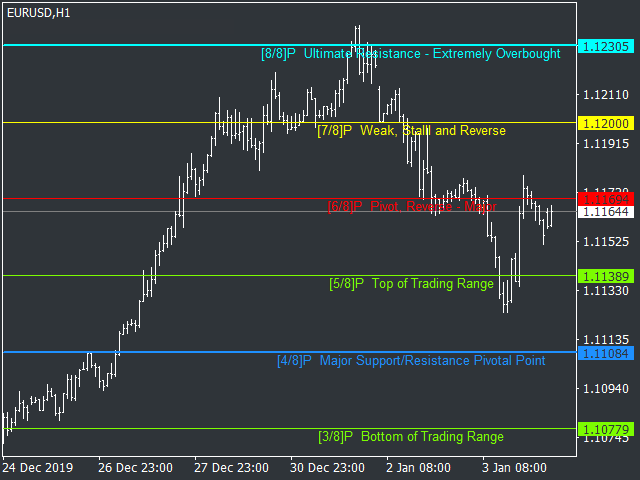
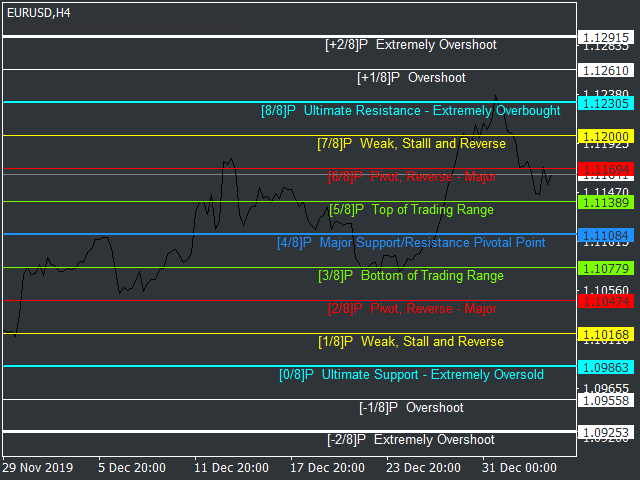
Es zeigt die Murrey Math-Levels auf dem Diagramm an und gibt außerdem eine Warnung aus, wenn der Kurs ein bestimmtes Level berührt. T. Henning Murrey stellte 1995 ein Handelssystem namens Murrey Math Trading System vor, das auf den Beobachtungen von W.D. Gann basiert.
Anwendungen
- Für Murrey Math-Liebhaber ist dieser Indikator ein Muss in ihrem Arsenal.
- Sie müssen nicht die ganze Zeit auf dem Bildschirm präsent sein. Sobald der Kurs ein bestimmtes Niveau berührt, sendet er eine Warnung.
- Erkennen Sie bevorstehende Umschwünge im Voraus, indem Sie auf die Kursreaktion bei extrem überzogenen Niveaus spekulieren.
Das Verständnis der Murrey Math Levels
Das Murrey Math-Handelssystem basiert auf der Annahme, dass sich die Preise auf allen Märkten gleich verhalten; deshalb haben verschiedene Märkte ähnliche Eigenschaften.
Murrey Math unterteilt die Preise in 1/8-Intervalle. Das Grundkonzept des Murrey-Math-Handelssystems besteht darin, dass sich die Preisbewegung eines Marktes in der Regel in Vielfachen von 1/8 bis 8/8 zurückentwickelt.
Dreizehn Murrey-Math-Stufen
- [-2/8]P Extrem überschießend
- [-1/8]P Überschreitung
- [0/8]P Ultimative Unterstützung - extrem überverkauft
- [1/8]P Schwach, Strömungsabriss und Umkehr
- [2/8]P Pivot, Umkehr - Major
- [3/8]P Tiefpunkt der Handelsspanne
- [4/8]P Großer Unterstützungs-/Widerstandspunkt (Pivot)
- [5/8]P Oberseite der Handelsspanne
- [6/8]P Pivot, Umkehrung - Major
- [7/8]P Schwach, Stalll und Umkehr
- [8/8]P Ultimativer Widerstand - Extrem überkauft
- [+1/8]P Überschießend
- [+2/8]P Extrem überkauft
Während jedes Niveau seine Bedeutung hat, glauben die Händler von Murrey Math, dass sich der Markt in 95% der Fälle umkehrt, wenn der Preis über oder unter dem [2/8]P Extremely Overshoot Niveau kreuzt.
Eingaben
- Oktavperiode: Anzahl der Balken zur Berechnung der Preisspanne für Murrey-Math-Levels.
- Zeitrahmen: Wählen Sie den Zeitrahmen aus.
- Zurückschieben: Verschieben Sie die Balken zurück, um zu vermeiden, dass die Levels neu gezeichnet werden, wenn der Preis ein neues Hoch/Tief erreicht.
- Levels Farbe
- Levels Breite
- Alert-Einstellungen