Pivots MT4
- Indikatoren
- Version: 1.1
- Aktivierungen: 20

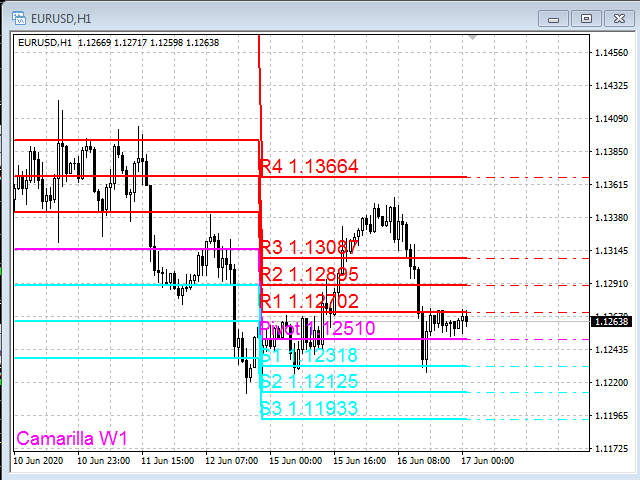
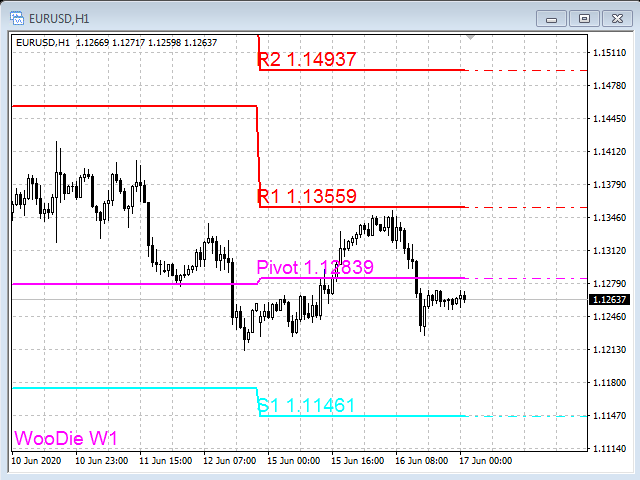
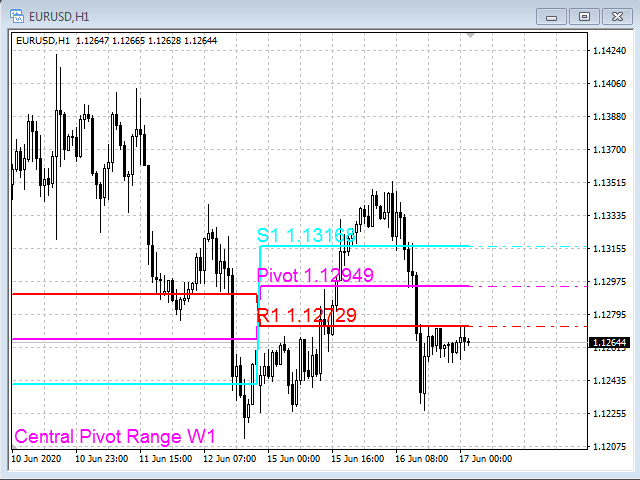
Pivots MT4 - Einfacher und bequemer Indikator der Pivot-Levels, berechnet die Levels nach den Methoden Classic, Fibonacci, DeMark, Camarilla, WooDie, Central Pivot Range.
Der Indikator zeichnet sich vorteilhaft durch die folgende
aus
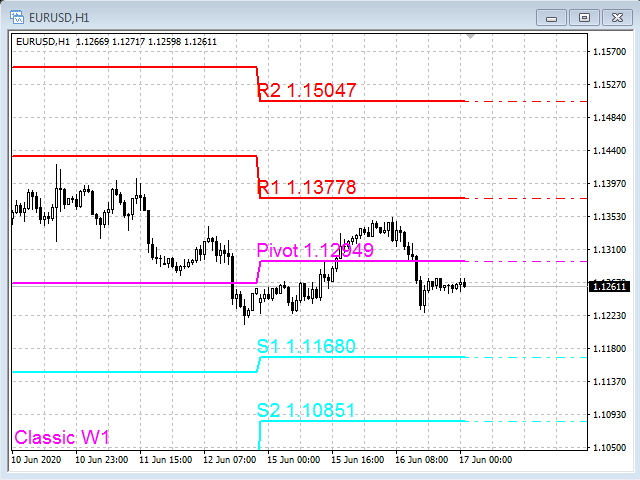
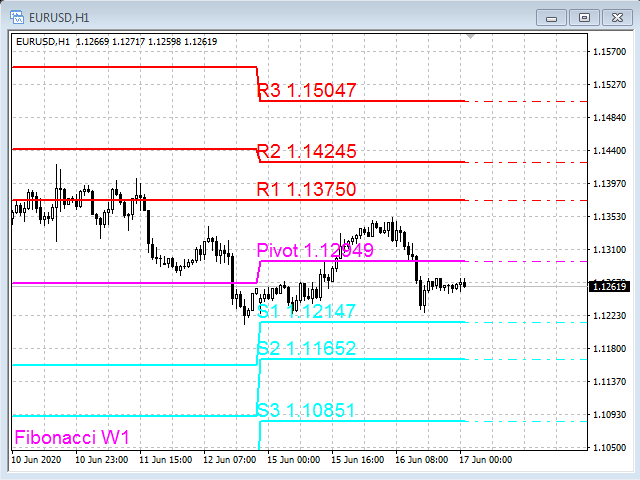
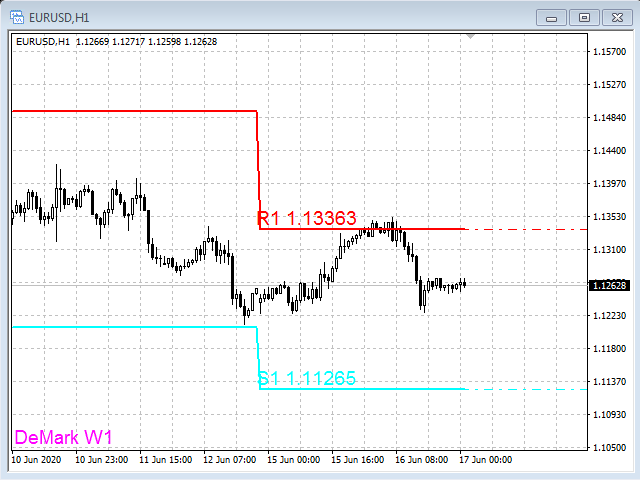
- Berechnet Pivot-Levels nach den Methoden Classic, Fibonacci, DeMark, Camarilla, WooDie, Central Pivot Range;
- Zeigt die aktuellen Niveaus und die Niveaus der vorherigen Perioden im Diagramm an;
- Zeigt die ausgewählte Methode und Periode, die Namen der Niveaus und ihre Kurswerte im Diagramm an.
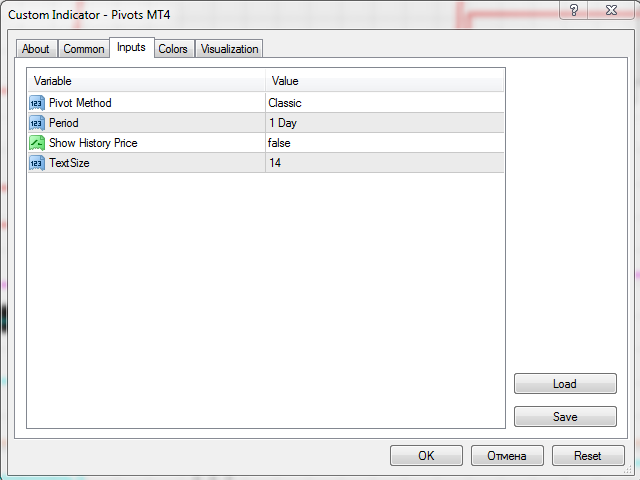
Parameter
- Pivot-Methode - Eine Dropdown-Liste mit der Auswahl der Berechnungsmethode Classic, Fibonacci, DeMark, Camarilla, WooDie, Central Pivot Range;
- Zeitraum - Zeitraum, für den die Niveaus berechnet werden;
- Show History Price - Anzeige der Preise für frühere Perioden, wenn der Indikator gestartet wird, true/false;
- Textgröße -Textgröße.