Resistance and Support Levels
- Indikatoren
- Version: 2.0
- Aktualisiert: 21 Juli 2021
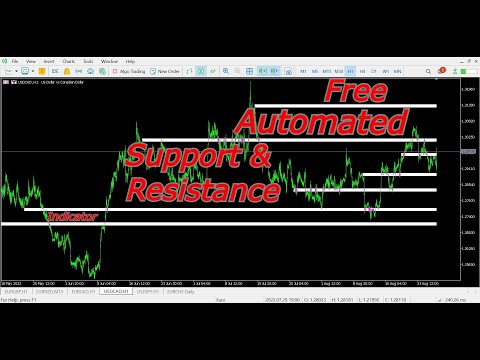
Dieser Indikator zeichnet automatisch die Unterstützungs- und Widerstandsniveaus für Sie, sobald Sie ihn auf einem Chart abgelegt haben.
So müssen Sie diese Ebenen nicht jedes Mal neu zeichnen, wenn Sie die Preise in einem Chart analysieren. Alles, was Sie tun müssen, ist, den Indikator auf einem Diagramm abzulegen, die Einstellungen nach Ihren Wünschen anzupassen und ihn den Rest machen zu lassen.
Aber es kommt noch besser: Der Indikator ist absolut kostenlos!
Holen Sie sich die neue und verbesserte Version hier: https: //youtu.be/rTxbPOBu3nY
Parameter
Zeitrahmen -> Der Indikator soll die Levels anhand der Daten aus welchem Zeitrahmen zeichnen?
Anzahl der Niveaus -> Wie viele Widerstands- und Unterstützungsniveaus Sie auf Ihrem Chart haben möchten.
Wenn Sie den Indikator verwendet haben und Verbesserungsvorschläge für die nächste Version haben, schreiben Sie mir eine E-Mail (david100muriithi@gmail). Vielen Dank!


Good IND