Demark Trend Lines several time frames
- Indikatoren
- Version: 1.1
- Aktualisiert: 4 Februar 2022
- Aktivierungen: 5

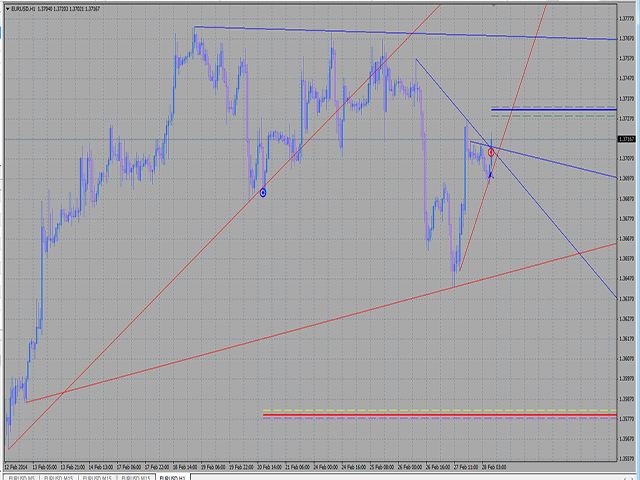
Der Indikator zeichnet Trendlinien nach dem Algorithmus von Thomas Demark.
Er zeichnet Linien aus verschiedenen Zeitrahmen auf einem Chart. Die Zeitrahmen können größer oder gleich dem Zeitrahmen des Charts sein, in dem der Indikator verwendet wird.
Der Indikator berücksichtigt Durchbruchsqualifizierer (wenn die Bedingungen erfüllt sind, erscheint ein zusätzliches Symbol an der Stelle des Durchbruchs) und zeichnet ungefähre Ziele (Ziellinie über/unter den aktuellen Kursen) entsprechend dem Demark-Algorithmus.
Empfohlene Zeitrahmen für den Handel sind D1+H1.
Trendlinien für andere Zeitrahmen können zusätzliche Informationen zur Einschätzung der Marktsituation liefern.