All TimeFrames Moving Averages MT5
- Indikatoren
- Version: 4.9
- Aktualisiert: 23 Mai 2020
- Aktivierungen: 5

Viele Indikatoren basieren auf dem klassischen Indikator Moving Average.
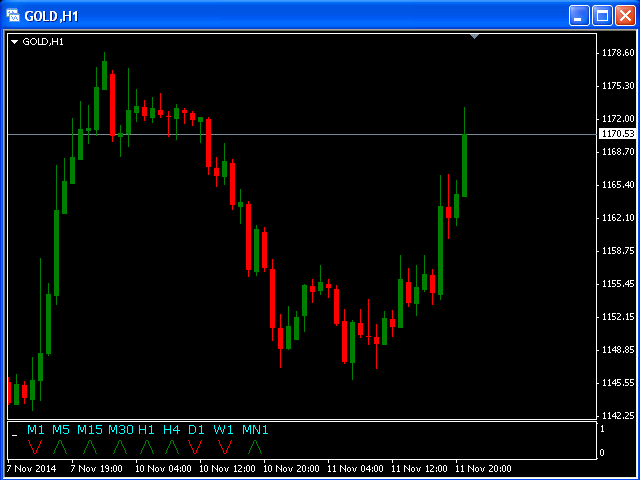
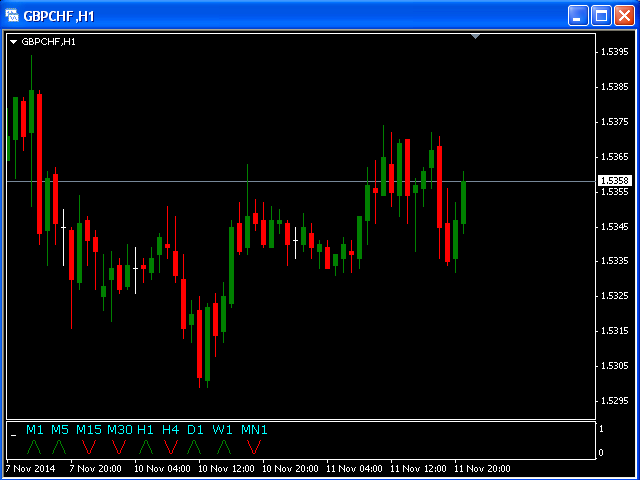
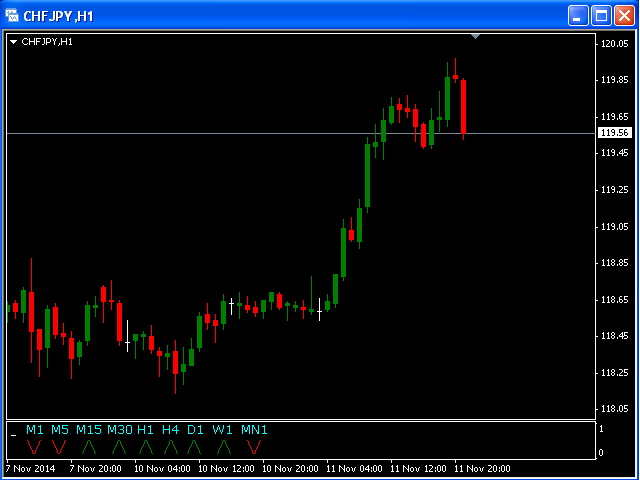
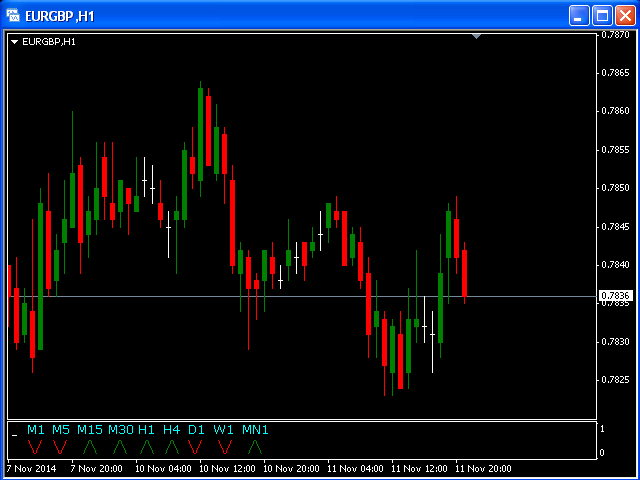
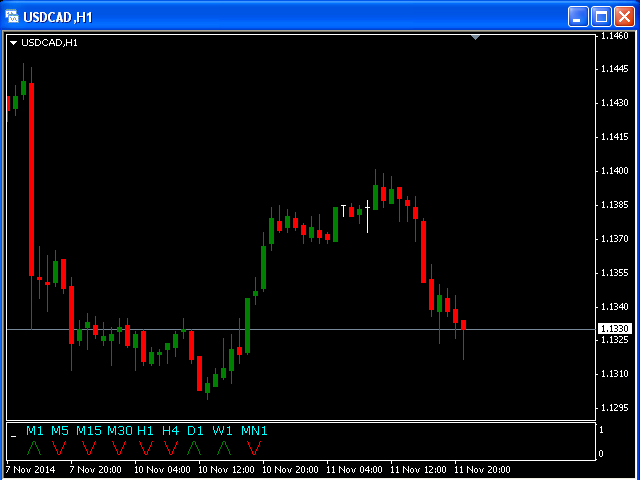
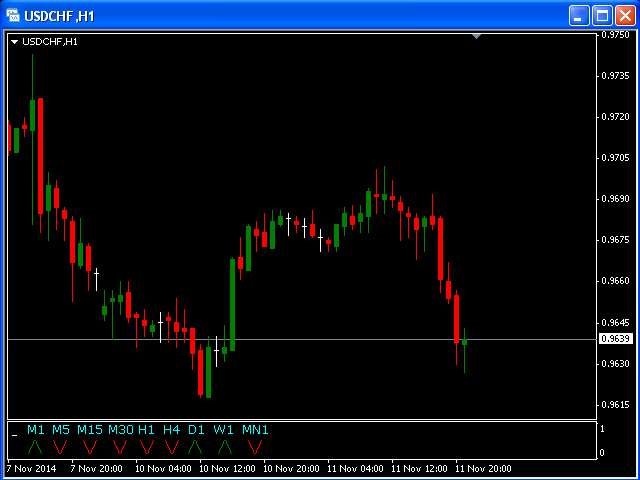
Der Indikator All_TF_MA zeigt die Kreuzung von 2 MA aus jedem TimeFrames.
Sie können die wichtigsten Eingabeparameter für jeden MA für jeden TF ändern.
Beispiel für M1 TF:
- Zeitraum1_schnell = 5
- Methode1_schnell = MODE_EMA
- Preis1_schnell = PRICE_CLOSE
- Zeitraum1_langsam = 21
- Methode1_langsam = MODE_SMA
- Preis1_langsam = PRICE_TYPICAL