TheStrat Monitor
- Indicadores
-
Robert Gerald Wood
 Desarrollador de software profesional con más de 25 años, ahora construyo herramientas para mí y las comparto con la comunidad en general.
 - Versión: 1.21
- Actualizado: 22 octubre 2021
- Activaciones: 10
Si aún no conoces la estrategia de trading The Strat, búscala en Google ahora mismo. Te prometo que no será una pérdida de tiempo, y es probable que aprendas algunos trucos nuevos tanto si lo usas como si no.
Bien, ahora que sabes lo que es TheStrat, podrás entender lo que este indicador puede hacer por ti.
Características principales
En resumen, el indicador
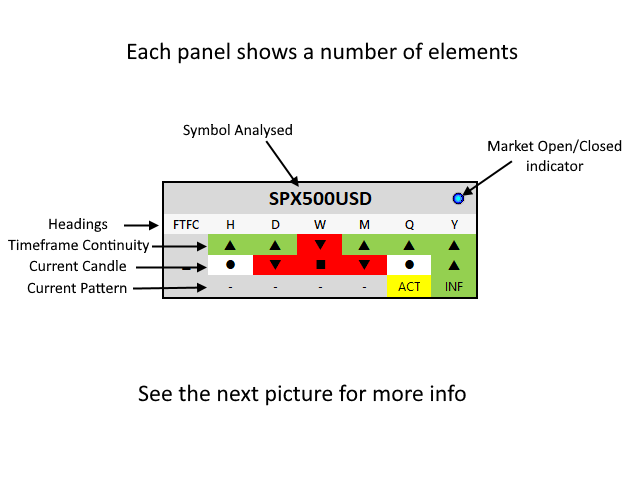
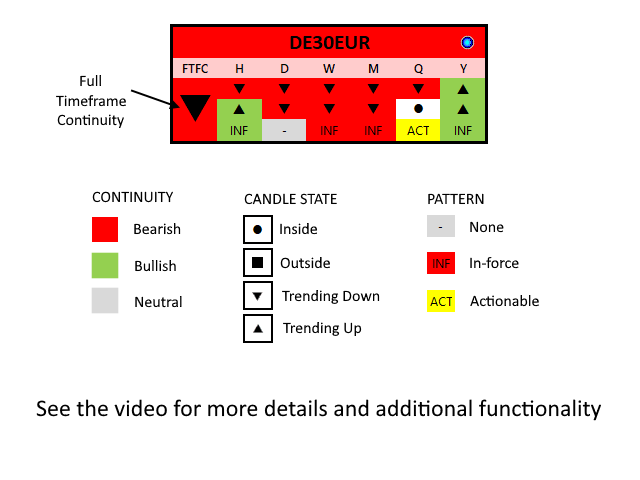
- Muestra la continuidad del marco temporal para todos los marcos de tiempo soportados
- Soporta dos vistas de timeframes, Day trader y Swing trader
- Muestra cuando la Continuidad del Marco de Tiempo Completo está en su lugar para cualquiera de los 4 marcos de tiempo consecutivos
- Muestra el estado actual de la vela para cada marco temporal
- Muestra el patrón actual, si lo hay, en todos los marcos temporales
- Muestra tanto los patrones vigentes como los accionables
- Se actualiza cada 5 segundos (configurable a partir de 1 segundo)
- Le permite hacer clic en el panel para abrir un gráfico en el símbolo y marco temporal seleccionados
- Puede elegir qué plantilla de gráfico se utilizará para abrir los gráficos
- Puede elegir qué grupos y símbolos de esos grupos se mostrarán
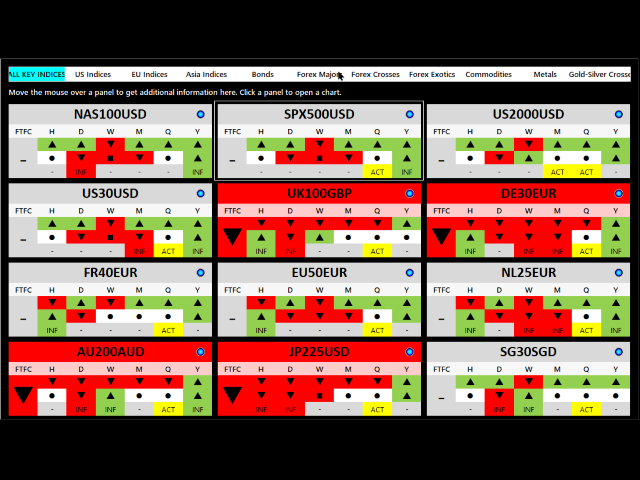
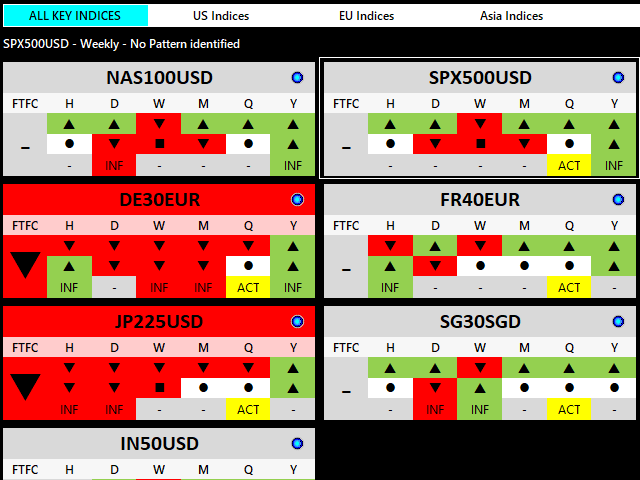
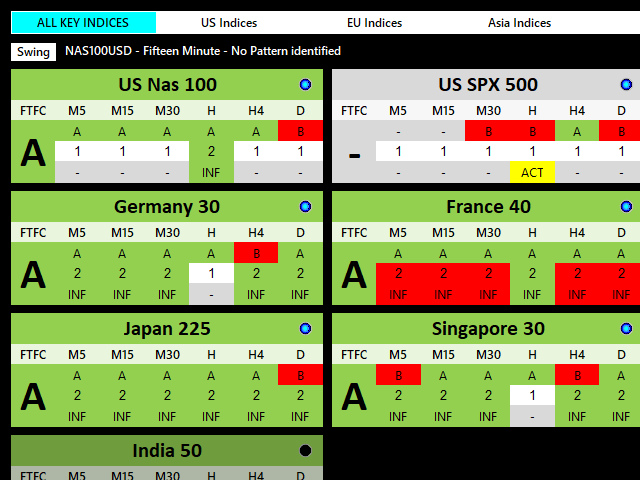
El indicador muestra una instantánea de todos los elementos clave de Strat, continuidad temporal, patrones actuales y estados actuales de las velas, de cualquier símbolo soportado por su broker. Hace esto para todos los marcos de tiempo soportados para que pueda ver exactamente lo que está sucediendo en este momento en el mercado.
Puede agrupar los símbolos como desee y elegir el título de los botones relativos a cada grupo. Tener todos los símbolos de un tipo concreto en pantalla al mismo tiempo le permite detectar similitudes en todo el grupo, lo que facilita su análisis.
Encontrará más información sobre el archivo de configuración aquí: https: //www.mql5.com/en/blogs/post/746142
Si un símbolo no se puede negociar en ese momento, el mercado está cerrado, el corredor está desactivado, etc., el panel de símbolos mostrará los últimos datos disponibles, pero en gris. Un pequeño icono de luz LED también lo muestra.
AJUSTES
SymbolNameDisplayMode
Elija entre Nombre, Descripción o Ambos para el título de cada panel de símbolos.
Temporizador
Establece la vista por defecto para el indicador. Elija entre Day Trader o Swing Trader. Puede cambiar esta configuración en cualquier momento haciendo clic en el botón de la pantalla.
La vista Day Trader muestra los plazos M5, M15, M30, H1, H4 y D1 en cada panel, mientras que la vista Swing Trader muestra H1, D1, W1, MN1, Q e Y.
MostrarIconosStrat
Cuando es true, los paneles muestran Iconos para la dirección de continuidad, estados de velas actuales, patrones y FTFC general.
OcultarSímbolosNeutrales
Cuando es true, se ocultan los símbolos que no tienen una dirección FTFC.
DisplayColumns
Cuántas columnas del panel desea mostrar en el gráfico.
MostrarSeguimientoDelRatón
Cuando es true, se dibuja un contorno alrededor del panel de símbolos sobre el que se encuentra el ratón.
RefreshRateSeconds
El valor por defecto es 5, lo que significa que los datos de cada panel se actualizan cada 5 segundos. El valor debe ser un entero positivo, es decir, mayor que 0.
ChartTemplateFilename
El nombre de archivo de la plantilla a utilizar al abrir un gráfico. Si no se encuentra la plantilla indicada, se utilizará la plantilla por defecto.
BackgroundColour
BullishColour
BearishColour
ColorNeutral
Elija el color que desea utilizar de la selección estándar de MetaTrader.


Does exactly what it says on the tin. Saves a huge amount of time scanning markets, it's up to you how you apply the information it provides to you. You can't trade blindly from any scanner or indicator, that's not what this scanner is intended for. Author was very prompt to my email query re setup and configuration.