Parabolic Predictor
- Indikatoren
-
Thushara Dissanayake
 Ich habe es schon immer geliebt, neue Handelsstrategien zu entwickeln, sie mit Indikatoren zu testen und sie mit Expert Advisors (EAs) zu automatisieren. Willkommen in meiner Welt der Forex-Handelsroboter, Indikatoren und Handelstools – alle speziell für die MetaTrader-Plattform entwickelt.
 - Version: 1.0
- Aktivierungen: 5
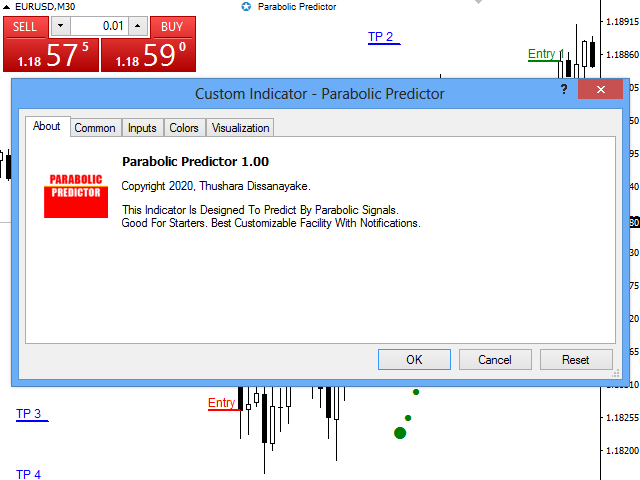
Der Parabolic Predictor ist ein leistungsstarker technischer Indikator, der dazu dient, präzise Trends zu identifizieren und traditionelle parabolische Signale zu filtern, um Markteintritts- und -austrittsniveaus vorherzusagen. Mit seinen fortschrittlichen Techniken bietet dieser Indikator eine genaue Visualisierung der Trendrichtung, optimale Einstiegsniveaus und Gewinnmitnahmeniveaus direkt auf dem Diagramm. Darüber hinaus verfügt es über ein Schnellwarnsystem, das Benachrichtigungen per Mobiltelefon, E-Mail und Popup-Benachrichtigungen sendet, wenn ein Signal generiert oder ein Take-Profit-Level erreicht wird.
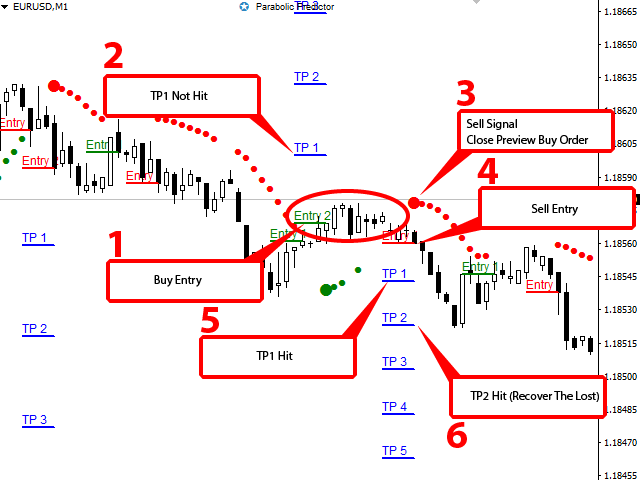
Durch die Einbindung des Parabolic Predictor in Ihre Handelsstrategie können Sie Ihren Ansatz auf verschiedene Weise verbessern. Erstens liefert es Signale, die dabei helfen, Retracements, Umkehrungen, Trends, Einstiegsniveaus und Ausstiegsniveaus zu identifizieren und zu bestätigen. Diese Signale dienen als wertvolle Hilfsmittel zur Steuerung Ihres Entscheidungsprozesses und zur Validierung Ihrer Handelspositionen.
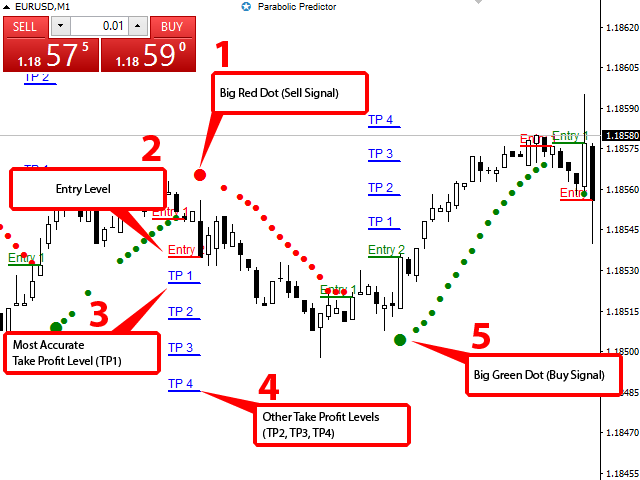
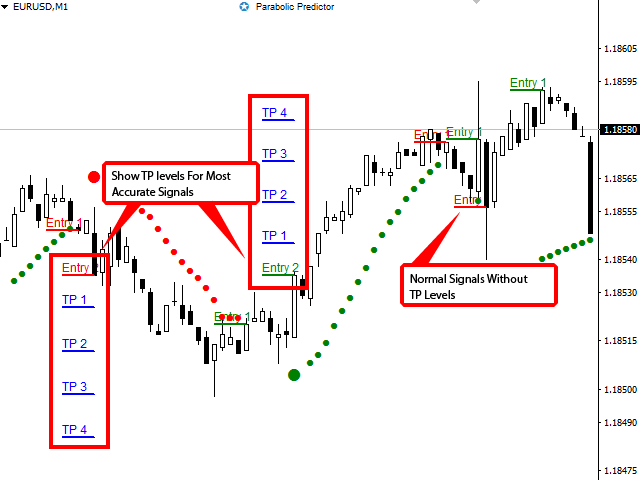
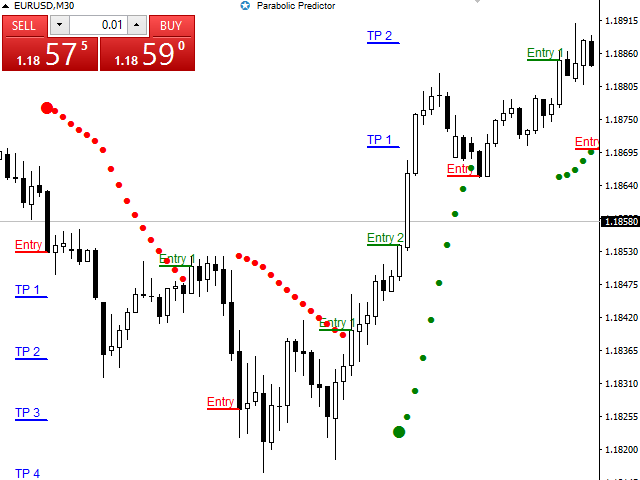
Bei Kaufeinträgen wird ein markanter grüner parabolischer Punkt angezeigt, der auf günstige Marktbedingungen hinweist. Die Einstiegs- und Take-Profit-Level werden ebenfalls aufgezeichnet, sodass Sie optimale Einstiegspunkte und genaueste Take-Profit-Level bestimmen können. Ebenso wird bei Verkaufseinträgen ein deutlicher roter parabolischer Punkt angezeigt, zusammen mit den entsprechenden Einstiegs- und Take-Profit-Levels. Indem Sie diese Ebenen befolgen, können Sie Ihre Trades effektiv verwalten und Ihr Gewinnpotenzial maximieren.
Um Sie zusätzlich zu unterstützen, erkennt der Indikator automatisch, wenn sich die Farbe des parabolischen Punkts ändert, und signalisiert so einen geeigneten Zeitpunkt zum Verlassen Ihrer Position. Diese Funktion stellt sicher, dass Sie über mögliche Marktveränderungen informiert bleiben und rechtzeitig Entscheidungen treffen können.
Was die Funktionen betrifft, zeigt der Parabolic Predictor Einstiegs- und Take-Profit-Levels direkt im Diagrammfenster an und bietet so eine klare visuelle Darstellung der Handelsstrategie. Darüber hinaus stellt die Einbindung von mobilen Benachrichtigungen, E-Mail-Benachrichtigungen und Desktop-Benachrichtigungen sicher, dass Sie kein Signal verpassen oder Gewinneinbußen hinnehmen müssen, selbst wenn Sie sich nicht an Ihrer Handelsplattform befinden.
Aufgrund seiner Vielseitigkeit kann der Parabolic Predictor auf jedes MT4-Paar und jeden Zeitrahmen angewendet werden, sodass er für verschiedene Handelspräferenzen geeignet ist. Der Indikator verfügt außerdem über benutzerfreundliche Parameter, die eine einfache Anpassung und Anpassung an individuelle Handelsstile ermöglichen.
Insgesamt ist der Parabolic Predictor ein umfassendes Tool, das technische Analysetechniken mit erweiterten Filterfunktionen kombiniert. Seine Fähigkeit, Trends zu erkennen, präzise Einstiegs- und Gewinnmitnahmeniveaus bereitzustellen und praktische Warnsysteme anzubieten, macht es zu einem unschätzbaren Vorteil für Händler, die ihre Handelsstrategien verbessern und ihre Handelsergebnisse verbessern möchten.
Parameter
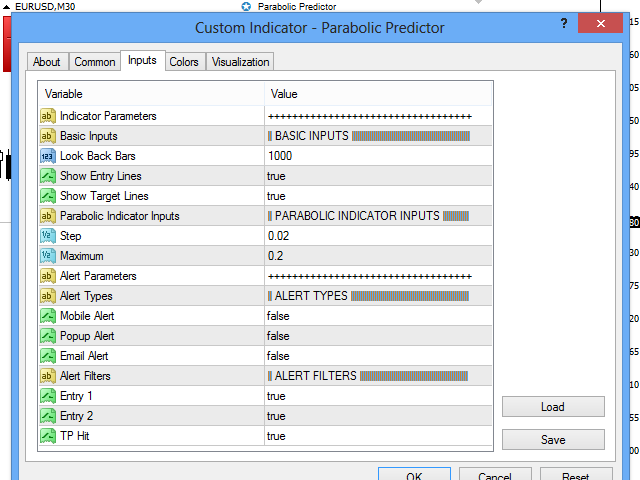
- Indikatorparameter
- Grundlegende Eingaben
- Look Back Balken – Minimale historische Balken zur Berechnung der Indikatordaten
- Eintragszeilen anzeigen – Eintragsebenen anzeigen
- Ziellinien anzeigen - Take-Profit-Niveaus anzeigen
- Eingänge für Parabolindikatoren
- Schritt – Preiserhöhungsschritt – Beschleunigungsfaktor
- Maximum – Maximaler Schrittwert
- Alarmparameter – Passen Sie Alarme für bestimmte Bedingungen an.