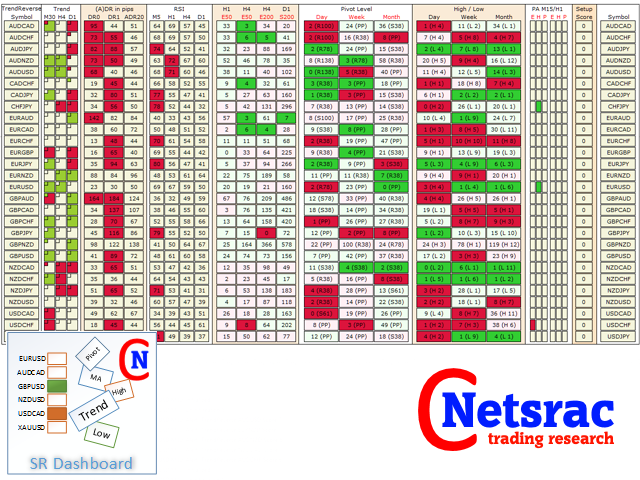
Netsrac SR Dashboard MT5
- Indikatoren
- Version: 2.20
- Aktivierungen: 15

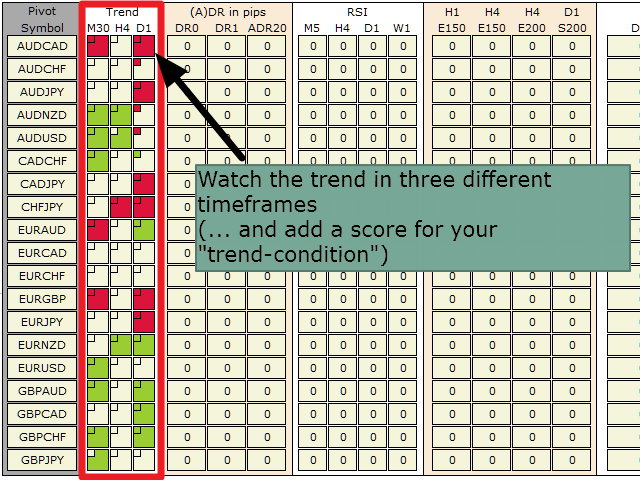
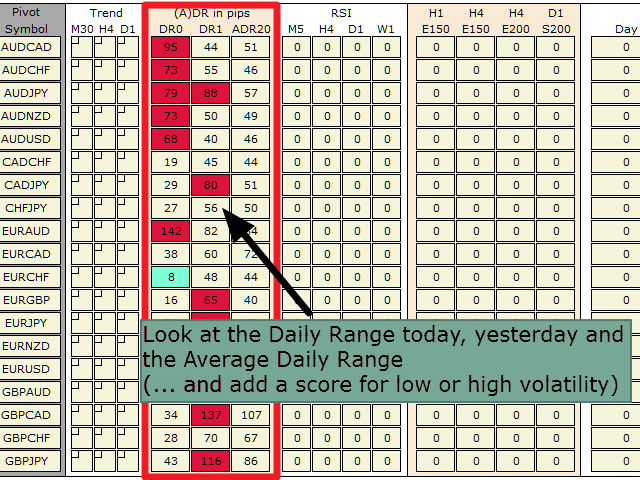
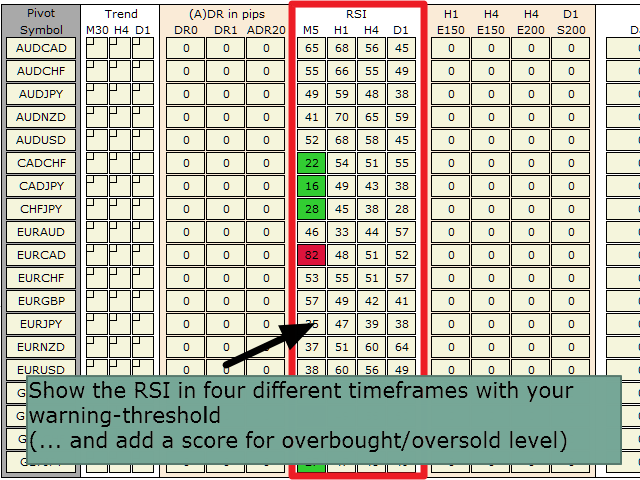
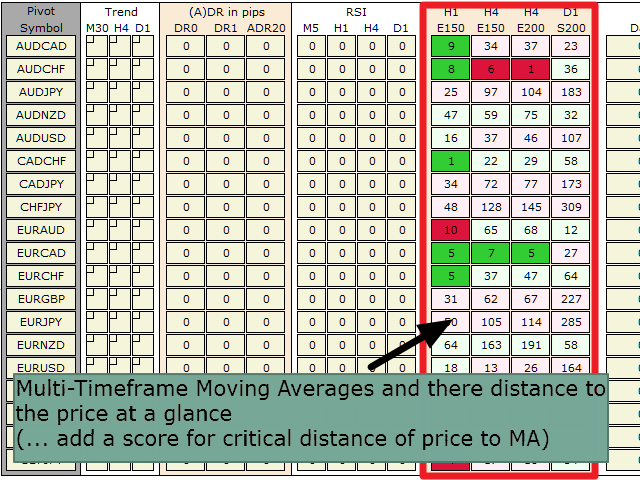
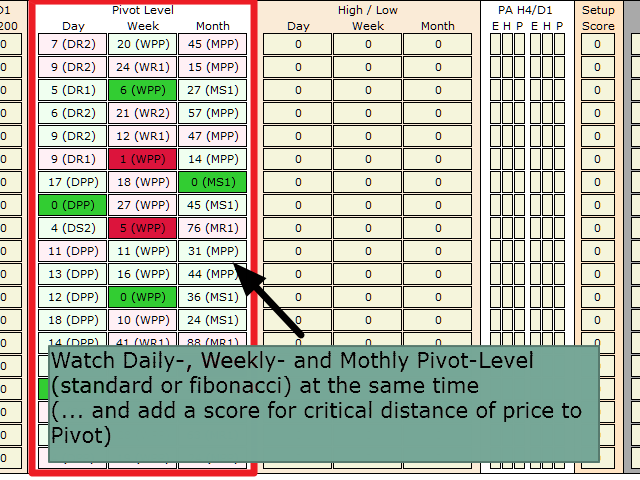
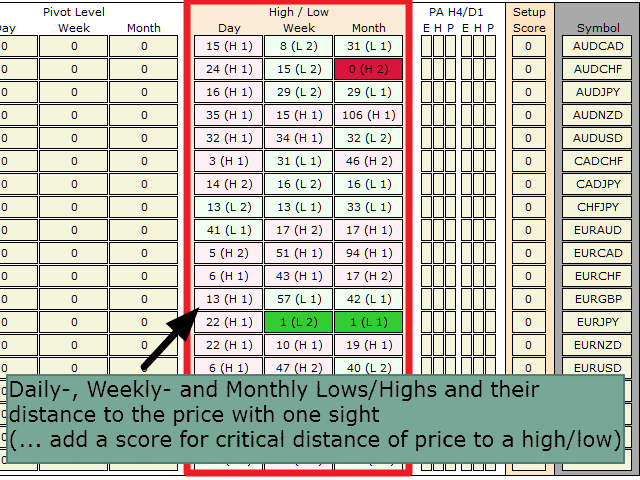
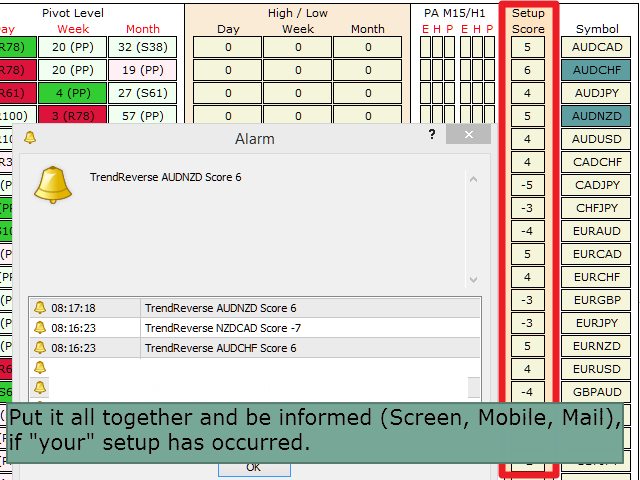
Mit dem SR Dashboard erhalten Sie ein leistungsfähiges Werkzeug, um einige der wichtigsten Informationen im Handel zu kontrollieren. Stellen Sie ein Setup gemäß Ihrer Strategie zusammen und werden Sie informiert, sobald dieses Setup gültig ist. Weisen Sie definierten Bedingungen Scores zu und lassen Sie das Dashboard diese finden. Wählen Sie zwischen Trend, durchschnittlicher Tagesrange, RSI, gleitenden Durchschnitten, Pivot (täglich, wöchentlich, monatlich), Hochs und Tiefs, Candlestick-Mustern.
Was können Sie mit diesem Tool tun?
Nutzen Sie das Dashboard als leistungsstarkes Werkzeug für Ihren diskretionären Handel. Sie werden viel Zeit auf dem Bildschirm sparen können.
Mit dem SR Dashboard werden Sie in der Lage sein, einige interessante Handels-Setups auf schnellere und intelligentere Weise zu finden. Einige dieser Setups werden in unserer SR Dashboard Blogserie beschrieben:
- Verwendung des "Netsrac SR Dashboard" (Kurzanleitung)
- Pinbars handeln
- Schnelle Setups mit dem Dashboard
- Handeln Sie das Engulfing-Muster
- Wöchentliche Pivots als potentielle Umkehrpunkte
- Scalping des kurzfristigen Trends
- ... (kann fortgesetzt werden)
Manuell

Great dashboard with many functionality that can accomodate range or trend following strategy. Also the author is very helpful and quick to respond with solution. The manual for practical uses is readily available and provide great detail. Hopefully Carsten keep his tools and blog updated. Good job!