Technical Analysis Ind
- Indicadores
- Versión: 1.0
- Activaciones: 5
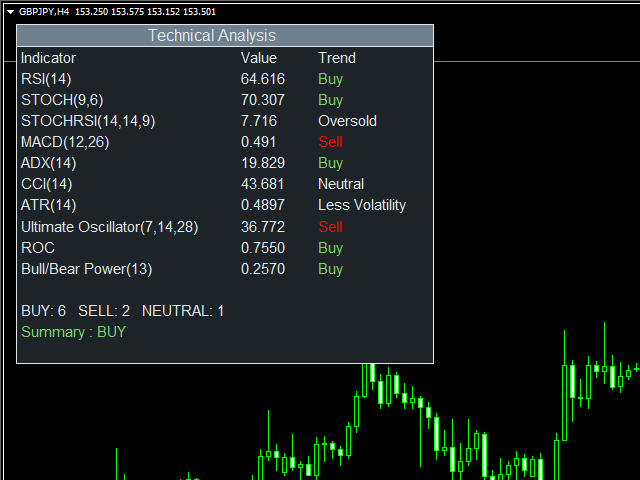
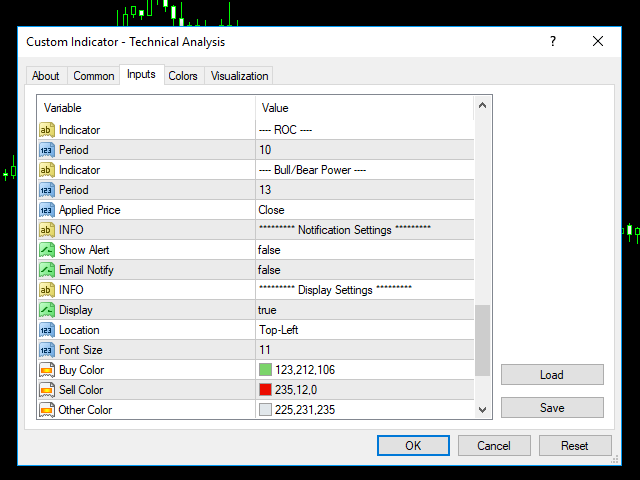
Con el indicador de Análisis Técnico, puede encontrar las señales de trading utilizando la combinación de diferentes indicadores técnicos. Soporta los siguientes indicadores técnicos:
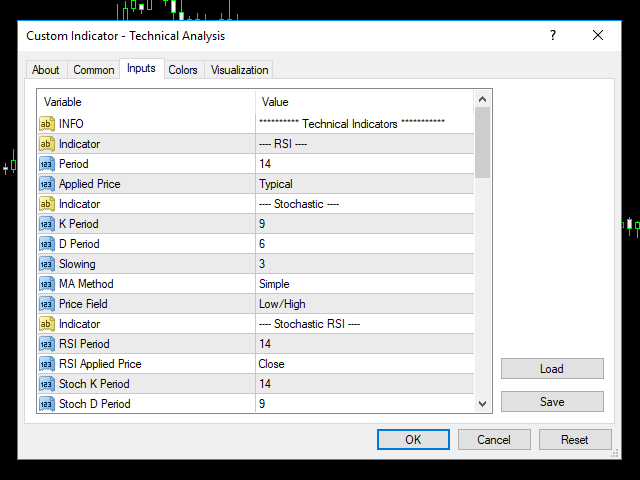
1.RSI
2.Estocástico
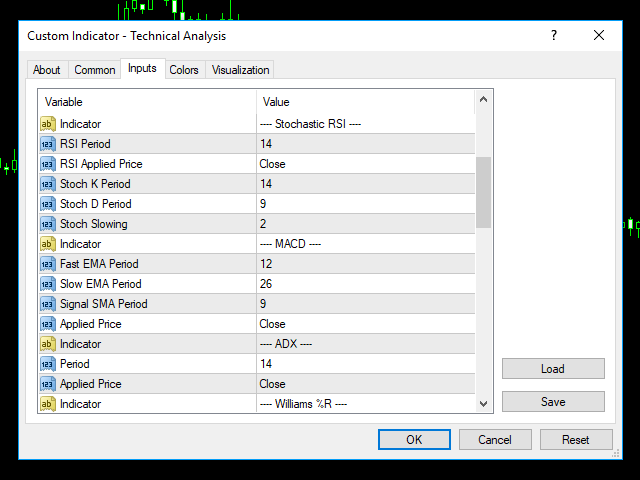
3.Estocástico RSI
4.MACD
5.ADX
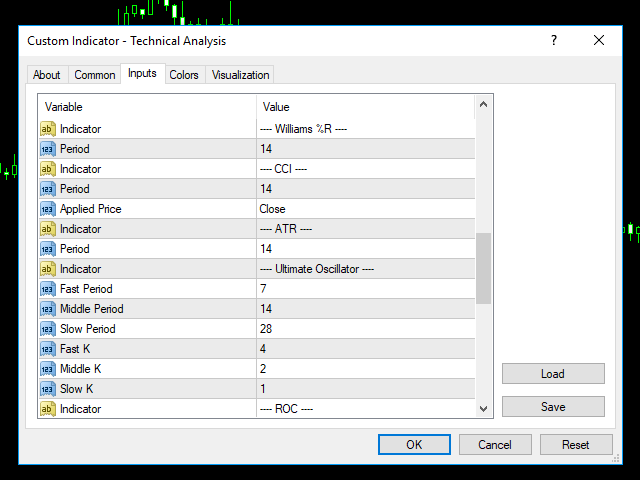
6.CCI
7.ATR
8.Oscilador Último
9.ROC
10.Fuerza del Toro/Oso
Después de conectar el indicador a un gráfico mostrará la siguiente información en el gráfico:
1.Indicadores técnicos, sus valores y la señal generada a partir de ellos.
2.Conteo de compra y venta
- Resumen: Conclusión