Technical Analysis Ind
- 지표
- 버전: 1.0
- 활성화: 5
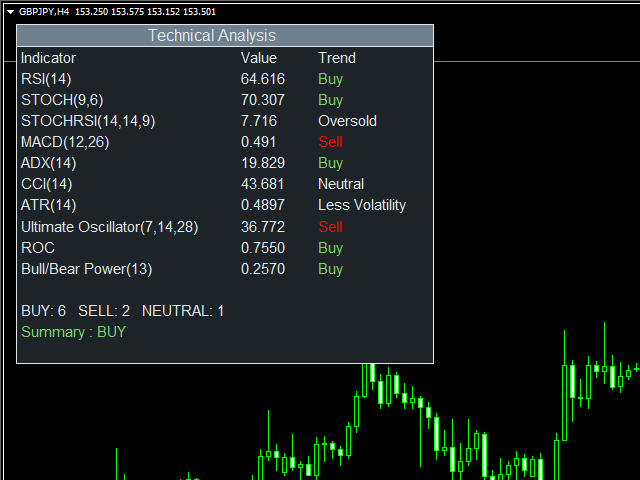
With the Technical Analysis indicator, you can find the trading signals using the combination of different technical indicators. It supports the following technical indicators:
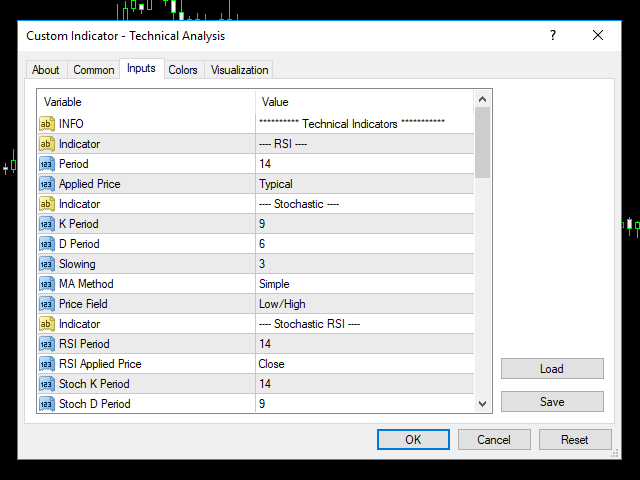
1. RSI
2. Stochastic
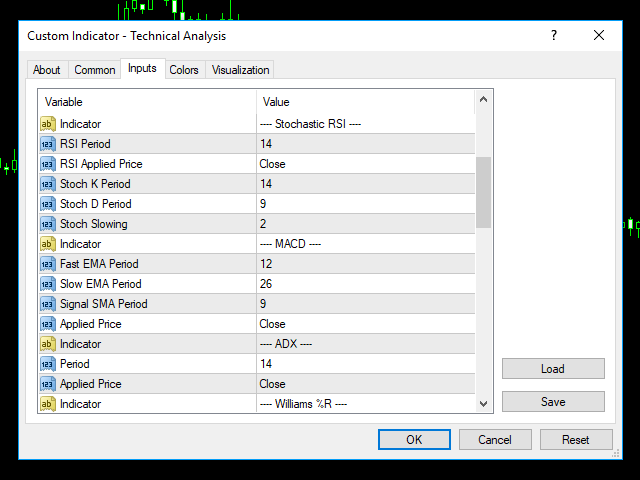
3. Stochastic RSI
4. MACD
5. ADX
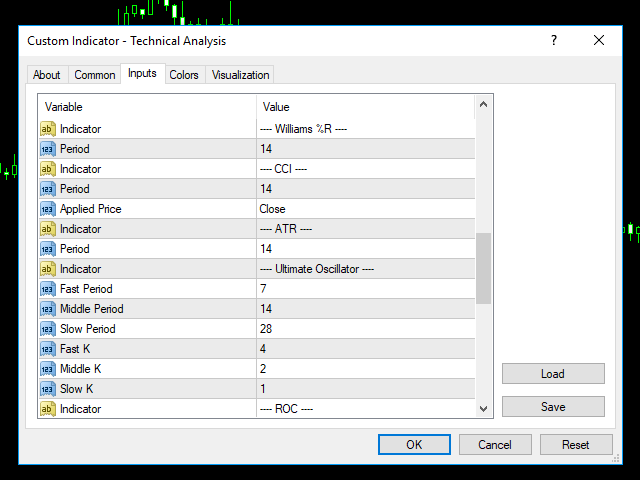
6. CCI
7. ATR
8. Ultimate Oscillator
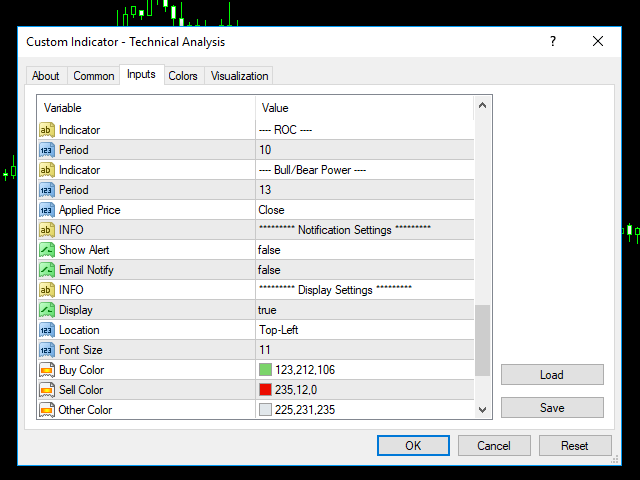
9. ROC
10. Bull/Bear Power
After you attached the indicator to a chart it will show the following information on the chart:
1. Technical indicators, their values and the signal generated from them.
2. Buy and Sell count
- Summary: Conclusion