Trend Histogram MT5
- Indikatoren
- Version: 3.4
- Aktualisiert: 19 November 2021
- Aktivierungen: 5

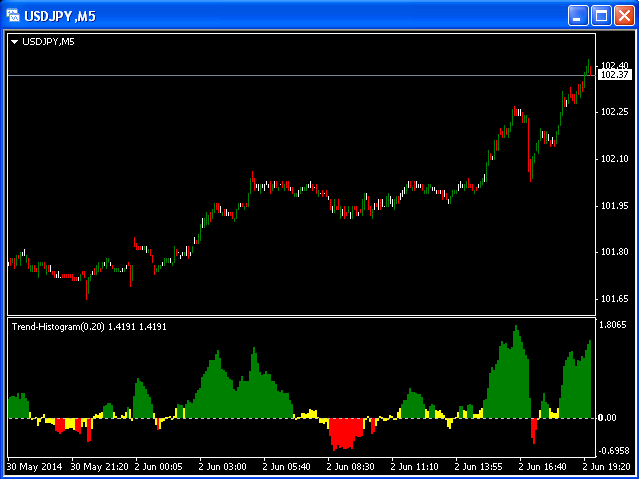
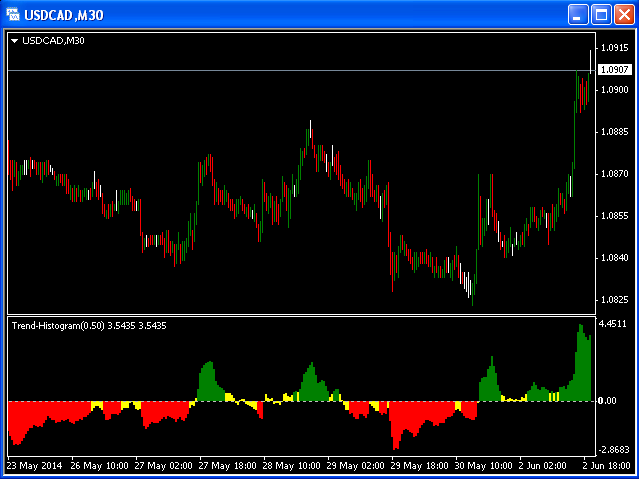
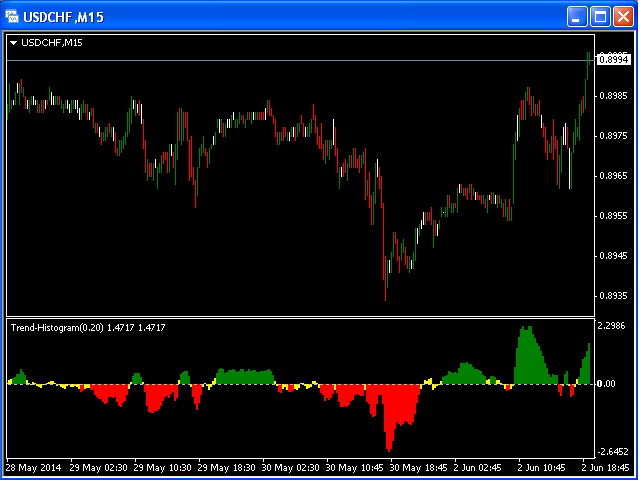
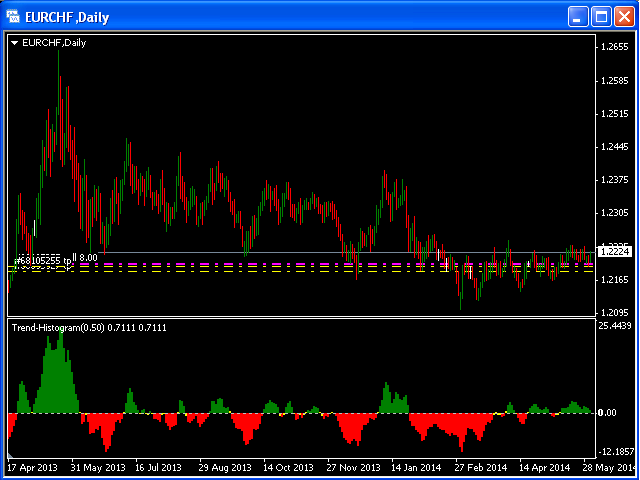
Trendindikatorenzeigen an, in welche Richtung sich der Markt bewegt, wenn es überhaupt einen Trend gibt , da sie sich wie eine Welle zwischen hohen und niedrigen Werten bewegen
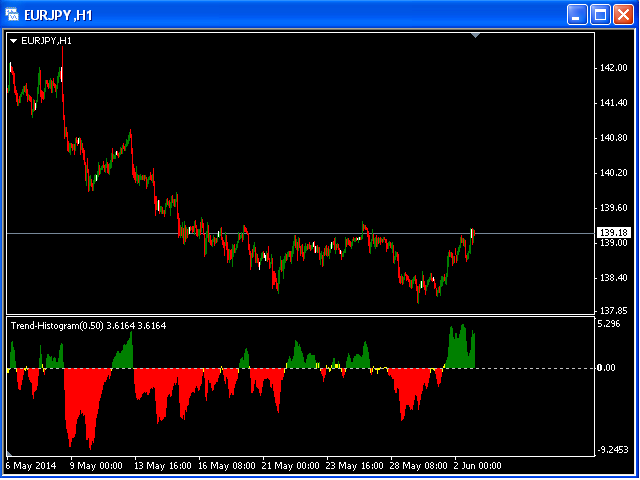
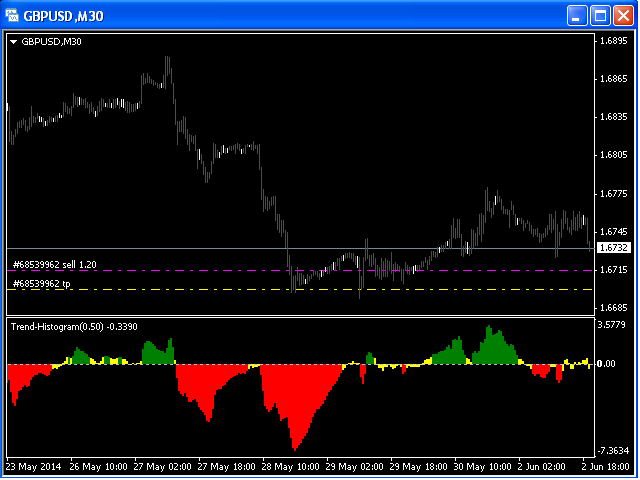
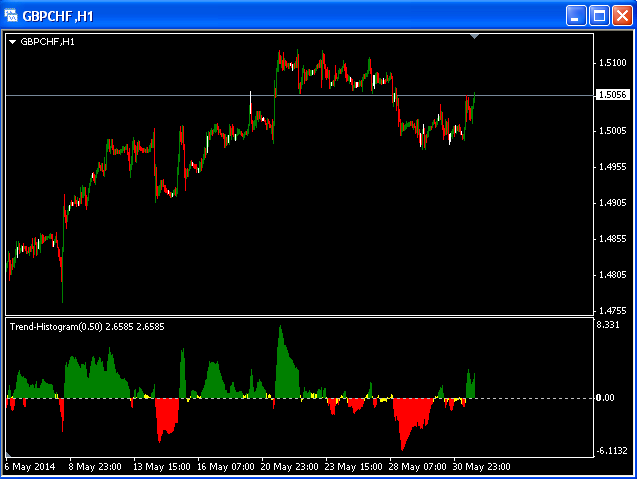
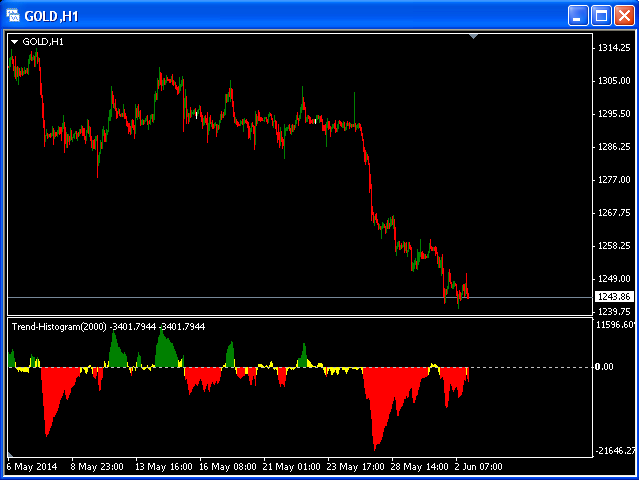
Dieser Indikator zeigt Aufwärtstrend (grünes Histogramm), Abwärtstrend (rotes Histogramm) und Seitwärtstrend (gelbes Histogramm) an.
Es gibt nur einen Eingabeparameter: ActionLevel. Dieser Parameter hängt von der Länge des angezeigten Seitwärtstrends ab.