FuTuRe 02 Phi Cubic Fractals Pack2
- Indikatoren
- Version: 191.207
- Aktualisiert: 8 Dezember 2019
- Aktivierungen: 5
PACK 2 von Phi Cubic Fractals mit der Option, die Indikatoren in FUTURE, auf der rechten Seite des Charts zu erweitern
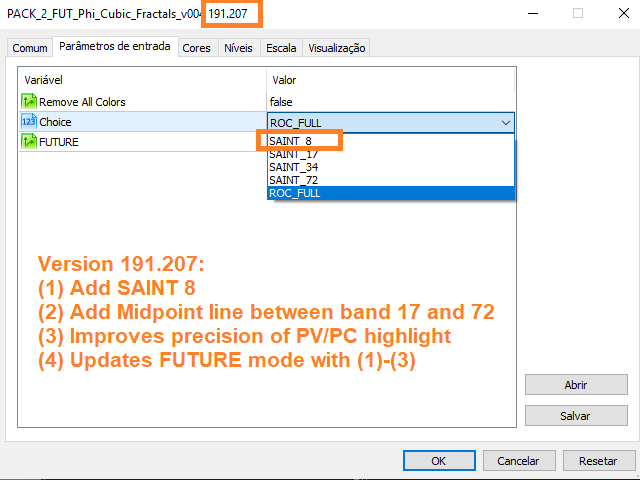
Dieses Produkt enthält die Indikatoren von PACK 2 (ROC voll / SAINT 8 / SAINT 17 / SAINT 34 / SAINT 72 ) + FUTURE MODE
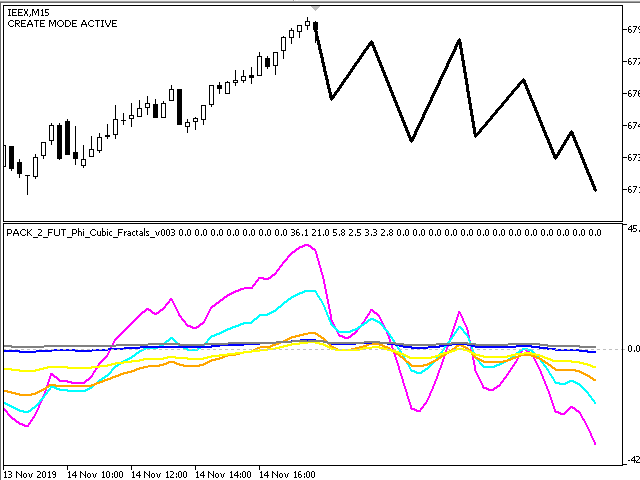
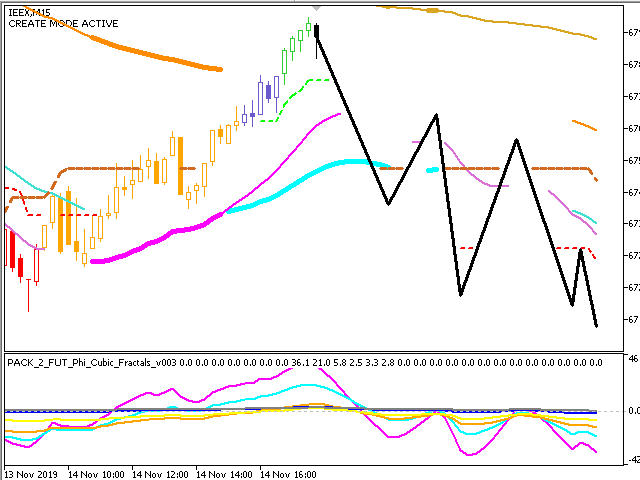
- Phi ROC - ein Oszillator-Indikator, ähnlich dem MIMAROC, der in der Lage ist, die Richtung und Stärke des Marktes anzuzeigen und den optimalen Einstiegspunkt zu bestimmen;
- Phi SAINT - ein oszillatorähnlicher Indikator, ähnlich dem SANTO von Phicube, der die Richtung und Stärke des Marktes anzeigt und den optimalen Einstiegspunkt bestimmt;
Um von einem Expert Advisor (EA) aus auf diese Durchschnittswerte zugreifen zu können, müssen Sie mit der Funktion iCustom ein Handle für diesen Indikator mit den gewünschten Eingabeparametern erstellen und dann CopyBuffer verwenden, um einen bestimmten Indikator zu kopieren und ihn über die Puffernummer aufzurufen, wie unten dargestellt:
//Indikator Eingabeparameter Future Pack2
bool NoColors=false;//Remove a cor interna do Santo
enum ENUM_OPTIONS {SAINT_8, SAINT_17,SAINT_34,SAINT_72,ROC_FULL}; //Lista os Indicadores disponíveis
ENUM_OPTIONS Choice = ROC_FULL; //Seleciona o Indicador desejado
bool FUTURE = false;
Puffer für ROC [Typ: double]
-
buffer_num = 7 ==> ROC 17 : Magenta
-
buffer_num = 8 ==> ROC 34 : Hellblau
-
buffer_num = 9 ==> ROC 72 : Orange
-
buffer_num = 10 ==> ROC 144 : Gelb
-
buffer_num = 11 ==> ROC 305 : Dunkelblau
-
buffer_num = 12 ==> ROC 610 : Grau
Puffer für SAINT [Typ: double]
-
buffer_num = 2 ==> Schnelles Band 17
-
buffer_num = 3 ==> Langsames Band 72
-
buffer_num = 4 ==> SAINT Zeile 8, 17, 34 oder 72 (je nach Eingangsauswahl)
-
buffer_num = 5 ==> PV (kein Verkauf / Aufwärtstrend, SAINT-Linie grün hervorgehoben)
-
buffer_num = 6 ==> PC (Keine Käufe/Tiefstkurs, SAINT-Linie rot hinterlegt)
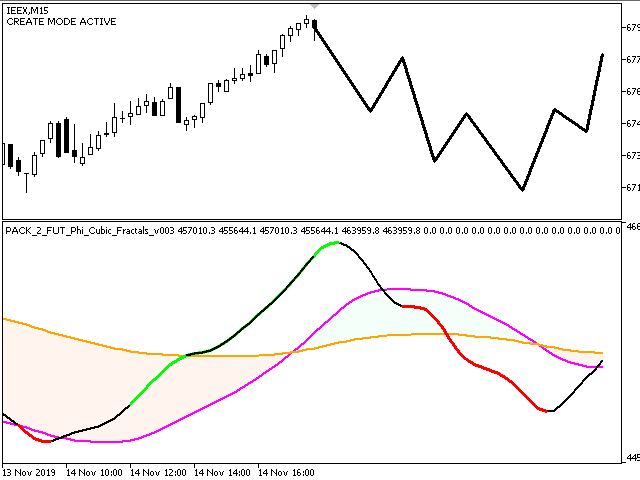
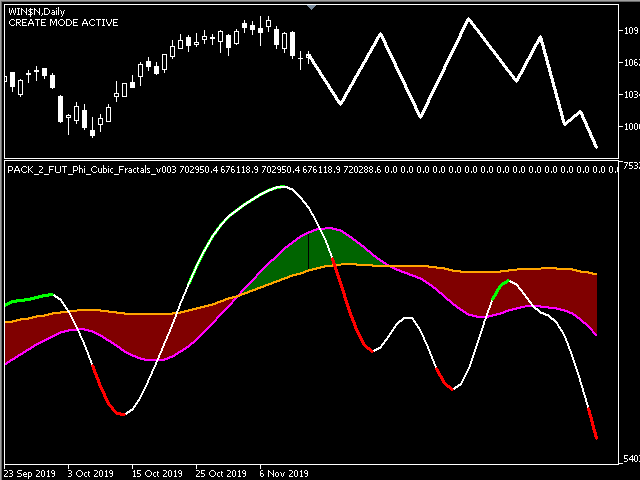
ZUKUNFTSMODUS
Der FUTURE-Modus funktioniert mit allen Indikatoren des PACK 2 (ROC full / SAINT 8 / SAINT 17 / SAINT 34 / SAINT 72 ), sowohl im Hauptchart als auch im Strategietester. Im Hauptchart können Sie die Indikatoren bis zu 610 Kerzen in die Zukunft verlängern. Im Strategietester können Sie die Indikatoren von jeder beliebigen Kerze in der Vergangenheit aus in die Zukunft verlängern ("back to the future"). Im Strategietester müssen mindestens 610 Kerzen in der Vergangenheit geladen sein, damit der Indikator die Linien anzeigt und im FUTURE-Modus arbeitet.
Der FUTURE-Modus funktioniert sowohl im Aftermarket als auch im Live-Markt. Wenn der Indikator geladen wird, werden die Linien berechnet und eingefroren, sie werden nicht mit neuen Kerzen aktualisiert. Im FUTURE-Modus können Sie die Indikatoren bis zur letzten verfügbaren Kerze neu berechnen (aktualisieren), indem Sie die BACKSPACE-Taste drücken (dies löscht alle zuvor erstellten Future-Zeichnungen).
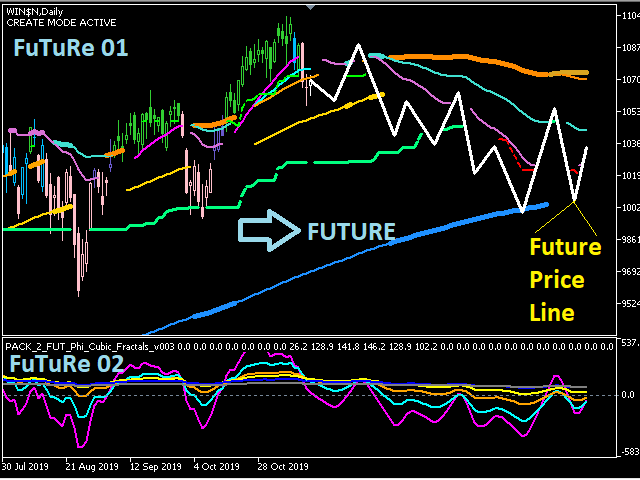
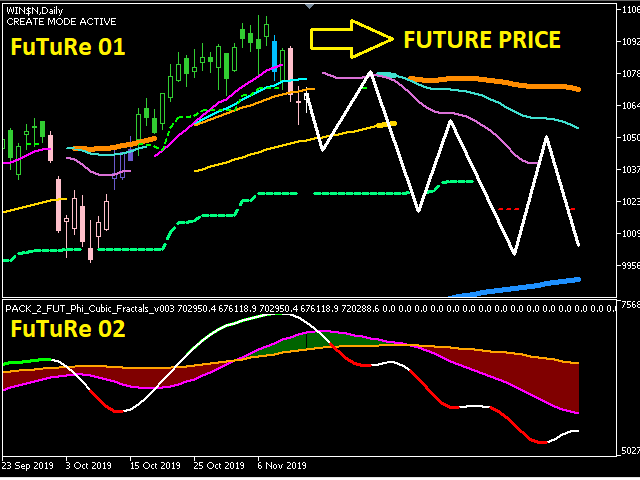
Mit der UMSCHALTTASTE können Sie zwischen dem "ERSTELLUNGSMODUS" und dem "ANPASSUNGSMODUS" wählen. Im "ERSTELLUNGSMODUS" wird mit jedem Klick auf der rechten Seite des Diagramms eine neue Kurslinie in die Zukunft gezeichnet, beginnend mit dem Ende der zuletzt gezeichneten Linie. Im "ANPASSUNGSMODUS" wird mit jedem Klick der Endpunkt der zuletzt gezeichneten Kurslinie verändert. Mit der Taste LÖSCHEN löschen Sie den gesamten gezeichneten Future und kehren in den Ausgangszustand zurück, in dem der Chart geladen wurde.
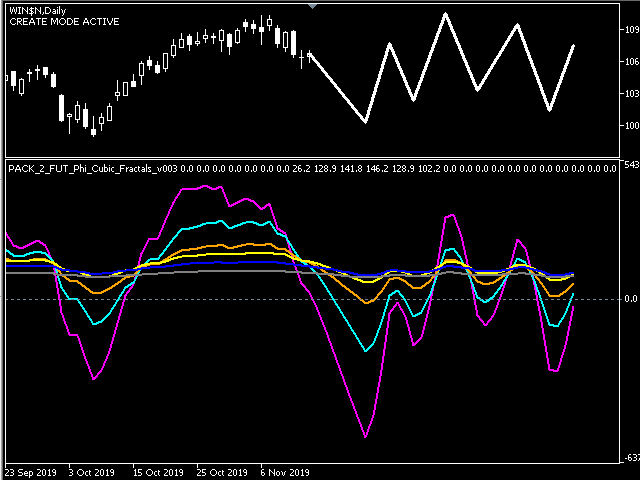
Wenn der FuTuRe 01-Indikator (Indikatoren des oberen Fensters) zusammen mit dem FuTuRe 02-Indikator (Indikatoren des unteren Fensters) geladen wird, arbeiten beide synchronisiert auf dem Hauptchart und folgen den Klicks auf dem oberen Chart. Siehe Abbildungen für weitere Details.
Phi Cubic Fractals Kanal auf You Tube
https://www.youtube.com/channel/UCXYSemYcmydg-CAuyTu3Jaw/featured
WhatsApp-Gruppe:
https://chat.whatsapp.com/Jf8Ah4SDgslJMMfxz2jByj
*** DEMO DOWNLOAD funktioniert nur im Strategietester und nur mit dem Asset "IEEX" (BOVESPA) oder "AUDJPY" (FOREX) ***


Excelente, está sendo muito útil. Será que vc conseguiria acrescentar SANTO 144 e SANTO 305 ?