Levels for MT5 by OptionClue
- Indikatoren
- Version: 2.4
- Aktualisiert: 31 August 2019
- Aktivierungen: 5

Der Levels-Indikator wurde entwickelt, um den Prozess der Darstellung von Unterstützungs- und Widerstandsniveaus und -zonen auf ausgewählten Zeitrahmen zu vereinfachen. Der Indikator stellt die nächstgelegenen Niveaus der ausgewählten Zeitrahmen dar, die in verschiedenen Farben hervorgehoben werden. Dadurch wird die Zeit, die für die Darstellung auf dem Chart benötigt wird, erheblich reduziert und die Marktanalyse vereinfacht.
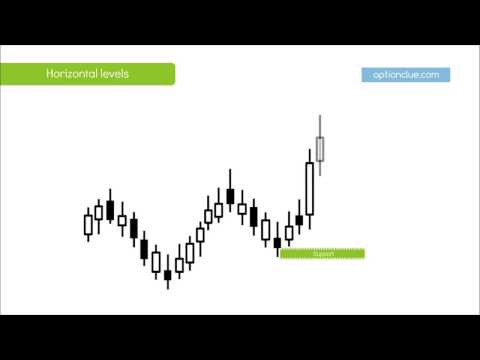
Horizontale Unterstützungs- und Widerstandsniveaus werden verwendet, um Preiszonen zu identifizieren, in denen sich die Marktbewegung verlangsamen kann oder eine Preisumkehr wahrscheinlich ist. Der Levels-Indikator hilft bei der Ermittlung der optimalen Einstiegs- und Ausstiegssignale, die während einer tiefen Marktkorrektur auftreten, oder bei der Berechnung von Stop Loss und Take Profit.
Der Levels-Indikator zeichnet Unterstützungs- und Widerstandsniveaus auf der Grundlage von Kursmustern ein, die an lokalen Kursumkehrpunkten im Chart auftreten. Sie sind universell und können ohne Anpassung an historische Daten verwendet werden. Derzeit umfasst der Levels-Indikator 28 Preismuster, die sich gegenseitig ergänzen.
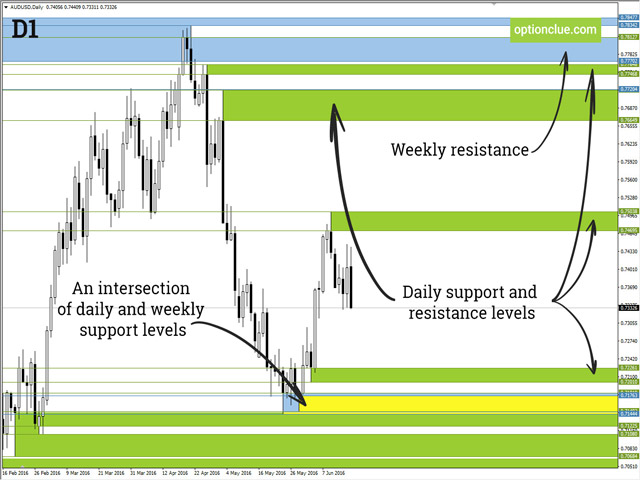
Die Farben der Preiszone und der horizontalen Linien hängen vom Zeitrahmen ab und können in den Einstellungen des Indikators geändert werden. Der Indikator stellt Unterstützungs- und Widerstandsniveaus auf den ausgewählten und unteren Zeitrahmen dar. Er hält die Charts so übersichtlich wie möglich und ermöglicht es, die wichtigsten Kursniveaus zu sehen, ohne zwischen den Zeitrahmen zu wechseln.
Vorteile des Indikators
- Vielseitigkeit - horizontale Unterstützungs- und Widerstandsniveaus sind universell und können ohne Anpassung an historische Daten verwendet werden
- Einfachheit - die meisten Einstellungen des Indikators beziehen sich auf die Farbe
- Absolutheit - im Gegensatz zu vielen anderen technischen Indikatoren (Gleitender Durchschnitt, RSI, Stochastik und andere) basiert Levels auf der reinen Preisaktion und nicht auf deren Ableitungen.
- Händler sind gezwungen, Unterstützungs- und Widerstandsniveaus immer wieder neu zu bestimmen. Und je niedriger der Zeitrahmen ist, desto häufiger sollten Sie die nächstgelegenen Kursniveaus aktualisieren. Diese Aufgabe wird mit Hilfe des Indikators erheblich vereinfacht.
Wie Unterstützungs- und Widerstandsniveaus erstellt werden
Horizontale Unterstützungs- und Widerstandsniveaus werden seit Anfang des 20. Jahrhunderts im Handel verwendet. Sie funktionieren, weil die Händler glauben, dass sie es müssen. Der Levels-Indikator stellt Unterstützungs- und Widerstandsniveaus auf der Grundlage von Kursmustern dar, die an lokalen Kursumkehrpunkten auf dem Diagramm auftreten. Sie sind universell und können ohne Anpassung an historische Daten verwendet werden.
Anzeige auf dem Chart
Die Farben der Preiszone und der horizontalen Linien hängen vom Zeitrahmen ab und können in den Einstellungen des Indikators geändert werden. Der Indikator stellt Unterstützungs- und Widerstandsniveaus auf den ausgewählten und unteren Zeitrahmen dar. Er hält die Charts so übersichtlich wie möglich und ermöglicht es, die wichtigsten Preisniveaus zu sehen, ohne zwischen den Zeitrahmen zu wechseln. Ein Schnittpunkt von Niveaus auf verschiedenen Zeitrahmen ist oft eine wichtige Preiszone und wird auf dem Chart als Farbkombination angezeigt.
Die am besten geeigneten Parameter für jeden Zeitrahmen können in den Einstellungen des Indikators ausgewählt werden
- Levels auf diesem Zeitrahmen darstellen ( ja = wahr, nein = falsch). Der Indikator stellt horizontale Niveaus auf verschiedenen Zeitrahmen dar, standardmäßig täglich. Um z.B. stündliche (H1) Levels zu sehen, setzen Sie den Parameter "Plot levels on H1 timeframe" von false auf true.
- Die Anzahl der Ebenenpaare ( 1 Ebenenpaar bedeutet Unterstützung und Widerstand). Standardmäßig ist dieser Parameter gleich 1, d.h. es gibt nur eine Unterstützung und einen Widerstand auf jedem ausgewählten Zeitrahmen. In den meisten Fällen reicht diese Anzahl von Levels aus, um die wichtigsten Kursziele zu bestimmen.
- Die Farbe der Unterstützungs- oder Widerstandszone
- Die Farbe des Preisniveaus der Unterstützung oder des Widerstands
Der untere Teil des Fensters enthält allgemeine Einstellungen, die auf jeden Zeitrahmen angewendet werden:
- Die Plotting-Tiefe ist standardmäßig auf 200 Balken eingestellt. Das bedeutet, dass die Unterstützungs- und Widerstandsniveaus anhand der letzten 200 Balken erstellt werden. Je höher die Plotting-Tiefe, desto weiter entfernte Niveaus werden geplottet und desto höher ist die Systembelastung. Wenn Sie an 1-2 nächstgelegenen Niveaus interessiert sind, sollten Sie diesen Parameter auf 30-40 verringern.
- Überlappende Preiszonen plotten ( ja = wahr, nein = falsch). Mit diesem Parameter können Sie wählen, ob sich überlappende Preiszonen eines ähnlichen Zeitrahmens gezeichnet werden sollen oder nicht. Dadurch wird das Preisdiagramm klarer und anschaulicher. Dieser Parameter ist standardmäßig deaktiviert, aber wenn man alle möglichen Niveaus und ihre Überschneidungen sehen möchte, kann man in Erwägung ziehen, ihn zu aktivieren.


What a great indicator! It's really helpful!