Clever Order Blocks
- Indikatoren
-
Carlos Forero
 Ich bin ein professioneller Entwickler und Trader mit über einem Jahrzehnt Erfahrung in den Kapitalmärkten und der Erstellung algorithmischer Portfolios. Ich bin auf fortschrittliche automatisierte Systeme und technische Analysetools für MetaTrader spezialisiert.
⚙️ Entwicklungsphilosophie - Version: 1.60
- Aktualisiert: 15 Januar 2025
- Aktivierungen: 5
Beschreibung
Sehr präzise zu erkennende Muster: Einstiegssignale sowie Ausbruchs-, Unterstützungs- und Widerstandsumkehrmuster. Es zeigt Zonen auf, in denen mit hoher Wahrscheinlichkeit institutionelle Aufträge platziert wurden, die das Potenzial haben, die Richtung des Preises zu ändern und sich in diese Richtung zu bewegen.
KEY LINKS: Indikator-Handbuch - Installationsanleitung - Häufige Fragen - Alle Produkte
Wie nützlich ist dieser Indikator?
- Er ermöglicht es Ihnen, auf die Richtung des Auftrags zu handeln, sobald die Richtung identifiziert wurde.
- Er ermöglicht Ihnen den Handel mit Retracement- oder Breakout-Mustern, sobald diese in einer bestimmten Zone auftreten.
- Sie werden in der Lage sein, potenzielle Widerstands- oder Unterstützungsniveaus zu identifizieren. Achten Sie darauf, dass Sie diese Niveaus als Gewinnmitnahmezonen nutzen können.
- Sie können diesen Indikator mit Trend- und Market-Maker-Mustern kombinieren. Um diese Muster zu identifizieren.
Bestandteile
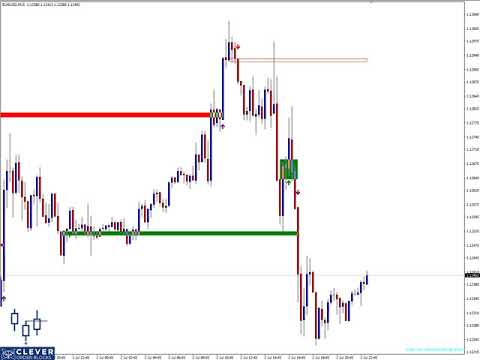
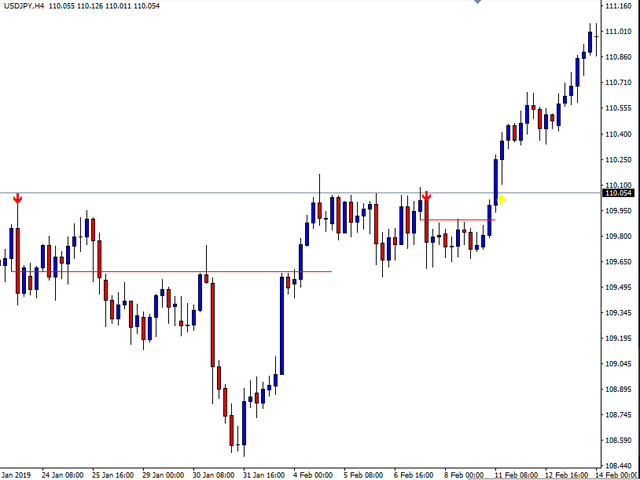
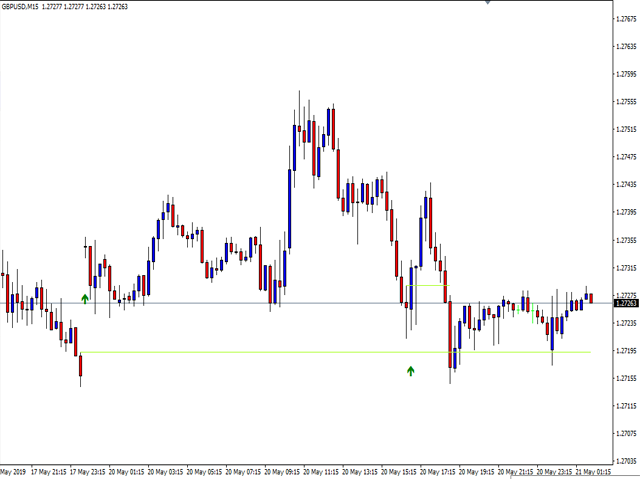
- Horizontale grüne Linien: Diese stellen bullische Orderblöcke dar.
- Horizontale rote Linien: Diese stellen bärische Auftragsblöcke dar.
- Grüne und rote Pfeile: Bullische oder bearische Signale der letzten OB Formed
- Gelbe Pfeile: Bullische oder bearische Signale für den Ausbruch aus dem OB.
Über den Autor:
Carlos Forero, Mitglied des Clever Trading Club, einer privaten Organisation, deren Ziel es ist, clevere Lösungen zu entwickeln, um konstante Gewinne mit angepasstem Risiko zu erzielen.

I was renting for three months, but I notice very few buy and sell signals This can be modified