Clever Order Blocks

5

Description

Very precise patterns to detect: entry signals as well as breakout, support and resistance reversal patterns. It points out zones in which, with a high probability, institutional orders with the potential to change the price’s direction and keep moving towards it, have been placed. 

KEY LINKS: Indicator Manual – How to Install  – Frequent Questions All Products 

How is this indicator useful?

  • It will allow you to trade on the order’s direction, once its direction has been identified.
  • It will allow you to trade retracement or breakout patterns, everytime they occur in a given zone.
  • You’ll be able to identify potential resistance or support levels. Be mindful that you can use these levels as take profit zones.
  • You’ll be able to combine this indicator with trend and market maker patterns. In order to identify these patterns.
Note 1: This indicator should only be considered as a part of any trading strategy. You should complement this with other filters (e.g trend, volatility, time, etc). Note 2: This indicator is meant to serve as a guide to apply in your intraday trading. Overtime, this will help you understand the baseline for a solid and consistent trading strategy.  

Components

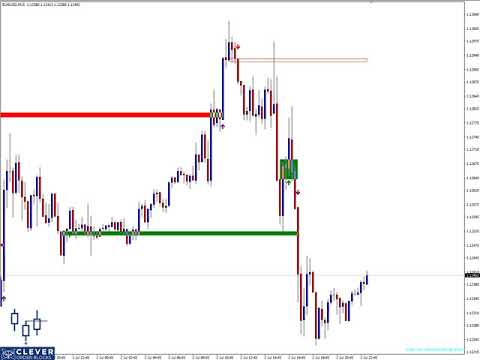
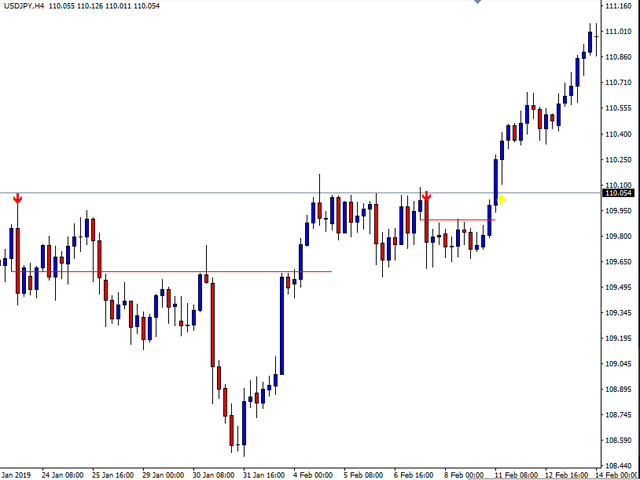
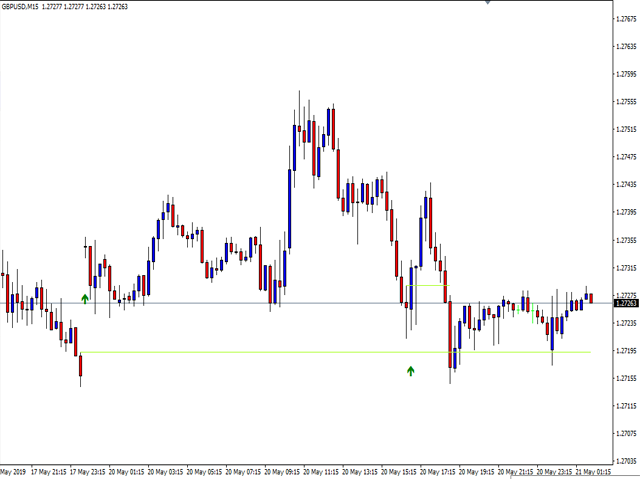
  • Horizontal green lines: These represent bullish order blocks.
  • Horizontal red lines: These represent bearish order blocks.
  • Green, red Arrows: Bullish or Bearish signal of recent OB Formed
  • Yellow Arrows: Bullish or Bearish signal of Breakout of OB.

About Author:

Carlos Forero, Member of Clever Trading Club, private organization with the purpose of design clever solutions to generate constant profits with adapted risk.


İncelemeler 2
turky7713
466
turky7713 2021.03.20 11:18 
 

I was renting for three months, but I notice very few buy and sell signals This can be modified

Aravind Kolanupaka
9839
Aravind Kolanupaka 2019.06.16 00:12 
 

Good. Do not trade arrow to arrow as signals, use it along with your strategy.

Önerilen ürünler
BONUS INDICATOR HERE :  https://linktr.ee/ARFXTools Trading Flow Using Fibo Eminence Signal 1️⃣ Wait for the Fibonacci to Auto-Draw The system automatically detects swings (from high to low or vice versa) Once the Fibonacci levels appear, the indicator sends an alert notification “Fibonacci detected! Zone is ready.” 2️⃣ Check the Entry Zone Look at the ENTRY LINE (blue zone) This is the recommended SELL entry area (if the Fibonacci is drawn from top to bottom) Wait for the price to enter
VR Cub
Vladimir Pastushak
VR Cub , yüksek kaliteli giriş noktaları elde etmenin bir göstergesidir. Gösterge, matematiksel hesaplamaları kolaylaştırmak ve bir pozisyona giriş noktalarının aranmasını basitleştirmek için geliştirildi. Göstergenin yazıldığı ticaret stratejisi uzun yıllardan beri etkinliğini kanıtlamaktadır. Ticaret stratejisinin basitliği, acemi yatırımcıların bile başarılı bir şekilde ticaret yapmasına olanak tanıyan büyük avantajıdır. VR Cub, pozisyon açılış noktalarını ve Kâr Al ve Zararı Durdur hedef sev
Forex Gump Trend is a universal indicator for highly effective determination of the trend direction. If you identify the trend correctly, this is 95% of trading success, because you will be able to open trades in the direction of the price movement and benefit from it. The Forex Gump Trend indicator helps traders with a high degree of efficiency to determine the current trend direction, as well as trend reversal points. The direction of the trend is shown by colored lines on the chart, and the
Trendiness Index
Libertas LLC
5 (3)
"The trend is your friend" is one of the best known sayings in investing, because capturing large trendy price movements can be extremely profitable. However, trading with the trend is often easier said than done, because many indicators are based on price reversals not trends. These aren't very effective at identifying trendy periods, or predicting whether trends will continue. We developed the Trendiness Index to help address this problem by indicating the strength and direction of price trend
Trend Map
Maryna Shulzhenko
The Trend Map indicator is designed to detect trends in price movement and allows you to quickly determine not only the direction of the trend, but also to understand the levels of interaction between buyers and sellers. It has no settings and therefore can be perceived as it signals. It contains only three lines, each of which is designed to unambiguously perceive the present moment. Line # 2 characterizes the global direction of the price movement. If we see that the other two lines are above
“Naturu”, doğanın simetrisini algoritması olarak kullanan bir manuel indikatördür. Basit bir strateji ve gizli bilgelikle piyasayı fethedin! İndikatörü yüklediğinizde iki çizgi görürsünüz: Üst (Top) ve Alt (Bottom). Bir çizgiye tıklayarak aktifleştirin. Taşımak için, yerleştirmek istediğiniz mumun üzerine tıklayın. Bir tepe noktası ve bir dip noktası belirlersiniz, indikatör otomatik olarak hesaplar: Boğalar ve ayıların çıkarlarının en yakınlaştığı, destek veya direnç rolü oynaması en muhtemel b
If you do not have your own trading strategy yet, you can use our ready-made trading strategy in the form of this indicator. The Your Trends indicator tracks the market trend, ignoring sharp market fluctuations and noise around the average price. The indicator is based on price divergence. Also, only moving averages and a special algorithm are used for work. It will help in finding entry points in the analysis and shows favorable moments for entering the market with arrows. Can be used as a fi
Indicator without redrawing Divergent MAX The DivirgentMAX indicator is a modification based on the MACD. The tool detects divergence based on OsMA and sends signals to buy or sell (buy|sell), taking into account the type of discrepancies detected. Important!!!! In the DivirgentMAX indicator, the optimal entry points are drawn using arrows in the indicator's basement. Divergence is also displayed graphically. In this modification of the MACD, the lag problem characteristic of its predecessor i
F ully automated Expert Advisor using the  advanced   algorithm for trading the EURUSD Designed for profit in a short period of time and big profit in a long run. Prefers EURUSD 1H. Principle of operation The SELL and BUY orders are opened (depending on the parameters set), guided by signals and the market situation.     Recommended parameter: Use an ECN broker account. minimum deposit of 100$ USD. use it in H1 time frame recommended symbol is EURUSD input parameter: TrendType                 
What are Fibonacci Numbers and Lines? Fibonacci numbers are used to create technical indicators using a mathematical sequence developed by the Italian mathematician, commonly referred to as "Fibonacci," in the 13th century. The sequence of numbers, starting with zero and one, is created by adding the previous two numbers. For example, the early part of the sequence is 0, 1, 1, 2, 3, 5, 8, 13, 21, 34, 55, 89,144, 233, 377, and so on. The Fibonacci sequence is significant because of the so-calle
Towers
Yvan Musatov
Towers - Trend indicator, shows signals, can be used with optimal risk ratio. It uses reliable algorithms in its calculations. Shows favorable moments for entering the market with arrows, that is, using the indicator is quite simple. It combines several filters to display market entry arrows on the chart. Given this circumstance, a speculator can study the history of the instrument's signals and evaluate its effectiveness. As you can see, trading with such an indicator is easy. I waited for an a
DMS Fibo
Diogo Mitsunaga Dos Santos
Fibonacci retracements are trend lines drawn between two significant points, usually between absolute lows and absolute highs, plotted on a chart. Intersecting horizontal lines are placed at the Fibonacci levels. Fibonacci retracements are useful tools that help traders identify support and resistance levels. With the information gathered, they can place orders, identify stop-loss levels, and set price targets. Although useful, traders often use other indicators to make more accurate assessments
PipFinite Trend PRO
Karlo Wilson Vendiola
4.88 (2247)
Breakthrough Solution For Trend Trading And Filtering With All Important Features Built Inside One Tool! Trend PRO's smart algorithm detects the trend, filters out market noise and gives entry signals with exit levels. The new features with enhanced rules for statistical calculation improved the overall performance of this indicator. Important Information Revealed Maximize the potential of Trend Pro, please visit www.mql5.com/en/blogs/post/713938 The Powerful Expert Advisor Version Automatin
PipFinite Exit EDGE
Karlo Wilson Vendiola
4.83 (115)
Did You Have A Profitable Trade But Suddenly Reversed? In a solid strategy, exiting a trade is equally important as entering. Exit EDGE helps maximize your current trade profit and avoid turning winning trades to losers. Never Miss An Exit Signal Again Monitor all pairs and timeframes in just 1 chart www.mql5.com/en/blogs/post/726558 How To Trade You can close your open trades as soon as you receive a signal Close your Buy orders if you receive an Exit Buy Signal. Close your Sell orders if
Prophet
Andriy Sydoruk
Prophet is a trend indicator. Shows the direction of turning points. Can be used with an optimal risk-to-profit ratio. The arrows indicate favorable moments and directions for entering the market. Uses one parameter for setting (adjust from 1 to 3). The probability of a successful trend is very high. In the course of work, the take-profit is much larger than the stop-loss! Works on all currency pairs and on all timeframes.
Future Price Markets is an indicator that, through the dynamic analysis of price and time, projects profit taking prices in the future. To show the future projections of the price, it uses certain horizontal lines, of different color and style, whether it be a signal to indicate a purchase signal or a sale signal or a future signal to take purchase or sale benefits.
The trend is your friend! This is what this indicator is all about. Follow this famous saying and be safe. Characteristics: Buy/Sell signals fixed on the close of a bar. Works on all symbols and all timeframes. Clear visual market trend laser line, Buy/Sell signal arrows, market strength meter, TP1 & TP2 boxes. Visual signals when to enter, when to exit the market. No repainting. Compatible with Flexible EA for trading automation. (Ask for a free set file optimized to perform 2010-2018) Parame
Before enabling the automatic functions, please note that your EAs must include a small MQL code addition to communicate with the scheduler. I will guide you through the exact steps. If you are using EAs from other developers and you do not have access to their source code, you cannot add this integration. In that case, the scheduler can only be used in manual mode. Overview Alpha Trading Scheduler is an MT4 tool that helps control when automated trading is allowed inside one terminal. It does
Crypto_Forex Göstergesi MT4 için Konsolidasyon Çubuğu Deseni. - Gösterge "Konsolidasyon Çubuğu" Fiyat Hareketi ticareti için çok güçlü bir kopuş odaklı göstergedir. - Gösterge 1 çubuk boyunca dar bir alanda fiyat konsolidasyonunu algılar ve şunları gösterir: Kopuş yönü, Bekleyen emir konumu ve SL konumu. - Boğa Konsolidasyon Çubuğu - Grafikte mavi ok sinyali (resimlere bakın). - Ayı Konsolidasyon Çubuğu - Grafikte kırmızı ok sinyali (resimlere bakın). - Yeniden boyama yok; Gecikme yok; Yüksek
Before
Nadiya Mirosh
The Before indicator predicts the most likely short-term price movement based on complex mathematical calculations. Most of the standard indicators commonly used in trading strategies are based on fairly simple calculations. This does not mean that there were no outstanding mathematicians in the world at the time of their creation. It is just that computers did not yet exist in those days, or their power was not enough for the sequential implementation of complex mathematical operations. Nowad
Magic Balance
Daniil Evstratenko
The indicator shows which trading pairs, strategies, robots and signals that you use are profitable and which are not. The statistic of trades and balance graph are displayed in the account currency and pips - to switch simply click on the graph. button "$"(top left) - minimize/expand and move the indicator panel button ">"(bottom right) - stretching and resetting to the original size Statistic of trades 1 line - account balance, current profit and lot of open trades; 2 line - the number of all
Özel Mum En iyi Forex göstergelerinden birini başarılı bir Ichimoku stratejisi ile kullanmak ister misiniz? Ichimoku stratejisine dayanan bu Harika Göstergeyi kullanabilirsiniz. MT5 versiyonu burada bulunabilir . İlk strateji: Bu strateji, nadiren meydana gelen benzer güçlü kesişmelerin belirlenmesini içerir. Bu strateji için en uygun zaman dilimleri 30 dakika (30D) ve 1 saat (H1) dir. 30 dakikalık zaman dilimi için uygun semboller şunları içerir: • CAD/JPY • CHF/JPY • USD/JPY • NZD/JPY • AUD/J
Check My Product Contact me to discover all my services  Supply and demand zones are one of the most basic things a beginner forex trader learns. These zones are so important, price reacts off of them even after years since they first developed. And with the supply and demand zones indicator, a forex trader might not need to worry about drawing all these historical zones one after the other. The supply and demand zone indicator accurately draws the supply and demand zones of a currency pair o
Infinity Trend Pro
Yaroslav Varankin
1 (1)
This is a trend indicator without redrawing Developed instead of the binary options strategy (by the color of the Martingale candlestick) Also works well in forex trading When to open trades (binary options) A signal will appear in the place with a candle signaling the current candle It is recommended to open a deal for one candle of the current timeframe M1 and M5 When a blue dot appears, open a deal up When a red dot appears, open a trade down. How to open trades on Forex. When a signal is rec
Reversal Pattern AI
Stanislav Konin
5 (1)
Reversal Pattern AI is a groundbreaking advancement in indicator development, combining artificial intelligence algorithms, multi-level market analysis, and classical technical analysis methods. It not only detects reversal patterns but also evaluates market inefficiencies, generating highly accurate trading signals.Thanks to its hybrid model, which utilizes price action analysis, volume, volatility, VWAP, and Volume AVG %, the indicator easily adapts to any market conditions. Reversal Pattern A
MT4 için Crypto_Forex Göstergesi "Consolidation Bar Pro" - "Consolidation Bar Pro" göstergesi, Fiyat Hareketi işlemleri için çok güçlü bir kırılma odaklı göstergedir. - Gösterge, 1 bar boyunca dar bir alanda fiyat konsolidasyonunu tespit eder ve şunları gösterir: Kırılma yönü, Bekleyen emir konumu ve SL konumu. - Boğa Konsolidasyon Çubuğu - Grafikte mavi ok sinyali (resimlere bakın). - Ayı Konsolidasyon Çubuğu - Grafikte kırmızı ok sinyali (resimlere bakın). - Yeniden boyama yok, gecikme yok.
Alpha Trend sign has been a very popular trading tool in our company for a long time. It can verify our trading system and clearly indicate trading signals, and the signals will not drift. Main functions: Based on the market display of active areas, indicators can be used to intuitively determine whether the current market trend belongs to a trend market or a volatile market. And enter the market according to the indicator arrows, with green arrows indicating buy and red arrows indicating se
QuantumEdge Trader
Hossam Ali Ahmed Ali
QuantumEdge Trader v1.0 AI-Powered Precision Signals for Serious Traders QuantumEdge Trader is a smart and reliable indicator that delivers accurate BUY and SELL signals using advanced market analysis and trend detection. Designed for M1 to M60 timeframes, it's ideal for scalping and intraday strategies. --- Key Features: No Repaint – Signals never change after appearing Smart trend filters to reduce noise Adjustable sensitivity and alerts Perfect for XAUUSD, EURUSD, and m
THIS IS A NEW PRODUCT RELEASE -  RENT FOR 1 MONTH FOR JUST $49.99: OFFER EXTENDS UNTIL THE END OF JANUARY 2026.   STRATEGY TESTER HAS LIMITED FUNCTIONS AND DOES NOT BEHAVE EXACTLY AS THE INDICATOR WOULD ON A DEMO. Transform Your Trading with Advanced Multi-Timeframe MACD Analysis The Continuation and Reversal Indicator is a sophisticated technical analysis tool that revolutionizes how you interpret MACD signals by analyzing multiple timeframes simultaneously. This professional-grade indicator p
Indicator Description GOLD TITAN KING SIGNAL INDICATOR High-Precision Gold Scalping Buy/Sell Signals – Manual Trading Assistant Overview The Gold Titan King Signal Indicator is a manual trading assistant tool designed for high-frequency scalping on Gold (XAUUSD) and other major pairs. It generates clear BUY/SELL signals with precise entry levels, along with adjustable Stop Loss and Take Profit levels displayed directly on the chart. ️ This tool is NOT an EA. It does not execute trades
Bu ürünün alıcıları ayrıca şunları da satın alıyor
Miraculous Göstergesi – Gann Dokuz Kareye Dayalı %100 Tekrarlamayan Forex ve İkili Araç Bu video, Forex ve İkili Opsiyon traderları için özel olarak geliştirilmiş son derece doğru ve güçlü bir ticaret aracı olan Miraculous Göstergesi 'ni tanıtıyor. Bu göstergeyi benzersiz kılan, efsanevi Gann Dokuz Karesi ve Gann Titreşim Yasası 'na dayanmasıdır; bu da onu modern ticarette mevcut en hassas tahmin araçlarından biri yapmaktadır. Miraculous Göstergesi tamamen tekrarlamaz ; yani mum kapandıktan son
F-16 Uçak Göstergesini tanıtıyoruz, ticaret deneyiminizi devrimleştirmek için tasarlanmış son teknoloji bir MT4 aracı. F-16 savaş uçağının eşsiz hızı ve hassasiyetinden ilham alan bu gösterge, finansal piyasalarda eşi benzeri olmayan performans sunmak için ileri algoritmalar ve son teknoloji teknolojileri bir araya getirir. F-16 Uçak Göstergesi ile gerçek zamanlı analiz sunarak yüksek doğruluklu ticaret sinyalleri üretirken rekabetin üzerine çıkacaksınız. Dinamik özellikleri, farklı varlık sınıf
Meravith
Ivan Stefanov
5 (1)
Gösterge, her noktadan hacmi analiz eder ve bu hacim için piyasa tükenme seviyelerini hesaplar. Üç çizgiden oluşur: Boğa hacmi tükenme çizgisi Ayı hacmi tükenme çizgisi Piyasa trendini gösteren bir çizgi. Bu çizgi, piyasanın boğa mı yoksa ayı mı olduğunu yansıtacak şekilde rengini değiştirir. Piyasayı istediğiniz herhangi bir başlangıç noktasından analiz edebilirsiniz. Bir hacim tükenme çizgisine ulaşıldığında, bir sonraki analize başlamak için yeni bir nokta belirleyin. Herhangi bir şeyi analiz
" Dynamic Scalper System " göstergesi, trend dalgaları içinde işlem yapmak için scalping yöntemi için tasarlanmıştır. Başlıca döviz çiftleri ve altın üzerinde test edilmiştir, diğer işlem araçlarıyla uyumluluğu mümkündür. Ek fiyat hareketi desteğiyle trend boyunca pozisyonların kısa vadeli açılması için sinyaller sağlar. Göstergenin prensibi. Büyük oklar trend yönünü belirler. Küçük oklar şeklinde scalping için sinyaller üreten bir algoritma trend dalgaları içinde çalışır. Kırmızı oklar yüksel
BinaryIndicator is a highly accurate indicator for trading binary options. It shows excellent results in scalping. This indicator is based in multifactor analysis of trend indicators, as well as confirmation oscillators, which in the end gives an increased accuracy of signals. Advantages of the indicator Increased accuracy of signals. Excellent results when trading binary options with a short expiration time from M30 to M1 . It works on any timeframes. Works with any trade symbols. Parameters
The Nihilist 5.0 Indicator includes Forexalien and Nihilist Easy Trend trading strategies and systems. It is composed of an MTF Dashboard where you can analyze the different input possibilities of each strategy at a glance. It has an alert system with different types of configurable filters. You can also configure which TF you want to be notified on your Metatrader 4 platform and Mobile application The indicator has the option to view how could be a TP and SL by using ATR or fixed points, even w
Gold Channel is a volatility-based indicator, developed with a specific timing algorithm for the XAUUSD pair, which consists of finding possible corrections in the market. This indicator shows two outer lines, an inner line (retracement line) and an arrow sign, where the theory of the channel is to help identify overbought and oversold conditions in the market. The market price will generally fall between the boundaries of the channel. If prices touch or move outside the channel it is a tradi
Everyone who purchases the Scalping signals M1 indicator receives a FREE BONUS — a fully automated Expert Advisor that trades based on the indicator’s signals. The indicator shows the arrows — the robot can execute the trades for you, following all signals and risk-management rules. Scalping signals M1 – a ready-made trend-following entry system for M1 Scalping signals M1 is an indicator that turns your chart into a clear action map: a colored trend channel shows the direction of the market, and
Delta Swing Pro - Multi-Timeframe Trend Consensus System for MT4 Concept: Capturing the Moment of Perfect Alignment The greatest adversary in trading is the "contradiction" between different timeframes. It is common to find a 5-minute chart showing a bullish trend while the 1-hour chart remains bearish. This conflict creates market noise that leads many traders into unprofitable traps. Delta Swing Pro is engineered to synchronize these varying timeframe vectors. It identifies the rare moments
OrderFlow Absorption – MT4 için Profesyonel Delta ve Absorpsiyon Sinyal Göstergesi OrderFlow Absorption ile gerçek emir akışı analizinin gücünü keşfedin – MetaTrader 4 için nihai delta histogramı ve absorpsiyon sinyal göstergesi. Fiyat hareketlerinin arkasında gerçekte neler olduğunu görmek isteyen traderlar için tasarlanan bu araç, piyasayı hareket ettiren gizli alım/satım baskısını ve absorpsiyon olaylarını ortaya çıkarır. Özellikler Delta Histogramı Görselleştirme:   Alım ve satım baskısını a
Algo Trading Indicaor  With this indicator , you’ll have zones and trends that hight probability the price will reverse from it. so will gives you all the help that you need  Why should you join us !?  1-This indicator is logical since it’s working in previous days movement , to predict the future movements. 2-Algo trading indicator will help you to draw trends which is special and are too strong than the basics trend , trends will change with the frame time that you work on . 3-We can use
"Dragon's Tail" is an integrated trading system, not just an indicator. This system analyzes each candle on a minute-by-minute basis, which is particularly effective in high market volatility conditions. The "Dragon's Tail" system identifies key market moments referred to as "bull and bear battles". Based on these "battles", the system gives trade direction recommendations. In the case of an arrow appearing on the chart, this signals the possibility of opening two trades in the indicated directi
The Hurricane Indicator
Paul Nicholas Clevett
5 (1)
Currently switched to the 4 hour chart - but use other time frames for confirmation. :-)  I change my main time frame based on the market movement at the time. The Hurricane Forex Indicator is a multi time frame indicator that includes such things as Trade Notifications, Trade Calculator, Momentum Indicator, risk reward and much more. We have a free Trade room for our users as well. Please check out the video for full details of how this indicator works as it has over 15 years worth of developme
ECM Elite Channel is a volatility-based indicator, developed with a specific time algorithm, which consists of finding possible corrections in the market. This indicator shows two outer lines, an inner line (retracement line) and an arrow sign, where the channel theory is to help identify overbought and oversold conditions in the market. The market price will generally fall between the boundaries of the channel. If prices touch or move outside the channel, it's a trading opportunity. The ind
This indicator is a multifunctional technical analysis tool based on the combination of an adaptive exponential moving average and volatility filters calculated through the Average True Range (ATR). It is designed to accurately identify the current price direction, highlight key trend reversal areas, and visualize potential turning zones. The algorithm is built upon the dynamic construction of a trend ribbon using two levels of volatility — outer and inner ranges. The outer boundaries serve as i
Rtc ML Ai | Predictor CORE MACHINE LEARNING ENGINE Adaptive ML Market Predictor – Multi-Bar Trend & Candle Forecast What This Indicator Does This indicator is a  real-time market prediction engine  designed to analyze price behavior and estimate  future market tendencies . Unlike conventional indicators, this system  does not rely on static parameters or historical curve-fitting , but adapts its internal state dynamically during live market operation. Instead of using static rules, the indic
FFx Engulfing Setup Alerter gives trade suggestions with Entry, Target 1, Target 2 and StopLoss. Below are the different options available: Entry suggestion - pips to be added over the break for the entry 3 different options to calculate the SL - by pips, by ATR multiplier or at the pattern High/Low 3 different options to calculate the 2 TPs - by pips, by ATR multiplier or at Risk/Reward Offset the dashboard - any place on the chart Remove the suggestion once the price reached the SL line Lines
FFx InsideBar Setup Alerter gives trade suggestions with Entry, Target 1, Target 2 and StopLoss. Below are the different options available: Entry suggestion - pips to be added over the break for the entry Minimum candle size - to avoid too close buy/sell entry suggestions 3 different options to calculate the SL - by pips, by ATR multiplier or at the pattern High/Low 3 different options to calculate the 2 TPs - by pips, by ATR multiplier or at Risk/Reward Offset the dashboard - any place on the c
FFx OutsideBar Setup Alerter gives trade suggestions with Entry, Target 1, Target 2 and StopLoss. Below are the different options available: Entry suggestion - pips to be added over the break for the entry. 3 different options to calculate the SL - by pips, by ATR multiplier or at the pattern High/Low. 3 different options to calculate the 2 TPs - by pips, by ATR multiplier or at Risk/Reward. Offset the dashboard - any place on the chart. Remove the suggestion once the price reached the SL line.
FFx PinBar Setup Alerter gives trade suggestions with Entry, Target 1, Target 2 and StopLoss. Below are the different options available: Entry suggestion - pips to be added over the break for the entry Minimum candle size - to avoid too small candles 3 different options to calculate the SL - by pips, by ATR multiplier or at the pattern High/Low 3 different options to calculate the 2 TPs - by pips, by ATR multiplier or at Risk/Reward Offset the dashboard - any place on the chart Remove the sugges
Automatic, live & interactive picture of all trendlines. Assign push, email and sound alerts to the lines of your choice and be informed about price rollback, breakout, rollback after breakout, number of rollbacks, line expiration by double breakout. Correct, drag or delete the lines and interactively tune the line system. https://youtu.be/EJUo9pYiHFA . Chart examples https: //www.mql5.com/en/users/efficientforex Price Interaction Events All events are effective immediately and only after one
Adaptive Stochastic
Rasoul Mojtahedzadeh
Stochastic Oscillator is one of the most popular and accurate oscillators widely used by traders to capture overbought and oversold areas of price action. Although the Stochastic indicator works fine for an interval of the market, it fails to generate profitable signals when the market conditions change, and hence it produces wrong signals resulting in big losses. Have you ever thought about an adaptive Stochastic indicator that adapts its period of calculation based on the market conditions? Th
The purpose of this new version of the MT4 standard indicator provided in your platform is to display in a sub-window multiple timeframes of the same indicator with its divergences. See the example shown in the picture below. But the display isn't like a simple MTF indicator. This is the real display of the indicator on its timeframe. Here's the options available in the FFx divergences indicator: Select the timeframes to be displayed (M1 to Monthly) Define the width (number of bars) for each tim
The purpose of this new version of the MT4 standard indicator provided in your platform is to display in a sub-window multiple timeframes of the same indicator with its divergences. See the example shown in the picture below. But the display isn't like a simple MTF indicator. This is the real display of the indicator on its timeframe. Here's the options available in the FFx divergences indicator: Select the timeframes to be displayed (M1 to Monthly). Define the width (number of bars) for each ti
The FFx Dashboard MTF alerter will show you on a single chart all the timeframes (M1 to Monthly) with their own status for the indicator. 2 Alert Options: Single timeframe: each selected timeframe alert separately when a signal occurs Multi timeframes: all selected timeframes must agree for an alert to be triggered Both options have an input to select the timeframes to be used for the alert(s). How to Understand the Status: Green/Red square: histogram above/below 0 line Green square + Red bord
The FFx Dashboard MTF alerter will show you on a single chart all the timeframes (M1 to Monthly) with their own status for the indicator. 2 Alert Options: Single timeframe: each selected timeframe alert separately when a signal occurs Multi timeframes: all selected timeframes must agree for an alert to be triggered Both options have an input to select the timeframes to be used for the alert(s). How to understand the status: Green/Red square: RSI above/below 50 line Green square + Red border: R
The FFx Dashboard MTF alerter will show you on a single chart all the timeframes (M1 to Monthly) with their own status for the indicator. 2 Alert Options: Single timeframe: each selected timeframe alert separately when a signal occurs Multi timeframes: all selected timeframes must agree for an alert to be triggered Both options have an input to select the timeframes to be used for the alert(s). How to understand the status: Green/Red square: Stoch above/below 50 line Green square + Red border:
Yazarın diğer ürünleri
Description The indicator uses market profile theory to show the most relevant trading zones, on a daily basis. The zones to be shown are LVN (low volume nodes) and POC (point of control). An LVN zone is one which represents price areas with the least time or volume throughout the day. Typically, these areas indicate a supply or demand initiative, and in the future, they can turn into important breakout or retracement zones. A POC zone is one which represents price areas with the most time or vo
Clever Smart
Carlos Forero
4.76 (17)
Description Helps you detect the structure of the market, using different types of Smart Money concepts. This should help you to upgrade your trading strategy in every way. MT5 Version Here Smart Money Features: Color candle to signal the type of structure Shows CHOCH and BOS Equal Lows and Highs Order Blocks Internal and Swings Weak and strongs high and lows Fair Value Gaps High and Lows in daily weekly and monthly timeframes Premium and discount Zones KEY LINKS:   How to Install   –  Frequent
FREE
Description: The indicator measures, through the zigzag indicator, the levels of trend or correction. It shows in the chart the levels of each low or high detected. KEY LINKS:   How to Install  –  Frequent Questions  -  All Products  How is this indicator useful? This indicator determines, depending on Zigzag parameter if a trend is beginning, developing, or ending This indicator determines the direction of the trend Components Levels as positive or negative numbers, depending on the direction
FREE
Description: The indicator shows the TDI indicator in a separate window, and with the RSI component, the indicator finds possible divergences with M or W patterns. KEY LINKS:   How to Install  -   Frequent Questions  -  All Products  Functions: Finds Market Makers patterns. Finds extremes or exhaustion into the market. Looks for a trend continuation. Content: TDI Indicator Divergence and M or W Signals Note 1:  This indicator should only be considered as a part of any trading strategy. You shoul
Description: Indicator which uses trend, breakout and reversal innovative indicators to show a complete visual trading strategy, with transparent metrics. It follows simple visual patterns, which will improve your trading significantly. Support:   We create great tools for the entire trading community. Most of them are free. If you believe in what we do  Support Us Here.   KEY LINKS:   Indicator Manual  –   How to Install  –  Frequent Questions  -  All Products  Outstanding Features Shows cur
Description: The indicator predicts, with a specific probability, if the actual candlestick range will expand or contract compared to the range of a previous candle. Furthermore, the indicator shows the possible high or low of the actual candle, based on trend direction. (Recommended for Daily, Weekly, or Monthly timeframes). KEY LINKS:   Indicator Manual  –  How to Install  –  Frequent Questions  -  All Products  How to use the indicator: Determines, with a certain probability, if there will b
Description The indicator measures a currency’s relative strength, on different timeframes, through certain percentile spread analysis. This allows you to compare which are the strongest currency pairs, against the weakest pairs. These spreads are based on comparison against USD. KEY LINKS:  Indicator Manual  –  How to Install  –  Frequent Questions  -  All Products  How is "Clever Spread Currencies Strength" useful to you? This indicator determines a currency’s strength for different timeframe
Description Complete breaker market maker Key zones indicator, It provides precise zones where could be an excellent break or reversal opportunity. KEY LINKS:   How to Install  -  Frequent Questions  -  All Products  How is this indicator useful? It will allow you to trade retracement or breakout patterns, every time they occur in a given zone. NEVER repaints. It signals clear possible money management levels as stop and take profit. You’ll be able to identify potential resistance or support lev
Description Candle Power Color indicator which shows when the market is trending and when it is in a sideway movement KEY LINKS:   How to Install  –  Frequent Questions  -  All Product How is this indicator useful? It allow to detect trend and sideway movements in market NEVER repaints. It adapts to any market and asset. It can support any other trading strategy. Note 1:  This indicator should only be considered as a part of any trading strategy. You should complement this with other filters (e.
Clever MACD
Carlos Forero
5 (1)
Description Better version of MACD indicator which offer a complete visual trading strategy and realize an auto-optimization KEY LINKS:  How to Install  –  Frequent Questions  -  All Products  How is this indicator useful? NEVER repaints. Detect best parameters of MACD indicator, based on profit factor during the specified period. This indicator can be used as a visual strategy, following the recommendations of entry, stop, and targets. Indicator features It can be used as a complete trading st
Description Better version of RSI indicator which offer a complete visual trading strategy and realize an auto-optimization Support:   We create great tools for the entire trading community. Most of them are free. If you believe in what we do  Support Us Here.   KEY LINKS:   How to Install  –  Frequent Questions  -  All Products  How is this indicator useful? NEVER repaints. Detect best parameters of RSI indicator, based on profit factor during the specified period. This indicator can be used as
EA that detects reversion patterns to enter the market at the best possible conditions. It uses a reentry system with a establish stop, and risk control system. Timeframe: H1 Recommeded Pairs: EURUSD, GBPUSD Recommended Min Account Size: 10.000 USD Signal:    Very Low Risk Features: Automatic reinvestment of earned profits for further trading; The advisor increases the volume of transactions according to the size of the deposit, including taking into account the earned profit, which makes it pos
This EA trades with a breakout strategy, it try to detect the best levels to trade and its designed to trade the GBPUSD and EURUSD Signal EAs:   https://www.mql5.com/es/signals/1726841 Assets: GBPUSD, EURUSD TimeFrame: H1 Features: Automatic reinvestment of earned profits for further trading; The advisor increases the volume of transactions according to the size of the deposit, including taking into account the earned profit, which makes it possible to achieve compound interest; Fully automated;
Description Very robust and powerful indicator, which allows through its 4 components, trade the market in trend or not trending conditions. it based on a very reliable trading strategy and gives you all you need to be succesful in trading. KEY LINKS:   Indicator Manual  –  How to Install   –  Frequent Questions  -  All Products  How is Clever Scalper Pro useful to you? A complete and reliable trading strategy. Easy to understand and trade Allow to identify trend, confirm it, look for retraceme
Description Very precise patterns to detect: entry signals as well as breakout, support and resistance reversal patterns. It points out zones in which, with a high probability, institutional orders with the potential to change the price’s direction and keep moving towards it, have been placed. Support:   We create great tools for the entire trading community. Most of them are free. If you believe in what we do  Support Us Here.   KEY LINKS:   Indicator Manual  -  All Products  How is this indi
Description: The indicator shows the TDI indicator in a separate window, and with the RSI component, the indicator finds possible divergences with M or W patterns. KEY LINKS:   How to Install  –  Frequent Questions  -  All Products  Functions: Finds Market Makers patterns. Finds extremes or exhaustion into the market. Looks for a trend continuation. Content: TDI Indicator Divergence and M or W Signals Note 1:  This indicator should only be considered as a part of any trading strategy. You shoul
KEY LINKS:  Indicator Manual  –  How to Install  –  Frequent Questions  -  All Products  Description: Indicator which uses trend, breakout and reversal innovative indicators to show a complete visual trading strategy, with transparent metrics. It follows simple visual patterns, which will improve your trading significantly. Support:   We create great tools for the entire trading community. Most of them are free. If you believe in what we do  Support Us Here. Outstanding Features Shows current
The indicator is based on a proven successful strategy. It shows buys and sello signals with suggested stop and target. In the same way, it calculates the essential trading analysis statistics as successful and profit ratio. KEY LINKS:  Indicator Manual  –  How to Install  -  Frequent Questions  -  All Products  Indicator features Effective and understandable signals. It can be used as a complete trading strategy. Complete trading statistics to evaluate the indicator performance. It shows exact
Description Price action patterns detection that can work as triggers in any trading strategy, It include Flag, Flag Top, Flag 1234, and micro pullback patterns Support:   We create great tools for the entire trading community. Most of them are free. If you believe in what we do  Support Us Here.   How is this indicator useful?  You can use the indicator signals as a trigger to entry in the market and complement any trading strategy. Components Note 1:  This indicator should only be considered a
Description Helps you detect the structure of the market, using different types of Smart Money concepts. This should help you to upgrade your trading strategy in every way. Smart Money Features: Color candle to signal the type of structure Shows CHOCH and BOS Equal Lows and Highs Order Blocks Internal and Swings Weak and strongs high and lows Fair Value Gaps High and Lows in daily weekly and monthly timeframes Premium and discount Zones KEY LINKS:   How to Install   –  Frequent Questions  -  All
Filtrele:
turky7713
466
turky7713 2021.03.20 11:18 
 

I was renting for three months, but I notice very few buy and sell signals This can be modified

Aravind Kolanupaka
9839
Aravind Kolanupaka 2019.06.16 00:12 
 

Good. Do not trade arrow to arrow as signals, use it along with your strategy.

İncelemeye yanıt