Mood
- Indikatoren
- Version: 1.1
- Aktualisiert: 8 April 2020
- Aktivierungen: 10

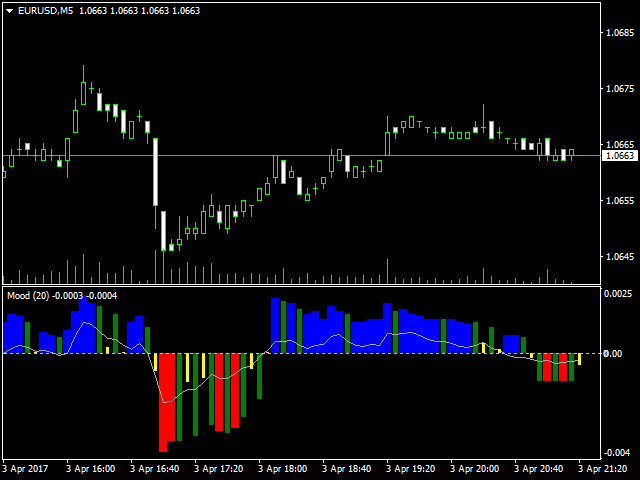
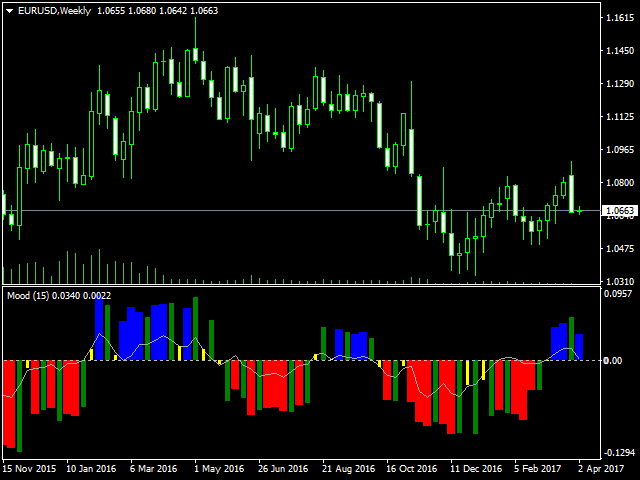
Dieser Indikator ist für den Trendhandel konzipiert und hilft bei der Bestimmung der besten Einstiegspunkte. Um die Punkte zu identifizieren, ist es notwendig, der Signallinie zu folgen. Sobald die Linie die Nulllinie nach oben kreuzt - kaufen, und wenn sie nach unten kreuzt - verkaufen. Neben der Signallinie zeigt der Indikator auch die so genannte "Stimmung" des Marktes in Echtzeit in Form eines Histogramms an. Der Indikator funktioniert auf allen Zeitskalen und mit allen Instrumenten. Die Funktion des Indikators setzt voraus, dass der Indikator Gleitender Durchschnitt im Terminal verfügbar ist. Der Indikator ist sehr einfach zu bedienen, folgen Sie einfach der Signallinie. Die Histogramme dienen zur Bestätigung des Trends. Die blaue Farbe des Histogramms bedeutet die Bildung eines Aufwärtstrends, rot - Abwärtstrend. Das gelbe Histogramm zeigt alle Arten der weiteren Entwicklung des Preises an, nämlich die Unsicherheit. Wenn das grüne Histogramm einen positiven Wert hat, wird gerade eine Korrelation des Aufwärtstrends gebildet. Und wenn das grüne Histogramm einen negativen Wert hat - eine Korrelation des Abwärtstrends. Um den Trend und die Korrelationen zu bestimmen, verwendet der Indikator die Candlestick-Analyse, die Hochs und Tiefs für den ausgewählten Zeitraum und einen eigenen Algorithmus, der wahrscheinliche Umkehrungen identifiziert. Die Berechnungen beginnen mit dem historischen Hoch oder Tief im aktuellen Zeitrahmen, und das Histogramm zeigt die Unsicherheitsbereiche davor an. Dies macht den Indikator effizienter und erleichtert das Filtern von kurzfristigen Signalen.
Merkmale
- Minimierung der falschen und kurzfristigen Signale
- Keine Verzögerung
- Wird nicht neu gezeichnet (nach Schließen der Kerze)
- Funktioniert in Echtzeit
- Einfach zu bedienen
Eingabe Parameter
- Periode - Periode, die Anzahl der Balken/Kerzen für die Berechnung des Indikators (mindestens 2)