Candle patterns scanner with trend filter MT5

5

이 다중 시간 프레임 및 다중 기호 표시기는 핀 막대, 아침/저녁 별, 인글핑, 핀셋, 쓰리 라인 스트라이크, 내부 막대 및 페넌트 및 삼각형을 스캔합니다. 지표는 단일 차트 모드에서도 사용할 수 있습니다. 이 옵션에 대한 자세한 내용은 제품의   블로그 .   고유한 규칙 및 기술과 결합하여 이 표시기를 사용하면 자신만의 강력한 시스템을 생성(또는 강화)할 수 있습니다.

특징

  • Market Watch 창에 표시되는 모든 기호를 동시에 모니터링할 수 있습니다. 하나의 차트에만 지표를 적용하고 전체 시장을 즉시 모니터링하십시오.
  • M1에서 MN까지 모든 시간대를 모니터링하고 패턴이 식별되면 실시간 경고(팝업, 푸시 또는 메일)를 보냅니다.
  • RSI 및 볼린저 밴드를 핀 바, 아침/저녁 별 , 인글프잉 및 핀셋 형성 에 대한 필터로 사용하여 잠재적 반전을 적절하게 식별할 수 있습니다.
  • 이동 평균을 주요 추세 필터로 사용하고 ADX를 변동성 필터로 사용할 수 있습니다.
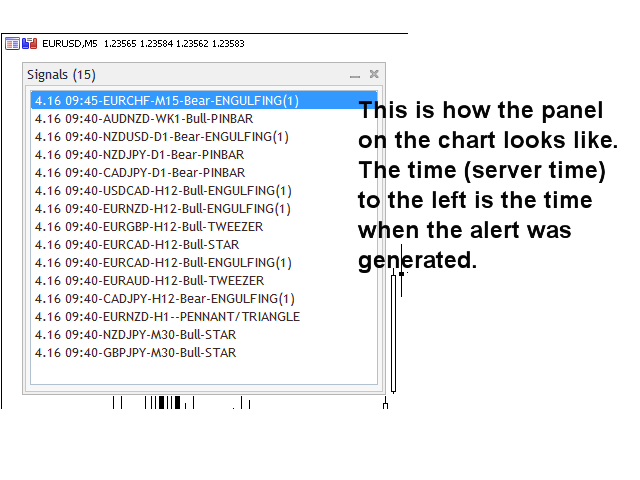
  • 표시기는 대화형 패널을 포함합니다. 항목을 클릭하면 해당 기호와 기간이 포함된 새 차트가 열립니다.
  • 표시기는 자동 거래를 위해 Expert Advisor가 사용할 수 있는 파일에 신호를 쓸 수 있습니다. 예를 들어 이 제품 .

Pennant 및 Triangles 스캐닝은 가능성이 높은 브레이크아웃 패턴을 식별합니다. 강력하고 대칭적인 페넌트와 삼각형을 식별하여 이를 수행합니다. 이 패턴은 더 높은 시간 프레임에서 자주 나타나지 않습니다. 그러나 그렇게 하면 매우 높은 확률의 설정입니다. 봐주세요   여기에 스크린샷이 있습니다 .

입력 매개변수

여기 에서 입력 매개변수에 대한 설명과 설명을 찾으십시오.

중요한

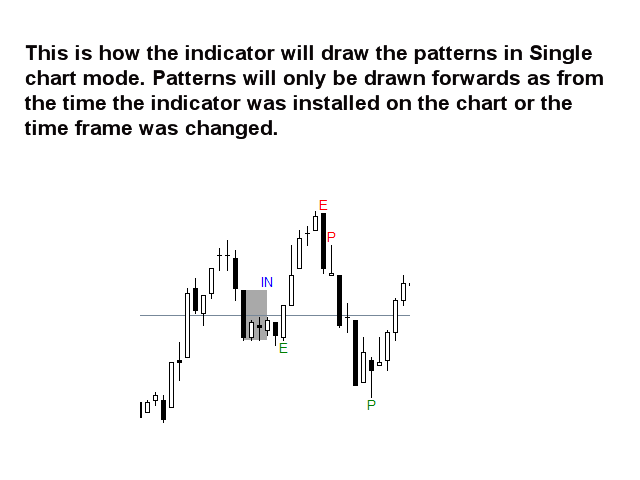
다기능으로 인해 매수 및 매도 조언이나 선과 화살표가 표시기가 설치된 차트에 그려지지 않는다는 점에 유의하십시오. 내부 막대와 Pennant 및 Triangles 형태를 가리키는 선과 다른 양초 패턴에 대한 화살표는 차트 패널에서 신호를 클릭할 때 열리는 차트에 그려집니다.

스캐너를 방해할 수 있는 다른 지표나 Expert Advisors가 없는 깨끗한(빈) 차트에 지표를 두는 것이 좋습니다.


리뷰 6
tunck
1204
tunck 2023.04.08 02:44 
 

SL/TP for patterns?

Kayhan
62
Kayhan 2021.09.07 16:25 
 

I was looking forward to seeing this kind of indicator. Thank you very much.

smmfx
80
smmfx 2020.11.05 16:07 
 

An amazing indicator that gives me very accurate signals based on my strategy. I thank Jan for answering my challenging questions before I buy it. The coding and details that saw looks very professional.

추천 제품
I recommend you to read the   product's blog  (manual) from start to end so that it is clear from the beginning what the indicactor offers. This multi time frame and multi symbol divergence dashboard indicator sends an alert when one or two different divergences have been identified. It can be used with all time frames from M1 to MN. Maximum 9 time frames can be shown in the dashboard at the same time. It is possible to enable moving average, RSI or Bollinger bands trend filter to filter out on
TradeManagerRR Visualizer MT5 는 거래자들이 차트에서 쉽게 이익 실현(TP) 및 손절매(SL) 수준을 시각화할 수 있도록 설계된 거래 관리 도구입니다. 이 초기 버전은 SL 및 TP 영역과 진입 가격을 표시하는 간단한 그래픽 표현을 제공합니다. 현재 버전은 SL 및 TP 영역의 그래픽 표시만을 다루고 있습니다. 현재 버전의 기능: SL 및 TP 영역 표시:   조정 가능한 색상으로 손절매 및 이익 실현 수준을 명확하게 시각화합니다. 이동 가능한 진입 가격:   차트에서 진입 가격을 이동시켜 SL 및 TP 수준의 반응을 확인할 수 있습니다. 위험/보상 비율 계산:   정의된 수준에 기반하여 동적으로 위험/보상 비율을 표시합니다. 사용 방법: 진입 가격 설정:   차트를 클릭하여 진입 가격을 설정합니다. SL 및 TP 수준 조정:   SL 및 TP 영역을 이동시켜 위험 및 보상 수준을 조정합니다. 영역 시각화:   SL 및 TP 영역이 다른 색상으로 표시되어 시각
Market Structure Order Block Dashboard MT5 Market Structure Order Block Dashboard MT5 는 MetaTrader 5용 인디케이터로, 시장 구조 및 ICT / Smart Money 개념 분석을 자동화합니다. 이 제품은 포지션을 열지 않으며 주문을 관리하지도 않습니다. 즉, 자동매매 로봇이 아니라 시각적 분석 도구 입니다. 인디케이터가 표시하는 내용 인디케이터는 차트를 스캔하여 다음 정보를 강조 표시합니다 : 시장 구조 : 주요 스윙, HH, HL, LH, LL 구조 돌파 : Break of Structure (BOS) 및 Change of Character (ChoCH) 상승(demand) / 하락(supply) Order Blocks, 강도 표시 포함 유효한 Fair Value Gaps (FVG) 유동성 구간(equal highs / equal lows) 및 스윕(sweeps) 아시아, 런던, 뉴욕 세션 및 Kill
Double Fractal Entry Bot trades automatically using fractal breakouts or rebounds. It detects precise entry points, places SL and TP based on market structure, and includes logic to manage risk and avoid false signals. Simple, smart, and powerful. This product is also available for MetaTrader 4 =>  https://www.mql5.com/en/market/product/143609 Double Fractal Entry Bot is an intelligent trading robot based on the proven logic of the Double Fractal Entry indicator. It analyzes price using upper a
Liquidity Map
Alex Amuyunzu Raymond
Liquidity Map  Overview The Liquidity Map indicator is an advanced visualization tool based on ICT Smart Money Concepts . It automatically identifies daily Buy Zones , Sell Zones , and Liquidity Levels , showing where price is likely to reverse or continue based on institutional order flow. It calculates key levels from the daily session — such as the previous day’s high, low, and midpoint — then derives a premium (sell bias) and discount (buy bias) structure. When price trades into these mapped
UTS Trading Stat
Dawid Aaron Zinserling
The UTS Trading Stat indicator, developed by Ultron Trading Solutions, is a customizable tool designed to track and display trading statistics for the current chart's symbol. It presents a visual dashboard on the chart, offering real-time insights into trading performance with a toggleable panel (STAT SHOW/STAT HIDE) for user convenience. Below is a detailed description of its features and functionality: Trading Statistics Displayed : Current Positions : Number of open profit/loss trades and tot
Trend dashboard MT5
Jan Flodin
5 (1)
I recommend you to read the   product's blog  (manual) from start to end so that it is clear from the beginning what the indicactor offers. This multi time frame and multi symbol trend indicator sends an alert when a strong trend or trend reversal has been identified. It can do so by selecting to build up the dashboard using Moving average (single or double (both MA:s aligned and price above/below both)), RSI, Bollinger bands, ADX, Composite index (Constance M. Brown), Awesome (Bill Williams), 
I recommend you to read the   product's blog  (manual) from start to end so that it is clear from the beginning what the indicactor offers. This multi time frame and multi symbol indicator identifies double or triple top/bottom formations or a following neckline breakout (confirmed top/bottom). It offers RSI, pin bar, engulfing, tweezer, morning/evening star filters as well divergence filter options which makes it possible to filter out only the strongest setups. The indicator can also be used
Utilities
Douglas Lucio De Araujo
Indicator with 3 features - Clock : Clock independent of the chart, counting continues even when the market is closed. - Template : After setting up a configuration in any graphic, be it color patterns, indicators, zoom ... The configuration will be copied to all active graphics. - TimeFrame : Set the TimeFrame on a chart, and with just one click all the active charts will be changed to the same TimeFrame.
Professional VWAP Trading System with Advanced Signal Detection Transform your trading with the most comprehensive VWAP indicator available for MetaTrader 5. Magic VWAP Key Levels Pro combines multiple timeframe analysis, intelligent signal detection, and professional-grade visualization to give you the edge in modern markets. CORE FEATURES: Multi-Timeframe VWAP Analysis Session, Weekly, and Monthly VWAP calculations Previous 10-day VWAP support/resistance Dynamic anchor periods (Session/Week/Mo
Aureon EA
Ivan Pochta
Aureon EA is a fully automated Expert Advisor designed for professional and high-precision trading. The core of the strategy is based on divergence analysis, one of the most accurate and reliable tools in technical analysis.The EA identifies divergences using the following indicators: RSI, Stochastic, CCI, MACD, RVI. Based on a combination of detected signals, the system decides whether to open a position. Additional filters include RSI, Bollinger Bands, and ATR for improved accuracy and market
Smart Market Flow Detector
Victor Paul Hamilton
4 (1)
Smart Market Flow Detector (SMFD) - Professional V1.31 I CAN CONSISTENTLY GRIND MONEY FROM THIS, BE IT SCALPING OR LOWER LOTS ON LONGER TIME FRAMES. IF YOU ARE WILLING TO PUT THE WORK IN, TRADING GIVES BACK IN PROFIT WHAT YOU GIVE IN PATIENCE AND DISCIPLINE. WET DREAM 5000% PROFIT A MONTH GAMBLERS MOVE ALONG — THIS IS NOT FOR YOU. 4 Advanced Algorithms Combined Into One Powerful Indicator The Smart Market Flow Detector (SMFD) is a professional-grade Meta Trader 5 indicator that integrates four d
BluePrint Adaptive Trader - Professional Trading System Advanced Channel Trading System based on our proprietary TrenderFlex PRO algorithm Learn more about TrenderFlex PRO KEY FEATURES • TrenderFlex PRO Channel Technology - Advanced channel calculation based on our proven algorithm • Adaptive Risk Management - Automatic TP/SL calculation based on channel width • Win Rate Statistics - Real-time tracking of TP1, TP2, TP3 success rates • Multi-Timeframe Analysis - Monitor 7 timeframes simultaneou
Bar Sequential
Maximiliano Frisione Figueroa
This indicator can help you clearly identify trend changes in both bullish and bearish markets. The indicator compares the closing price of the last candle with the closing price of the candle "X" periods ago (input parameter). In an uptrend, an initial number '1' is plotted if a candle closes higher than the closing of a candle "X" periods ago. In a downtrend, an initial number '1' is plotted if a candle closes below the closing of a candle "X" periods ago. Subsequent numbers are plotted when e
FREE
Moving pivot Average Fibonacci The  indicator compares the selected period with its counterpart from the previous period. The indicator determines the moving Fibonacci levels for the day or any time interval to assess the price movement range from the time average. The indicator helps predict the expected high or low for the day based on historical time data. The pivot line can be considered an average trend line and use it in a variety of trading strategies. If you have any question about the
Send me a message so I can send you the setfile 다양한 구성이 가능한 견고한 로봇 아래 스크린샷의 설정에 따라 10분 기간으로 BTC를 사용하세요. 전문가 로봇을 구매할 경우, 로봇을 지속적으로 개선하기 위해 수정을 요청할 권리가 있습니다. 주요 특징 이동 평균 교차 전략: EA는 두 개의 이동 평균선(MA1과 MA2)을 사용하여 거래 신호를 생성합니다. 빠른 MA(MA1)가 느린 MA(MA2) 위 또는 아래로 교차하면 거래가 시작됩니다. 마팅게일 전략: 거래에서 손실이 발생하면 다음 거래의 로트 크기가 승수(마팅게일 승수)만큼 증가합니다. 마팅게일 시퀀스는 승리한 거래 후 또는 최대 마팅게일 단계 수(maxMartingale)에 도달하면 재설정됩니다. 위험 관리: 손절매(SL) 및 이익실현(TP) 수준은 구성 가능합니다. 수익을 확보하고 손실을 최소화하기 위해 추적 정지 및 손익분기점 기능이 포함되었습니다. 일일 이익/손
Mega Dashboard
Paul Anscombe
5 (4)
The Ultimate Dashboard New Year Sale - save $20   (normal price $79) Indicators are useful for traders, but when you put them into a dashboard that can scan 28 symbols at once they become even better, and when you can also combine different indicators and timeframes to give you synchronized alerts, then they become awesome. This easy to use dashboard provides you with 32 leading indicators, use them individually or together, to create powerful combination alerts. So when you want to know that RS
한눈에 분석을 강화하세요! 이 인디케이터는 가격이 최근 반등하거나 돌파한 주요 레벨을 자동으로 표시하여, 수동으로 그릴 필요 없이 지원 및 저항 구역을 보여줍니다. 차트에 추가하기만 하면 각 기간의 이전 최고가 및 최저가 라인이 나타납니다. 각 라인의 의미 Previous Month High ‣ 이전 달 최고가: 지난 월간 기간 동안 기록된 최고 가격. Previous Month Low ‣ 이전 달 최저가: 지난 월간 기간 동안 기록된 최저 가격. Previous Week High ‣ 이전 주 최고가: 지난 주간 기간 동안 기록된 최고 가격. Previous Week Low ‣ 이전 주 최저가: 지난 주간 기간 동안 기록된 최저 가격. Previous Day High ‣ 이전 일 최고가: 직전 거래일의 최고 가격. Previous Day Low ‣ 이전 일 최저가: 직전 거래일의 최저 가격. 사용 이유 차트를 열자마자 반등 과 돌파 를 포착. 검증된 구역에서 이익실현 (T
Hydra Trend Rider is a non-repainting, multi-timeframe trend indicator that delivers precise buy/sell signals and real-time alerts for high-probability trade setups. With its color-coded trend line, customizable dashboard, and mobile notifications, it's perfect for traders seeking clarity, confidence, and consistency in trend trading. Download the Metatrader 4 Version Read the Indicator User Manual here. HURRY!  Price  increasing soon! Read the product description carefully before purchasing the
KT Displaced Moving Averages MT5
KEENBASE SOFTWARE SOLUTIONS
KT DMA is a modified and advanced version of the classic Displaced Moving Averages with buy/sell crossover alerts and a Multi-Timeframe scanner that shows DMA's direction across each real-time time frame. A Displaced Moving Average is a simple moving average that moves ahead or backward in a time frame (either short-term or long-term). It also allows you to predict price movement more accurately. Features Depicts the trend direction using the alignment of three moving averages. Buy/Sell signals
My Point MT5
Claudia Ramona Angerer
Diagnosis of major and minor pivot Trend detection with many signals Can be used in all symbols Can be used in all time frames Settings: Back Show: The number of candles it displays If you need any adjustments, or have any questions or suggestions, message me How to trade: Blue: sell signal Red: buy signal Blue and red at the same time: no signal Exit signal: Opposite signal
Aussenstab Markttechnik
Alexander Josef Zeidler
This indicator shows external bars ("Aussenstäbe") in the chart in candle form. The colors of the candles can be set individually. Also different colors for bearish and bullish bars are possible. In addition, the color of the wicks or outlines is also adjustable. Outside bars are mentioned e.g. by Michael Voigt in the book "Das große Buch der Markttechnik". All other candles are inner bars.
Quant Kelly Trader
Christian Alexander Foehl
Quant Kelly Trader EA는 정교한 시장 구조 신호와 켈리 공식을 기반으로 한 수학적 리스크 관리 기법을 결합합니다. S&P500 (US500) M15 차트를 위해 설계되었으며, 빠른 자본 성장과 통제된 리스크를 동시에 제공합니다. 세계 최고의 퀀트 및 투자자들의 전략에서 영감을 얻었습니다. 축적 국면에 초점을 맞추고 조정된 켈리 공식을 적용하여, 이 EA는 성장 잠재력을 활용하면서 리스크를 관리하려는 트레이더들에게 전문적인 도구를 제공합니다. 전략 EA는 주요 시장 참여자들이 포지션을 쌓는 축적 국면을 식별합니다. 이 구역에서 진입하고 이후 전체 추세를 따릅니다. 오픈 포지션은 체계적으로 보호되어 손실을 줄이고 이익을 효율적으로 확대합니다. 세션, 요일 및 추세 필터는 고품질의 신호만 거래되도록 보장합니다. 내장된 트레일링 스톱은 이익을 확대하면서 손실을 꾸준히 제한합니다. 켈리 공식 기반 리스크 관리 켈리 공식은 수십 년 동안 자본 성장을 효율적으로 달성하기 위한
Four Bands
Leonid Basis
Optimistic trader may enter the market when the price crosses the Aqua line. More reliable entry will be when the price crosses the Blue line. When the price comes back and crosses the Red line you can open a position in the course of price movements.
Fibonacci automatically draws Fibonacci retracement, Because Fibonacci automatically draws Fibonacci retracement, you can know at a glance the price to buy at a push or sell back. Therefore, you can trade in favorable conditions in a trending market. We are live-streaming the actual operation of the system. Please check for yourself if it is usable. Please check it out for yourself. https://www.youtube.com/@ganesha_forex We do not guarantee your investment results. Investments should be made
Trading Vision Ex
Vitalii Zakharuk
Product Description: Trading Vision – Automated Assistant for Forex Traders Introduction In today's financial markets, automating Forex trading is not just desirable but essential for success. The primary goal of automated trading systems like Trading Vision is to simplify the trading process by implementing advanced algorithms to analyze market trends. This allows traders to focus on strategic thinking while leaving routine operations to technology. What is Trading Vision? Trading Vision is a p
SmartMass MT5
Roberto Alvarez
SMARTMASS INDICATOR This indicator is different from all known volume indicators. It has a significant distinction; it is an algorithm that relates price movement to volume, attempting to find proportionality and efficient movement while filtering out noise and other movements that are more random and do not follow a trend or reversal. Ultimately, it reveals the true strength of the movement, indicating whether it has genuine support from bulls or bears or if it's merely a high-volume movement
Gordian Knot 1
Hidenori Tanaka
This EA is a simple automated trading system for the Meta Trader 5 platform. It uses parabolic SAR to automatically adjust lot size based on market trends. By this, the EA does not take a large amount of risk, but instead steadily accumulates profits. Main Features The EA does not use the martingale method for lot size adjustment. If a position is taken before the forex market closes, the position will be carried over to the weekend. This EA is designed to hold multiple positions at the same t
Kill Zones MT5
Diego Arribas Lopez
MT4 Version Kill Zones Kill Zones allows you to insert up to 3 time zones in the chart. The visual representation of the Kill Zones in the chart together with an alert and notification system helps you to ignore fake trading setups occurring outside the Kill Zones or specific trading sessions. Using Kill Zones in your trading will help you filter higher probability trading setups. You should select time ranges where   the market   usually reacts with high volatility. Based on   EST time zone, fo
Smart FVG Levels Indicator for MT5
Mohammad Taher Halimi Tabrizi
Smart FVG Levels Indicator for MT5   Category   Platform Level   Type     Time frames   trader style market   ICT SMC Indicator Meta Trader 5 Level Indicator Level Indicator All Time frames Scalpers  Day Traders  Swing Traders  Position Traders All Type of Markets Introduction The Smart FVG Levels Indicator for MT5 is a powerful trading tool designed to help you identify Fair Value Gaps (FVGs) automatically on your charts. Whether you are a beginner or an experienced trader, this ind
이 제품의 구매자들이 또한 구매함
이 지표를 구매하면 제 프로페셔널 트레이드 매니저를 무료로 드립니다. 우선 이 거래 시스템이 리페인팅, 리드로잉 및 레이그 인디케이터가 아니라는 점을 강조하는 것이 중요합니다. 이는 수동 및 로봇 거래 모두에 이상적인 것으로 만듭니다. 온라인 강좌, 설명서 및 프리셋 다운로드. "스마트 트렌드 트레이딩 시스템 MT5"은 새로운 및 경험이 풍부한 트레이더를 위해 맞춤형으로 제작된 종합적인 거래 솔루션입니다. 10개 이상의 프리미엄 인디케이터를 결합하고 7개 이상의 견고한 거래 전략을 특징으로 하여 다양한 시장 조건에 대한 다목적 선택이 가능합니다. 트렌드 추종 전략: 효과적인 트렌드 추이를 타기 위한 정확한 진입 및 손절 관리를 제공합니다. 반전 전략: 잠재적인 트렌드 반전을 식별하여 트레이더가 범위 시장을 활용할 수 있게 합니다. 스캘핑 전략: 빠르고 정확한 데이 트레이딩 및 단기 거래를 위해 설계되었습니다. 안정성: 모든 인디케이터가 리페인팅, 리드로잉 및 레이그가 아니므로 신뢰
Divergence Bomber
Ihor Otkydach
4.96 (77)
이 지표를 구매하신 분께는 다음과 같은 혜택이 무료로 제공됩니다: 각 거래를 자동으로 관리하고, 손절/익절 수준을 설정하며, 전략 규칙에 따라 거래를 종료하는 전용 도우미 툴 "Bomber Utility" 다양한 자산에 맞게 지표를 설정할 수 있는 셋업 파일(Set Files) "최소 위험", "균형 잡힌 위험", "관망 전략" 모드로 설정 가능한 Bomber Utility의 셋업 파일 이 전략을 빠르게 설치, 설정, 시작할 수 있도록 돕는 단계별 영상 매뉴얼 주의: 위의 모든 보너스를 받기 위해서는 MQL5 개인 메시지 시스템을 통해 판매자에게 연락해 주세요. 독창적인 커스텀 지표인 “Divergence Bomber(다이버전스 봄버)”를 소개합니다. 이 지표는 MACD 다이버전스(괴리) 전략을 기반으로 한 올인원(All-in-One) 거래 시스템입니다. 이 기술 지표의 주요 목적은 가격과 MACD 지표 간의 다이버전스를 감지하고, **향후 가격이 어느 방향으로 움직일지를 알려주는
Entry In The Zone and SMC Multi Timeframe 은 Smart Money Concepts(SMC)를 기반으로 개발된 실시간 시장 분석 도구입니다. 이 시스템은 트레이더가 시장 구조를 체계적으로 분석하고 전체적인 시장 방향을 더욱 명확하게 파악할 수 있도록 설계되었습니다. 시스템은 여러 시간대에서 반전 포인트(Reversal Points), 핵심 구역(Key Zones), 그리고 시장 구조(Market Structure)를 자동으로 분석하며, POI(Point of Interest), 노 리페인트(No Repaint) 신호, 자동 피보나치 레벨(Auto Fibonacci Levels)을 표시하여 되돌림(Pullback)과 반전 포인트를 정확하게 탐지할 수 있도록 돕습니다. 또한 실시간 신호와 알림을 통해 가격이 핵심 구역에 진입하거나 해당 구역에서 반전 신호가 발생하는 순간을 놓치지 않도록 보조합니다. 더불어 이 시스템은 인디케이터와 신호 시스템을 하나로
Atomic Analyst MT5
Issam Kassas
4.19 (27)
우선적으로 언급할 점은이 거래 지표가 다시 그리지 않고 지연되지 않으며 이를 통해 수동 및 로봇 거래 모두에 이상적이라는 점입니다. 사용자 매뉴얼: 설정, 입력 및 전략. Atomic Analyst는 가격의 강도와 모멘텀을 활용하여 시장에서 더 나은 이점을 찾는 PA Price Action Indicator입니다. 고급 필터를 장착하여 잡음과 거짓 신호를 제거하고 거래 잠재력을 높이는 데 도움이 됩니다. 복잡한 지표의 다중 레이어를 사용하여 Atomic Analyst는 차트를 스캔하고 복잡한 수학적 계산을 간단한 신호와 색상으로 변환하여 초보 트레이더가 이해하고 일관된 거래 결정을 내릴 수 있도록합니다. "Atomic Analyst"는 새로운 및 경험이 풍부한 트레이더를위한 종합적인 거래 솔루션입니다. 프리미엄 지표와 최고 수준의 기능을 하나의 거래 전략에 결합하여 모든 종류의 트레이더에 대한 다재다능한 선택지가되었습니다. 인트라데이 거래 및 스캘핑 전략 : 빠르고 정확한 일일
Gold Sniper Scalper Pro
Ich Khiem Nguyen
3.29 (7)
Gold Sniper Scalper Pro - MetaTrader 5 용 골드 (XAU/USD) 트레이딩 시스템 진지한 트레이더를 위한: 여러 시장 분석 요소를 결합한 구조화되고 데이터 중심적인 방법론으로 골드 거래에 접근하세요. 이 도구는 귀하의 골드 거래 분석을 지원하도록 제작되었습니다. 한정 가격 기회 이것은 가격이 오르기 전에 Gold Sniper Scalper Pro를 소유할 기회입니다. 제품 가격은 이후 10회 구매마다 $50씩 인상됩니다. 최종 가격: $498 분석적 우위를 정의하는 기능 Gold Sniper Scalper Pro는 깊은 통찰력과 명확한 통계적 이점을 제공하도록 설계된 포괄적인 도구 키트입니다: 시스템, 입력 사용자 지정 및 지표 사용 시 주의사항을 포함한 상세 지표 사용 가이드는 아래 MQL 게시물에 제시되어 있습니다. 해당 문서를 참조하십시오. Gold Sniper Scalper Pro - Gold (XAU/USD) Trading System on
Game Changer Indicator mt5
Vasiliy Strukov
5 (6)
Game Changer는 모든 금융 상품에 사용하도록 설계된 혁신적인 추세 지표로, 메타트레이더를 강력한 추세 분석기로 탈바꿈시켜 줍니다. 이 지표는 재작성이나 지연 현상이 발생하지 않습니다. 모든 시간대에서 작동하며 추세 파악을 지원하고, 잠재적 반전 신호를 제공하며, 트레일링 스톱 메커니즘으로 활용되고, 신속한 시장 반응을 위한 실시간 알림을 제공합니다. 숙련된 투자자, 전문가, 또는 우위를 점하려는 초보자 등 누구나 이 도구를 통해 자신감과 원칙을 바탕으로, 그리고 근본적인 추세 역학에 대한 명확한 이해를 바탕으로 거래할 수 있습니다. 구매 후 바로 연락 주시면 개인 보너스를 드립니다! 강력한 지지선과 추세 스캐너 지표를 무료로 받으실 수 있습니다. 개인 메시지로 알려주세요 저는 텔레그램에서 EA나 특별 세트를 판매하지 않습니다. Mql5에서만 사용 가능하며, 세트 파일은 제 블로그에서만 볼 수 있습니다 . 사기꾼을 조심하시고 다른 사람에게서 세트를 구매하지 마세요 설정 추세
FX Power MT5 NG
Daniel Stein
5 (28)
FX Power: 통화 강세 분석으로 더 스마트한 거래 결정을 개요 FX Power 는 어떤 시장 상황에서도 주요 통화와 금의 실제 강세를 이해하기 위한 필수 도구입니다. 강한 통화를 매수하고 약한 통화를 매도함으로써 FX Power 는 거래 결정을 단순화하고 높은 확률의 기회를 발견합니다. 트렌드를 따르거나 극단적인 델타 값을 사용해 반전을 예측하고자 한다면, 이 도구는 귀하의 거래 스타일에 완벽히 적응합니다. 단순히 거래하지 말고, FX Power 로 더 스마트하게 거래하세요. 1. FX Power가 거래자에게 매우 유용한 이유 통화와 금의 실시간 강세 분석 • FX Power 는 주요 통화와 금의 상대적 강세를 계산하고 표시하여 시장 역학에 대한 명확한 통찰력을 제공합니다. • 어떤 자산이 앞서고 있고 어떤 자산이 뒤처지는지 모니터링하여 보다 현명한 거래 결정을 내릴 수 있습니다. 포괄적인 멀티 타임프레임 뷰 • 단기, 중기 및 장기 타임프레임에서 통화와 금의 강세를
Azimuth Pro
Ottaviano De Cicco
5 (1)
LAUNCH PROMO Azimuth Pro price is initially set at 299 $ for the first 100 buyers. Final price will be 499 $ . THE DIFFERENCE BETWEEN RETAIL AND INSTITUTIONAL ENTRIES ISN'T THE INDICATOR — IT'S THE LOCATION. Most traders enter at arbitrary price levels, chasing momentum or reacting to lagging signals. Institutions wait for price to reach structured levels where supply and demand actually shift. Azimuth Pro maps these levels automatically: swing-anchored VWAP, multi-timeframe structure lines,
Trend Screener Pro MT5
STE S.S.COMPANY
4.84 (99)
트렌드 표시기, 트렌드 트레이딩 및 필터링을 위한 획기적인 고유 솔루션, 하나의 도구 안에 내장된 모든 중요한 트렌드 기능! Forex, 상품, 암호 화폐, 지수 및 주식과 같은 모든 기호/도구에 사용할 수 있는 100% 다시 칠하지 않는 다중 시간 프레임 및 다중 통화 표시기입니다. Trend Screener는 차트에 점이 있는 화살표 추세 신호를 제공하는 효율적인 지표 추세 추종 지표입니다. 추세 분석기 표시기에서 사용할 수 있는 기능: 1. 트렌드 스캐너. 2. 최대 이익 분석이 있는 추세선. 3. 추세 통화 강도 측정기. 4. 경고가 있는 추세 반전 점. 5. 경고가 있는 강력한 추세 점. 6. 추세 화살표 Trend Screener Indicator가 있는 일일 분석 예, 일일 신호 성능...등은 여기에서 찾을 수 있습니다. 여기를 클릭하십시오. LIMITED TIME OFFER : Trend Screener Indicator는 50$ 및 평생 동안만 사용할 수 있습니다.
Trend indicator AI mt5
Ramil Minniakhmetov
5 (13)
트렌드 인공 지능 지표는 실행 가능한 진입 점 및 반전 경고와 추세 식별을 결합하여 상인의 시장 분석을 향상시킬 훌륭한 도구입니다. 이 표시기는 사용자가 자신감과 정밀도로 외환 시장의 복잡성을 탐색 할 수 있도록 지원합니다 기본 신호 외에도 트렌드 인공 지능 지표는 풀백 또는 되돌림 중에 발생하는 2 차 진입 점을 식별하여 거래자가 기존 트렌드 내에서 가격 수정을 활용할 수 있도록합니다. 중요한 장점: ·작동 4 및 5 *명확한 구매 또는 판매 신호 *다시 칠하지 않습니다 *모든 자산에서 작동 나는 전보 사기에 개 또는 세트를 판매하지 않도록주의. 모든 설정은 블로그에 여기에 무료.  중요! 지침 및 보너스를 얻기 위해 구입 후 즉시 저에게 연락! 진짜 가동 감시는 뿐 아니라 나의 다른 제품 여기에서 찾아낼 수 있습니다: https://www.mql5.com/en/users/mechanic/seller&nbsp ; 설정 및 입력: 모든 자산에 대해 기본 설정을 권
SynaptixQuant Dominance Matrix
Devie Arevalo Montemayor
5 (1)
SynaptixQuant Dominance Matrix: Institutional-Grade Market State Extraction Engineered for traders who require a data-driven view of market behaviour beyond surface-level indicators. The Synaptix Quant (SQ) Dominance Matrix is not a conventional currency strength display. Behind its intentionally streamlined interface runs a sophisticated analytical architecture designed to quantify market conditions with precision. Every output is generated through layered signal processing built to identify d
Grabber System MT5
Ihor Otkydach
4.81 (21)
탁월한 기술적 지표인 Grabber를 소개합니다. 이 도구는 즉시 사용 가능한 “올인원(All-Inclusive)” 트레이딩 전략으로 작동합니다. 하나의 코드 안에 강력한 시장 기술 분석 도구, 매매 신호(화살표), 알림 기능, 푸시 알림이 통합되어 있습니다. 이 인디케이터를 구매하신 모든 분들께는 다음의 항목이 무료로 제공됩니다: Grabber 유틸리티: 오픈 포지션을 자동으로 관리하는 도구 단계별 영상 매뉴얼: 설치, 설정, 그리고 실제 거래 방법을 안내 맞춤형 세트 파일: 인디케이터를 빠르게 자동 설정하여 최고의 성과를 낼 수 있도록 도와줍니다 다른 전략은 이제 잊어버리세요! Grabber만이 여러분을 새로운 트레이딩의 정점으로 이끌어 줄 수 있습니다. Grabber 전략의 주요 특징: 거래 시간 프레임: M5부터 H4까지 거래 가능한 자산: 어떤 자산이든 사용 가능하지만, 제가 직접 테스트한 종목들을 추천드립니다 (GBPUSD, GBPCAD, GBPCHF, AUDCAD, AU
Quantum TrendPulse
Bogdan Ion Puscasu
5 (20)
SuperTrend   ,   RSI   ,   Stochastic   의 힘을 하나의 포괄적인 지표로 결합하여 트레이딩 잠재력을 극대화하는 궁극의 트레이딩 도구   인 Quantum TrendPulse를   소개합니다. 정밀성과 효율성을 추구하는 트레이더를 위해 설계된 이 지표는 시장 추세, 모멘텀 변화, 최적의 진입 및 종료 지점을 자신 있게 식별하는 데 도움이 됩니다. 주요 특징: SuperTrend 통합:   주요 시장 추세를 쉽게 따라가고 수익성의 물결을 타세요. RSI 정밀도:   매수 과다 및 매도 과다 수준을 감지하여 시장 반전 시점을 파악하는 데 적합하며 SuperTrend 필터로 사용 가능 확률적 정확도:   변동성이 큰 시장에서 숨겨진 기회를 찾기 위해 확률적 진동   을 활용하고 SuperTrend의 필터로 사용 다중 시간대 분석:   M5부터 H1 또는 H4까지 다양한 시간대에 걸쳐 시장을 최신 상태로 유지하세요. 맞춤형 알림:   맞춤형 거래 조건이 충족되면
ARIPoint
Temirlan Kdyrkhan
1 (1)
ARIPoint is a powerful trading companion designed to generate high-probability entry signals with dynamic TP/SL/DP levels based on volatility. Built-in performance tracking shows win/loss stats, PP1/PP2 hits, and success rates all updated live. Key Features: Buy/Sell signals with adaptive volatility bands Real-time TP/SL/DP levels based on ATR Built-in MA Filter with optional ATR/StdDev volatility Performance stats panel (Success, Profit/Loss, PP1/PP2) Alerts via popup, sound, push, or email Cu
Gartley Hunter Multi
Siarhei Vashchylka
5 (11)
Gartley Hunter Multi - An indicator for searching for harmonic patterns simultaneously on dozens of trading instruments and on all possible timeframes. Manual (Be sure to read before purchasing) | Version for MT4 Advantages 1. Patterns: Gartley, Butterfly, Shark, Crab. Bat, Alternate Bat, Deep Crab, Cypher 2. Simultaneous search for patterns on dozens of trading instruments and on all possible timeframes 3. Search for patterns of all possible sizes. From the smallest to the largest 4. All fou
Weis Wave with Alert MT5
Trade The Volume Waves Single Member P.C.
4.94 (17)
Rental/Lifetime Package Options and Privileges  Rent Monthly Six Months   Yearly/Lifetime Weis Wave with Speed with Alert+Speed Index x x x Manual  x x x Quick Set up Video x x x Blog x x x Lifetime Updates x x x Setup and Training Material x x Discord Access Channel "The SI traders"          x Rectangle Break Alert Tool      x How to trade with it:    http://www.tradethevolumewaves.com   ** If you purchase please contact me to setup your  : Training Room and  complete manual access.  Wei
SuperScalp Pro
Van Minh Nguyen
5 (1)
SuperScalp Pro – 고급 다중 필터 스캘핑 인디케이터 시스템 SuperScalp Pro는 클래식 Supertrend와 여러 지능형 확인 필터를 결합한 고급 스캘핑 인디케이터 시스템입니다. 해당 인디케이터는 M1부터 H4까지 모든 타임프레임에서 효율적으로 작동하며, 특히 XAUUSD, BTCUSD 및 주요 외환 통화쌍에 적합합니다. 독립형 시스템으로 사용하거나 기존 거래 전략에 유연하게 통합할 수 있습니다. 이 인디케이터는 11개 이상의 필터를 통합하며, 빠른/느린 EMA, 추세 판별용 3개의 EMA, EMA 기울기(EMA slope), RSI, ADX, 거래량(Volume), VWAP, 볼린저 밴드 돌파(Bollinger Bands Breakout) 및 MACD 다이버전스 필터 등을 포함합니다. 스마트 캔들 필터는 캔들 종가를 확인하여 약한 신호를 제거하고, 3 EMA와 MACD 다이버전스 필터를 결합한 추세 인식 메커니즘은 더 높은 승률의 신호를 선별하는 데 도움을 줍니
우선적으로, 이 거래 도구는 전문적인 거래에 이상적인 비-다시 그리기 및 지연되지 않는 지표입니다.  온라인 강좌, 사용자 매뉴얼 및 데모. 스마트 가격 액션 컨셉트 인디케이터는 신규 및 경험 많은 트레이더 모두에게 매우 강력한 도구입니다. Inner Circle Trader Analysis 및 Smart Money Concepts Trading Strategies와 같은 고급 거래 아이디어를 결합하여 20가지 이상의 유용한 지표를 하나로 결합합니다. 이 인디케이터는 스마트 머니 컨셉트에 중점을 두어 대형 기관의 거래 방식을 제공하고 이동을 예측하는 데 도움을 줍니다.  특히 유동성 분석에 뛰어나 기관이 어떻게 거래하는지 이해하는 데 도움을 줍니다. 시장 트렌드를 예측하고 가격 변동을 신중하게 분석하는 데 탁월합니다. 귀하의 거래를 기관 전략에 맞추어 시장의 동향에 대해 더 정확한 예측을 할 수 있습니다. 이 인디케이터는 시장 구조를 분석하고 중요한 주문 블록을 식별하고 다양
MTF Supply Demand Zones MT5
Georgios Kalomoiropoulos
5 (1)
자동화된 수요 및 공급 구역의 차세대. 모든 차트에서 작동하는 새롭고 혁신적인 알고리즘. 모든 구역은 시장의 가격 움직임에 따라 동적으로 생성됩니다. 두 가지 유형의 경고 --> 1)가격이 영역에 도달할 때 2)새로운 영역이 형성될 때 당신은 더 이상 쓸모없는 지표를 얻을 수 없습니다. 입증된 결과로 완벽한 거래 전략을 얻을 수 있습니다.     새로운 기능:     가격이 공급/수요 영역에 도달하면 경고     새로운 공급/수요 구역이 생성되면 알림     푸시 알림 알림     핍의 영역 너비 레이블     기동특무부대에 한 번 더 시간이 주어집니다. 따라서 현재보다 위의 2개의 시간 프레임 대신 현재보다 높은 3개의 시간 프레임을 볼 수 있습니다.     Alerts/Zones/MTF 기능을 활성화/비활성화하는 버튼 당신이 얻는 이점:     거래에서 감정을 제거하십시오.     거래 항목을 객관화하십시오.     높은 확률 설정을 사용하여 수익
ACB Breakout Arrows MT5
KEENBASE SOFTWARE SOLUTIONS
5 (1)
ACB Breakout Arrows 지표는 특별한 돌파 패턴을 감지하여 시장에서 중요한 진입 신호를 제공합니다. 이 지표는 차트를 지속적으로 스캔하면서 한 방향으로 움직임이 자리 잡을 때를 포착하여 큰 움직임 직전에 정확한 진입 신호를 제공합니다. 다중 종목 및 다중 시간대 스캐너는 여기에서 확인하세요 - ACB Breakout Arrows MT5용 스캐너 핵심 기능 지표가 자동으로 손절(Stop Loss) 및 익절(Take Profit) 수준을 제공합니다. 모든 시간대의 돌파 신호를 추적하는 MTF 스캐너 대시보드 포함. 데이 트레이더, 스윙 트레이더 및 스캘퍼에게 적합합니다. 신호 정확도를 높이기 위해 최적화된 알고리즘 사용. 손익분기점 또는 빠른 수익 목표를 위한 특별한 라인 (Quick Profit Line) 제공. 승률, 성공 비율, 평균 수익 등의 성과 분석 지표 제공. 재도색 없음. 신호는 고정되어 신뢰할 수 있습니다. 거래 확인 - ACB Trade Filter 지
Trend Forecaster
Alexey Minkov
5 (7)
The Trend Forecaster indicator utilizes a unique proprietary algorithm to determine entry points for a breakout trading strategy. The indicator identifies price clusters, analyzes price movement near levels, and provides a signal when the price breaks through a level. The Trend Forecaster indicator is suitable for all financial assets, including currencies (Forex), metals, stocks, indices, and cryptocurrencies. You can also adjust the indicator to work on any time frames, although it is recommen
Trend Flow PRO
Aliaksandr Alferchyk
TREND FLOW PRO 는 시장이 실제로 방향을 전환하는 지점을 식별하는 데 도움을 줍니다. 이 인디케이터는 추세 반전과 주요 시장 참여자들이 재진입하는 구간을 표시합니다. 차트의 BOS 표시는 실제 추세 전환과 상위 타임프레임의 핵심 레벨을 나타냅니다. 인디케이터 데이터는 리페인트되지 않으며, 각 봉이 마감된 후에도 차트에 그대로 유지됩니다. 인디케이터 주요 요소: BOS FLOW – 추세 파동과 실제 추세 변화. 주요 시장 참여자의 진입과 그 존재에 대한 확인을 의미합니다(숫자로 표시). BOS FILL – 추세 방향에 따라 캔들을 색칠합니다. ‘큰손’의 진입 구간과 추세가 전환되는 지점을 표시합니다. 신호 레벨: BOS – 강도가 명확하지 않은 참여자의 진입(주 추세 내 조정인 경우가 많음). Move SL – 주요 참여자가 포지션을 이동시키는 과정을 시각적으로 표현합니다. 트레이더가 손절선을 조정할 때 참고 지표로 사용할 수 있습니다. Super BOS – 일반 BOS보다
Trade smarter, not harder: Empower your trading with Harmonacci Patterns This is arguably the most complete harmonic price formation auto-recognition indicator you can find for the MetaTrader Platform. It detects 19 different patterns, takes fibonacci projections as seriously as you do, displays the Potential Reversal Zone (PRZ) and finds suitable stop-loss and take-profit levels. [ Installation Guide | Update Guide | Troubleshooting | FAQ | All Products ] It detects 19 different harmonic pri
Elliott Wave Trend MT5
Young Ho Seo
4 (4)
Elliott Wave Trend was designed for the scientific wave counting. This tool focuses to get rid of the vagueness of the classic Elliott Wave Counting using the guideline from the template and pattern approach. In doing so, firstly Elliott Wave Trend offers the template for your wave counting. Secondly, it offers Wave Structural Score to assist to identify accurate wave formation. It offers both impulse wave Structural Score and corrective wave Structure Score. Structural Score is the rating to sh
RelicusRoad Pro MT5
Relicus LLC
5 (24)
훌륭한 백테스트, 환상적인 숫자로 입증된 실제 계정 성능, 그리고 모든 곳에 퍼져 있는 통계를 자랑하는 트레이딩 지표를 얼마나 자주 구매하셨습니까? 하지만 사용 후에는 결국 계좌를 날려버리셨나요? 신호 자체만으로는 신뢰할 수 없습니다. 신호가 왜 처음 나타났는지 알아야 하며, 그것이 바로 RelicusRoad Pro가 가장 잘하는 일입니다! 사용자 매뉴얼 + 전략 + 교육 비디오 + VIP 액세스 전용 그룹 + 모바일 버전 사용 가능 시장을 보는 새로운 방법 RelicusRoad는 외환, 선물, 암호화폐, 주식 및 지수를 위한 세계에서 가장 강력하고 최고의 트레이딩 지표 로서, 트레이더가 계좌를 성장시키는 데 필요한 모든 정보와 도구를 제공합니다. 우리는 기술 분석 및 트레이딩 계획 을 제공하여 초보자 부터 고급 트레이더 까지 모든 트레이더가 성공할 수 있도록 돕습니다. 이것은 미래 시장을 예측 하는 데 충분한 정보를 제공하는 핵심 트레이딩 지표 입니다. 우리는 차트에서 의미 없
Meravith AUTO
Ivan Stefanov
5 (1)
Meravith Auto는 Meravith 거래 시스템의 자동화 버전입니다. 이 지표는 색상이 변하는 추세선으로 구성되어 있습니다. 상승 추세일 때는 녹색, 하락 추세일 때는 빨간색입니다. 이것이 추세 지지선입니다. 상승 거래량과 하락 거래량이 같은 유동성 라인. 세 배 상승 편차 라인. 세 배 하락 편차 라인. 높은 거래량을 나타내는 보라색 및 파란색 점. 보라색 점은 평균 거래량보다 2편차 큰 거래량을 나타내며, 파란색 점은 2편차를 나타냅니다. 사용 방법은? 상승 추세선과 추세선 위의 유동성은 상승 추세를 나타냅니다. 시장이 상승할 것으로 예상됩니다. 롱 포지션을 엽니다. 하락 추세선과 추세선 아래의 유동성은 하락 추세를 나타냅니다. 시장이 하락할 것으로 예상됩니다. 숏 포지션을 엽니다. 다른 지표와 자유롭게 조합하여 사용할 수 있습니다. 모든 통화쌍과 모든 시간대에서 사용할 수 있습니다. 브로커마다 표시하는 거래량이 다르기 때문에 결과가 다를 수 있습니다. 거래량이 많은 대형
TrendLine PRO MT5
Evgenii Aksenov
4.67 (33)
The Trend Line PRO indicator is an independent trading strategy. It shows the trend change, the entry point to the transaction, as well as automatically calculates three levels of Take Profit and Stop Loss protection. Trend Line PRO is perfect for all Meta Trader symbols: currencies, metals, cryptocurrencies, stocks and indices. The indicator is used in trading on real accounts, which confirms the reliability of the strategy. Robots using   Trend Line PRO   and real Signals can be found here: 
Atbot
Zaha Feiz
4.62 (55)
AtBot: 작동 방식 및 사용 방법 ### 작동 방식 MT5 플랫폼용 "AtBot" 지표는 기술 분석 도구의 조합을 사용하여 매수 및 매도 신호를 생성합니다. 01:37 단순 이동 평균(SMA), 지수 이동 평균(EMA), 평균 진폭 범위(ATR) 지수를 통합하여 거래 기회를 식별합니다. 또한 Heikin Ashi 캔들을 사용하여 신호의 정확성을 향상시킬 수 있습니다. 구매 후 리뷰를 남기면 특별 보너스 선물을 받게 됩니다. ### 주요 기능: - 비재표시: 신호는 플로팅 후 변경되지 않습니다. - 비재작성: 신호는 일관되며 변경되지 않습니다. - 지연 없음: 지연 없이 시기적절한 신호를 제공합니다. - 다양한 시간대: 거래 전략에 맞게 모든 시간대에서 사용할 수 있습니다. ### 운영 단계: #### 입력 및 설정: - firstkey (TrendValue): 추세 감지의 민감도를 조정합니다. - Secondkey (SignalValue): 매수/매도 신호 생성의 민감도를 정의
PZ Swing Trading MT5
PZ TRADING SLU
5 (5)
Protect against whipsaws: revolutionize your swing trading approach Swing Trading is the first indicator designed to detect swings in the direction of the trend and possible reversal swings. It uses the baseline swing trading approach, widely described in trading literature. The indicator studies several price and time vectors to track the aggregate trend direction and detects situations in which the market is oversold or overbought and ready to correct. [ Installation Guide | Update Guide | Tro
Matrix Arrow Indicator MT5
Juvenille Emperor Limited
5 (18)
매트릭스 화살표 표시기 MT5 는 외환, 상품, 암호 화폐, 지수, 주식과 같은 모든 기호/도구에 사용할 수 있는 100% 다시 칠하지 않는 다중 기간 표시기를 따르는 고유한 10 in 1 추세입니다.  Matrix Arrow Indicator MT5 는 다음과 같은 최대 10개의 표준 지표에서 정보와 데이터를 수집하여 초기 단계에서 현재 추세를 결정합니다. 평균 방향 이동 지수(ADX) 상품 채널 지수(CCI) 클래식 하이켄 아시 캔들 이동 평균 이동 평균 수렴 발산(MACD) 상대 활력 지수(RVI) 상대 강도 지수(RSI) 포물선 SAR 스토캐스틱 오실레이터 윌리엄스의 백분율 범위 모든 지표가 유효한 매수 또는 매도 신호를 제공하면 강력한 상승/하락 추세를 나타내는 다음 캔들/막대가 시작될 때 해당 화살표가 차트에 인쇄됩니다. 사용자는 사용할 표시기를 선택하고 각 표시기의 매개변수를 개별적으로 조정할 수 있습니다. 매트릭스 화살표 표시기 MT5는 선택한 표시기에서만 정보를 수
제작자의 제품 더 보기
지표는 가격과 오실레이터/지표 사이에 다이버전스가 발생하는 시점을 식별합니다. 그것은 규칙적인 발산과 숨겨진 발산을 모두 식별합니다. 가장 강력한 설정만 필터링할 수 있는 RSI 필터 옵션이 있습니다. 지표는 또한 Engulfing 대형, Donchian 채널 돌파 또는 가격이 이동 평균을 넘을 때까지 기다릴 수 있는 옵션을 제공합니다   (스크린샷 #3 참조)       거래 기회를 알리기 전에 다이버전스를 확인합니다. 고유한 규칙 및 기술과 결합하여 이 표시기를 사용하면 자신만의 강력한 시스템을 생성(또는 강화)할 수 있습니다. 특징 의 끝에서       제품의 블로그       지표에서 거래 신호를 검색하기 위해 iCustom() 함수를 사용하는 예제 EA(전문가 고문)의 소스 코드를 다운로드할 수 있습니다. EA가 완벽하게 작동하더라도 주요 목적은 코드를 사용하여 자신이 개발한 EA에 붙여넣는 것입니다.   내 제한된 시간을 감안할 때       하지만 프로그래밍 지원은 제
I recommend you to read the   product's blog  (manual) from start to end so that it is clear from the beginning what the indicactor offers. This multi time frame and multi symbol indicator identifies double or triple top/bottom formations or a following neckline breakout (confirmed top/bottom). It offers RSI, pin bar, engulfing, tweezer, morning/evening star filters as well divergence filter options which makes it possible to filter out only the strongest setups. The indicator can also be used
The indicator identifies when a divergence occurs between price and an indicator or oscillator. It identifies both regular and hidden divergences. Combined with your own rules and techniques, this indicator will allow you to create (or enhance) your own powerful system. For higher probability setups I can recommend you to use my Supply Demand indicator and trade only if the divergence occurs inside a zone. Supply zone for bearish div and demand zone for bullish div. The optimal scenario is if it
FREE
이 지표는 차트에 공급 및 수요 구역을 그립니다. 이 지표를 귀하의 규칙과 기술과 결합하면 귀하만의 강력한 시스템을 만들거나 개선할 수 있습니다. 훨씬 더 많은 것을 제공하는   유료 버전   도 확인해 보세요. 제 추천은 최소 25개 막대 이후에 첫 번째 구역 테스트가 발생하는 거래 기회를 찾는 것입니다. 특징 구역에는 3가지 색상이 있습니다(입력으로 조정 가능). 테스트되지 않은 구역은 어두운 색상, 테스트된 구역은 중간 색상   , 깨진 구역은 밝은 색상입니다   . 각 구역의 바깥쪽 경계 가격과 구역 테스트 금액은 각 구역에 적혀 있습니다. 입력 매개변수 최대. 첫 번째 극값을 검색하기 위한 백바   -       기본값은 3000입니다. 시간 이전의 첫 번째 극값 xx 막대를 검색합니다. 값이 높을수록 더 많은 시스템 리소스가 필요합니다   . 느린 컴퓨터의 경우 500-1000 값이 더 적합할 수 있습니다. 존 테스트 사이의 최소 캔들 수 테스트되지 않은 수요 색상 테스트
FREE
I recommend you to read the   product's blog  (manual) from start to end so that it is clear from the beginning what the indicactor offers. This multi time frame and multi symbol divergence dashboard indicator sends an alert when one or two different divergences have been identified. It can be used with all time frames from M1 to MN. Maximum 9 time frames can be shown in the dashboard at the same time. It is possible to enable moving average, RSI or Bollinger bands trend filter to filter out on
이 공급 및 수요 영역 표시기는 차트에 영역을 그리고 가격이 영역에 도달하거나 영역을 깨면 경고를 보냅니다. 구역 대신 일반 이중 상단/하단에 대해 경고하는 데 사용할 수도 있습니다. RSI, ADX, 볼륨 및 발산 필터를 사용하여 가장 강력한 설정만 필터링할 수 있습니다. 고유한 규칙 및 기술과 결합하여 이 표시기를 사용하면 자신만의 강력한 시스템을 생성(또는 강화)할 수 있습니다. 이 지표는 이미 공급 수요에 대해 잘 알고 있고 거래를 마감하거나 개설하기로 결정할 때 이를 어떻게 사용할 수 있는지에 대해 이미 잘 알고 있는 경험 많은 거래자를 위한 것입니다. 특징 다음 분기가 지원됩니다.       MACD, OsMA, RSI, CCI, Stochastics 및 Awesome. 구역에는 3가지 색상이 있습니다(입력으로 조정 가능). 테스트되지 않은 영역의 경우 어두운 색상, 테스트된 영역의 경우 중간 색상, 깨진 영역의 경우 밝은 색상. 구역 외경의 가격과 구역 테스트 금액이
이 지표는 차트에 공급 및 수요 구역을 그립니다. 이 지표를 귀하의 규칙과 기술과 결합하면 귀하만의 강력한 시스템을 만들거나 개선할 수 있습니다. 훨씬 더 많은 것을 제공하는   유료 버전   도 확인해 보세요. 제 추천은 최소 25개 막대 이후에 첫 번째 구역 테스트가 발생하는 거래 기회를 찾는 것입니다. 특징 구역에는 3가지 색상이 있습니다(입력으로 조정 가능). 테스트되지 않은 구역은 어두운 색상, 테스트된 구역은 중간 색상   , 깨진 구역은 밝은 색상입니다   . 각 구역의 바깥쪽 경계 가격과 구역 테스트 금액은 각 구역에 적혀 있습니다. 입력 매개변수 최대. 첫 번째 극값을 검색하기 위한 백바   -       기본값은 3000입니다. 시간 이전의 첫 번째 극값 xx 막대를 검색합니다. 값이 높을수록 더 많은 시스템 리소스가 필요합니다   . 느린 컴퓨터의 경우 500-1000 값이 더 적합할 수 있습니다. 존 테스트 사이의 최소 캔들 수 테스트되지 않은 수요 색상 테스트
FREE
The indicator identifies when a divergence occurs between price and an indicator or oscillator. It identifies bullish and bearish hidden or regular (classical) divergences. Combined with your own rules and techniques, this indicator will allow you to create (or enhance) your own powerful system. For higher probability setups I can recommend you to use my  Supply Demand indicator  and trade only if the divergence occurs inside a zone. Supply zone for bearish div and demand zone for bullish div. T
FREE
This indicator can send alerts when a Heiken Ashi Smoothed color change occurs. Combined with your own rules and techniques, this indicator will allow you to create (or enhance) your own powerful system. Features Can send all types of alerts. Option to delay the alert one or more bars in order to confirm the color (trend) change. Input parameters Candle shift for alert: Default is 1. Setting it to 0 will alert you on color change on the current candle. This should be regarded as a pending (uncon
FREE
가능하면 구매를 고려하십시오       계속해서 개발할   MT5 버전   입니다(이 MT4 버전에 대한 향후 업데이트는 없을 예정입니다). 나는 또한 당신이 읽을 것을 권장합니다       제품의 블로그   (매뉴얼)를 처음부터 끝까지 검토하여 EA가 제공하는 것을 처음부터 명확하게 합니다. 이 EA(Expert Advisor)의 주요 전략은 3개의 이동 평균(MA)이 연속적으로 정렬되고 서로 일정한 거리에 있을 때 거래를 하는 것입니다(예를 들어 일부 기관 거래자가 사용하는 잘 알려지지 않은 전략에 사용할 수 있음) , D1 시간 프레임의 MA 10, 20 및 30 포함). EA는 H1 및 더 큰 시간 프레임에서 가장 잘 작동합니다. 삼중 MA 전략(어떤 MA가 사용되든 상관없음)은 장기 전략으로 간주되어야 합니다. 나쁜 달이 연속으로 있을 수 있습니다. 따라서 이 EA는 단기간에 빈번한 거래와 지속적인 이익을 찾는 거래자를 위한 것이 아닙니다. 기본 설정은 EURUSD H1에
This indicator can send alerts when a Heiken Ashi Smoothed color change occurs. Combined with your own rules and techniques, this indicator will allow you to create (or enhance) your own powerful system. Features Can send all types of alerts. Option to delay the alert one bar in order to confirm the color (trend) change. Input parameters Wait for candle close: 'true' or 'false'. Setting it to 'true' will delay the alert to the opening of the bar following the bar where the color change occurred.
FREE
EA가 제공하는 것이 무엇인지 처음부터 명확하게 알 수 있도록 해당   제품의 블로그   (매뉴얼)를 처음부터 끝까지 읽어 보시기를 권합니다. 이 전문가 조언자는 가격과 오실레이터/지표 사이에 차이가 발생하는 시기를 식별합니다. 이는 일반/고전적(추세 반전) 및 숨겨진(추세 지속) 다이버전스를 모두 식별합니다. 공급/수요 영역, RSI, 볼린저, 확률론, 이동 평균(일반 MA 및 Hull MA), ADX 및 가장 강력한 설정만 필터링할 수 있는 볼륨 필터 옵션이 있습니다. 기본 설정은 EURUSD H1에 최적화되어 있습니다(아래 스크린샷 참조). EA는 하나의 차트에서 여러 기호를 거래할 수 있습니다. 이 옵션은 4가지 방법으로 사용할 수 있습니다. 종합시세 창에 보이는 모든 기호 입력 매개변수에 제공된 기호 대화 상자에서 선택한 사전 설정 파일의 기호 사전 정의된 폴더에 있는 사전 설정 파일의 기호(입력 매개변수로 제공) 옵션 3과 4의 경우 각 사전 설정 파일에서 일부 설정만
나는 당신이 읽을 것을 권합니다       제품의 블로그   (설명서)를 처음부터 끝까지       EA가 제공하는 것은 처음부터 분명합니다. 이 EA(Expert Advisor)의 주요 전략은 3개의 이동 평균(MA)이 연속적으로 정렬되고 서로 일정한 거리에 있을 때 거래를 하는 것입니다(예를 들어 일부 기관 거래자가 사용하는 잘 알려지지 않은 전략에 사용할 수 있음) , D1 시간 프레임의 MA 10, 20 및 30 포함). EA는 H1 및 더 큰 시간 프레임에서 가장 잘 작동합니다. 삼중 MA 전략(어떤 MA가 사용되든 상관없음)은 장기 전략으로 간주되어야 합니다. 나쁜 달이 연속으로 있을 수 있습니다. 따라서 이 EA는 단기간에 빈번한 거래와 지속적인 이익을 찾는 거래자를 위한 것이 아닙니다. 기본 설정은 EURUSD H1에 최적화되어 있습니다(2015.01.01 - 2022.12.29, 224 거래, 이는 주당 평균 0,52 거래를 의미함).   여기에서   신호 모니터링
I recommend you to read the   product's blog  (manual) from start to end so that   it is clear from the beginning what the indicator offers. This multi oscillator, multi time frame and multi symbol indicator identifies when a divergence occurs between price and an oscillator/indicator. It identifies both regular/classical (trend reversal) and hidden (trend continuation) divergences. It has moving average, RSI/Bollinger, ADX, pin bar and engulfing filter options which makes it possible to filter
This multi indicator/oscillator (hereafter indicator), multi time frame and multi symbol indicator identifies when a divergence occurs between price and one, two or three indicators. It identifies both regular/classical (trend reversal) and hidden (trend continuation) divergences. It has RSI and MA trend filter options which makes it possible to filter out only the strongest setups. Combined with your own rules and techniques, this indicator will allow you to create (or enhance) your own powerfu
I recommend you to read the   product's blog  (manual) from start to end so that it is clear from the beginning what the indicactor offers. This indicator for Metatrader 4 identifies when a divergence occurs between price and an oscillator/indicator. It identifies both bullish and bearish divergences. It has a RSI filter option which makes it possible to filter out only the strongest setups. The indicator also offers options to wait for an Engulfing formation, Donchian channel breakout or for p
Chart patterns scanner
Jan Flodin
4.67 (6)
I  recommend you to read the   product's blog  (manual) from start to end so that it is clear from the beginning what the indicator offers. This multi time frame and multi symbol indicator identifies double top/bottom, head & shoulders, pennant/triangle and flag patterns. It is also possible to setup alerts only when a neckline/triangle/flagpole breakout has occured (neckline breakout = confirmed signal for top/bottoms and head & shoulders).  The indicator can also be used in single chart mode.
This indicator recognizes a special type of Inside Bar formation which is formed by a big Master candle followed by 4 smaller candles (please see the strategy explanation below). Features Plots buy/sell stop lines on the chart as well as well as take profit and stop loss levels. The TP/SL levels are based on the Average True Range (ATR) indicator. Object colors are changeable. Sends you a real-time alert when a Master candle formation is identified - sound / popup / email / push notification. On
나는 당신이 읽어볼 것을 권장합니다       지표가 무엇을 제공하는지 처음부터 명확하게 알 수 있도록   제품 블로그   (매뉴얼)를 처음부터 끝까지 작성합니다. 이 다중 시간 프레임과 다중 심볼 지표는 핀 바를 스캔합니다. 자신의 규칙과 기술과 결합하면 이 지표를 통해 자신의 강력한 시스템을 만들거나 강화할 수 있습니다. 특징 Market Watch 창에서 볼 수 있는 모든 심볼을 동시에 모니터링할 수 있습니다. 지표를 단 하나의 차트에 적용하고 전체 시장을 즉시 모니터링합니다. Can은 M1에서 MN까지 모든 시간대를 모니터링하고 핀 바가 식별되면 실시간 알림을 보냅니다. 모든 Metatrader 기본 알림 유형이 지원됩니다. RSI를 트렌드 필터로 사용하여 잠재적인 반전을 적절히 식별할 수 있습니다. 이 표시기에는 대화형 패널이 포함되어 있습니다. 별도의 스크린샷을 참조하세요. 매수/매도 라인과 TP/SL 라인(ATR 배수 기반)을 표시하도록 구성할 수 있습니다. 라인은 패
I  recommend you to read the   product's blog  (manual) from start to end so that it is clear from the beginning what the indicator offers. This multi time frame and multi symbol indicator scans for engulfing and tweezer formations. The indicator can also be used in single chart mode. Combined with your own rules and techniques, this indicator will allow you to create (or enhance) your own powerful system. Features Can monitor all symbols visible in your Market Watch window at the same time. Ap
This multi time frame and multi symbol indicator identifies high-probability breakout patterns. It does this by identifying strong, symmetrical pennants and triangles. This pattern DOES NOT appear very often on higher time frames. But when it does, it is a very high-probability setup. The indicator also includes an Inside bars scanner. It can for example be used to detect a special type of Inside bars formation which is formed by a Master candle (MC) followed by 4 inside candles (please see the
Features This is an indicator that recognizes a special type of Inside Bar formation which is formed by a Master candle followed by 4 smaller candles (please see the strategy explanation below). Plots buy/sell stop lines on the chart as well as well as take profit and stop loss levels. The TP/SL levels are based on the Average True Range (ATR) indicator. Object colors are changeable. Sends you a real-time alert when a Master candle formation is identified - sound / pop-up / email / push notifica
This multi time frame and multi symbol indicator scans for Pin bars, Morning/Evening stars, Engulfings, Tweezers, Three line strikes, Inside bars and Pennants and Triangles. The indicator can also be used in single chart mode. Please read more about this option in the product's blog . Combined with your own rules and techniques, this indicator will allow you to create (or enhance) your own powerful system. Features Can monitor all symbols visible in your Market Watch window at the same time. App
이 다중 기호 및 다중 시간 프레임 표시기는 다음 촛대 패턴을 스캔합니다(패턴 설명은 스크린샷 참조). 백병 3명(역전>연속 패턴) 검은 까마귀 3마리(역전>연속 패턴) 강세 및 약세 쓰리 라인 스트라이크(역전 패턴) 지표 설정의 엄격한 옵션이 활성화된 경우 패턴이 더 높은 기간에 자주 나타나지 않습니다. 그러나 그렇게 할 때 그것은 매우 높은 가능성의 설정입니다. Thomas Bulkowski(국제적으로 알려진 촛대 패턴의 저자이자 선도적인 전문가)에 따르면 Three line strike는 모든 촛대 패턴의 전체 성능 순위가 가장 높습니다. 고유한 규칙 및 기술과 결합하여 이 표시기를 사용하면 강력한 시스템을 생성(또는 강화)할 수 있습니다. 특징 Market Watch 창에 표시되는 모든 기호를 동시에 모니터링할 수 있습니다. 하나의 차트에만 지표를 적용하고 전체 시장을 즉시 모니터링하십시오. M1에서 MN까지 모든 시간 프레임을 모니터링할 수 있으며 패턴이 식별되면 실시간 경
I recommend you to read the   product's blog  (manual) from start to end so that it is clear from the beginning what the indicactor offers. This multi time frame and multi symbol indicator can identify the following 5 crosses: when a fast moving average crosses a slow moving average line. when price has reached a single moving average (closed above/below or just bounced). when a triple moving average formation has appeared (all 3 MA:s in consecutive alignment). when the MACD main line crosses t
I recommend you to read the   product's blog  (manual) from start to end so that it is clear from the beginning what the indicactor offers. This multi time frame and multi symbol indicator identifies double or triple top/bottom formations or a following neckline breakout (confirmed top/bottom). It offers filters for RSI overbought/oversold, candle patterns (pin bar, engulfing, tweezer, morning/evening star, three line strike) and divergences (MACD, OsMA, Awesome (AO), RSI, CCI, Stochastic) whic
This multi indicator/oscillator (hereafter indicator), multi time frame and multi symbol indicator identifies when a divergence occurs between price and one, two or three indicators. It identifies both regular/classical (trend reversal) and hidden (trend continuation) divergences. It has RSI and MA trend filter options which makes it possible to filter out only the strongest setups. Combined with your own rules and techniques, this indicator will allow you to create (or enhance) your own powerfu
This multi time frame and multi symbol indicator identifies when the stochastics signal line (D) crosses the stochastics main line (K) as well as options  to scan for main line and signal line level crossovers.  As a bonus it can also scan for Bollinger bands and RSI overbought/oversold crosses. Combined with your own rules and techniques, this indicator will allow you to create (or enhance) your own powerful system. Features Can monitor all symbols visible in your Market Watch window at the sam
Averaging down EA
Jan Flodin
5 (1)
This cost averaging Expert advisor (EA) places additional trades in the same direction as the original (manually opened) order when the price goes against you. It can be used as a grid system or as pure martingale system (exponential increasing of lot size) or smoothed martingale (for instance linear increasing of the lot size). Due to the risk involved, this EA is more suitable for intermediate to advanced traders who are well aware of how to handle risk management and trading an already profit
Trend dashboard
Jan Flodin
1 (1)
이 다중 시간 프레임 및 다중 기호 추세 표시기는 강한 추세 또는 추세 반전이 식별되면 경고를 보냅니다. 이동 평균(싱글 또는 더블(MA 크로스오버)), RSI, 볼린저 밴드, ADX, 종합 지수, 포물선 SAR, Awesome(AO), MACD(신호 라인),       스토캐스틱 크로스오버 또는 헐 이동 평균   . M5에서 MN까지 모든 시간 프레임에서 사용할 수 있습니다. 대시보드의 색상은 강세를 나타내는 녹색, 약세를 나타내는 빨간색, 중립을 나타내는 파란색입니다(지표 값이 범위에 없음). 고유한 규칙 및 기술과 결합하여 이 표시기를 사용하면 강력한 시스템을 생성(또는 강화)할 수 있습니다. 특징 표시기는 자동 거래를 위해 Expert Advisor가 사용할 수 있는 글로벌 변수에 신호를 쓸 수 있습니다. 예를 들어   이 제품   . 사용할 시간대를 선택할 수 있습니다. 대시보드 내에서 추세 강도 순위 정렬을 지속적으로 수행합니다. 특정 기호를 더 쉽게 찾을 수 있도록 이
필터:
tunck
1204
tunck 2023.04.08 02:44 
 

SL/TP for patterns?

Jan Flodin
138635
개발자의 답변 Jan Flodin 2023.04.08 13:45
Hello and many thanks for the review :-)
Engulfing, Tweezer and Three line strike:
The entry is typically at the high/low of the pattern. SL and risk level for trading can be placed at the swing high/low of the pattern. This makes it relatively easy for traders to target (TP) at least twice the distance of their stop loss, creating a 1:2 risk-to-reward ratio.
Pin bar:
Entry on break of pin bar high/low. SL at pin bar low/high. TP at previous swing point. For this purpose you can use Donchian channel (highest/lowest of last 20 bars). Please make sure that it will give at least R/R (risk/reward) of 1:2).
Inside bars and Pennants/triangles:
Will need to attach a document which is not possible here. I will send you a private message on MQL5 as soon as you have approved my Friends request (you have blocked sending private messages from non friends)
Kayhan
62
Kayhan 2021.09.07 16:25 
 

I was looking forward to seeing this kind of indicator. Thank you very much.

Delboyuk
81
Delboyuk 2020.12.29 18:22 
 

사용자가 평가에 대한 코멘트를 남기지 않았습니다

smmfx
80
smmfx 2020.11.05 16:07 
 

An amazing indicator that gives me very accurate signals based on my strategy. I thank Jan for answering my challenging questions before I buy it. The coding and details that saw looks very professional.

Thomas
84
Thomas 2019.07.10 11:22 
 

Perfect. Get really good Signals. Thx Jan again.

Devonish
3254
Devonish 2018.11.21 20:23 
 

I've just rented this for a month and initial impressions are good. Its quite likely I may go on to purchase as scanning all assets on all time frames is not practical. It will be used to support existing strategies. The only reason its not 5 star is having the candle/s highlighted on the chart would be nice, but I accept its not possible.

June 2019 Update: I purchased this product and have been using it for six months. It compliments my strategies very well. Upgraded to 5 stars.

리뷰 답변