Candle patterns scanner with trend filter MT5

5

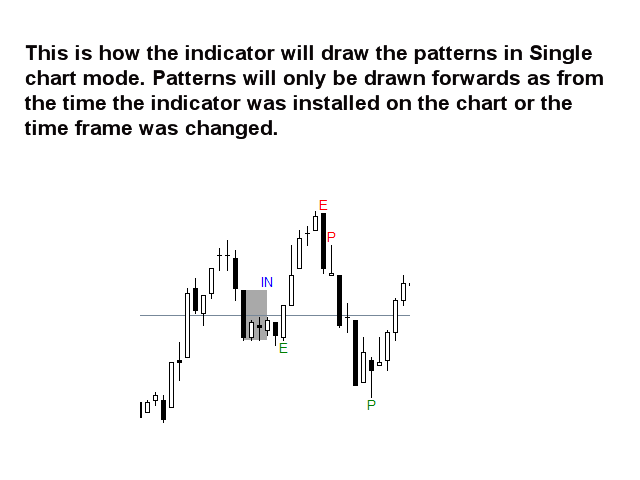
Bu çoklu zaman çerçevesi ve çoklu sembol göstergesi, Pin çubukları, Sabah/akşam yıldızları, Yutma, Cımbız, Üç Çizgi Darbesi, İç çubuklar ve Flamalar ve Üçgenler için tarama yapar. Gösterge, tekli grafik modunda da kullanılabilir. Lütfen bu seçenek hakkında daha fazla bilgiyi ürünün   blog .   Kendi kurallarınız ve tekniklerinizle birlikte bu gösterge, kendi güçlü sisteminizi oluşturmanıza (veya geliştirmenize) izin verecektir.

Özellikleri

  • Piyasa İzleme pencerenizde görünen tüm sembolleri aynı anda izleyebilir. Göstergeyi yalnızca bir grafiğe uygulayın ve tüm piyasayı anında izleyin.
  • M1'den MN'ye kadar her zaman çerçevesini izler ve bir model tanımlandığında size gerçek zamanlı bir uyarı (açılır pencere, push veya posta) gönderir.
  • RSI ve Bollinger bantlarını pin çubuğu, sabah/akşam yıldızı , yutan ve cımbız oluşumları için filtre olarak kullanabilir ve olası geri dönüşleri doğru bir şekilde belirleyebilir.
  • Hareketli ortalamayı ana trend filtresi ve ADX'i değişkenlik filtresi olarak kullanabilir.
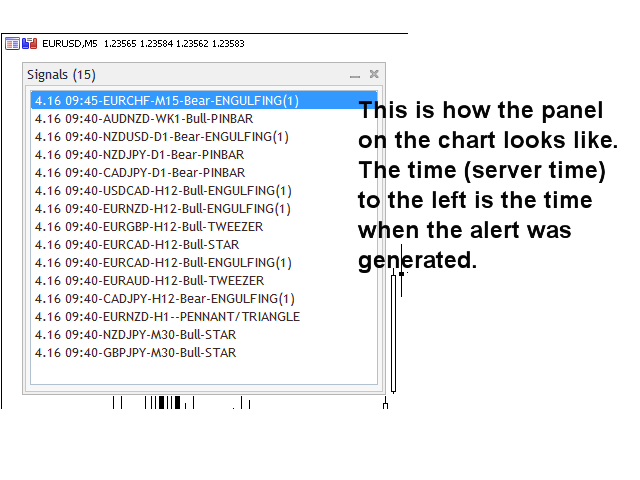
  • Gösterge, etkileşimli bir panel içerir. Bir öğeye tıklandığında, söz konusu sembol ve zaman çerçevesi ile yeni bir grafik açılacaktır.
  • Gösterge, sinyalleri bir Uzman Danışman tarafından otomatik ticaret için kullanılabilecek bir dosyaya yazabilir. Örneğin bu ürün .

Flama ve Üçgenler taraması, yüksek olasılıklı koparma modellerini tanımlar. Bunu güçlü, simetrik Flamalar ve Üçgenler belirleyerek yapar. Bu model, daha yüksek zaman dilimlerinde çok sık GÖRÜNMEMEKTEDİR. Ancak gerçekleştiğinde, çok yüksek olasılıklı bir kurulum. Bakınız   ekran görüntüleri burada .

Giriş parametreleri

Lütfen giriş parametrelerinin açıklamasını ve açıklamasını burada bulabilirsiniz .

Önemli

Lütfen çok işlevli olması nedeniyle, göstergenin kurulu olduğu çizelgede ne alım satım tavsiyesi ne de çizgi ve okların çizilmeyeceğini unutmayın. Grafik panelinde bir sinyale tıkladığınızda açılan grafikte İç çubukları ve Flama ve Üçgen oluşumlarını gösteren çizgiler ve diğer mum desenleri için oklar çizilecektir.

Göstergeyi, tarayıcıyı etkileyebilecek başka göstergeler veya Uzman Danışmanlar olmadan temiz (boş) bir çizelgeye koymanız şiddetle tavsiye edilir.

İncelemeler 6
tunck
1204
tunck 2023.04.08 02:44 
 

SL/TP for patterns?

Kayhan
62
Kayhan 2021.09.07 16:25 
 

I was looking forward to seeing this kind of indicator. Thank you very much.

smmfx
80
smmfx 2020.11.05 16:07 
 

An amazing indicator that gives me very accurate signals based on my strategy. I thank Jan for answering my challenging questions before I buy it. The coding and details that saw looks very professional.

Önerilen ürünler
I recommend you to read the   product's blog  (manual) from start to end so that it is clear from the beginning what the indicactor offers. This multi time frame and multi symbol divergence dashboard indicator sends an alert when one or two different divergences have been identified. It can be used with all time frames from M1 to MN. Maximum 9 time frames can be shown in the dashboard at the same time. It is possible to enable moving average, RSI or Bollinger bands trend filter to filter out on
The   TradeManagerRR Visualizer MT5   is a trade management indicator designed for traders who want to easily visualize their Take Profit (TP) and Stop Loss (SL) levels on a chart. This initial version provides a simple graphical representation that displays SL and TP zones as well as the entry price. Please note that this current version focuses solely on the graphical display of SL and TP zones as figures on the chart. Current Version Features: SL and TP Zones Display:   Clear visualization of
Double Fractal Entry Bot trades automatically using fractal breakouts or rebounds. It detects precise entry points, places SL and TP based on market structure, and includes logic to manage risk and avoid false signals. Simple, smart, and powerful. This product is also available for MetaTrader 4 =>  https://www.mql5.com/en/market/product/143609 Double Fractal Entry Bot is an intelligent trading robot based on the proven logic of the Double Fractal Entry indicator. It analyzes price using upper a
Liquidity Map
Alex Amuyunzu Raymond
Liquidity Map  Overview The Liquidity Map indicator is an advanced visualization tool based on ICT Smart Money Concepts . It automatically identifies daily Buy Zones , Sell Zones , and Liquidity Levels , showing where price is likely to reverse or continue based on institutional order flow. It calculates key levels from the daily session — such as the previous day’s high, low, and midpoint — then derives a premium (sell bias) and discount (buy bias) structure. When price trades into these mapped
UTS Trading Stat
Dawid Aaron Zinserling
The UTS Trading Stat indicator, developed by Ultron Trading Solutions, is a customizable tool designed to track and display trading statistics for the current chart's symbol. It presents a visual dashboard on the chart, offering real-time insights into trading performance with a toggleable panel (STAT SHOW/STAT HIDE) for user convenience. Below is a detailed description of its features and functionality: Trading Statistics Displayed : Current Positions : Number of open profit/loss trades and tot
I recommend you to read the   product's blog  (manual) from start to end so that it is clear from the beginning what the indicactor offers. This multi time frame and multi symbol trend indicator sends an alert when a strong trend or trend reversal has been identified. It can do so by selecting to build up the dashboard using Moving average (single or double (both MA:s aligned and price above/below both)), RSI, Bollinger bands, ADX, Composite index (Constance M. Brown), Awesome (Bill Williams), 
I recommend you to read the   product's blog  (manual) from start to end so that it is clear from the beginning what the indicactor offers. This multi time frame and multi symbol indicator identifies double or triple top/bottom formations or a following neckline breakout (confirmed top/bottom). It offers RSI, pin bar, engulfing, tweezer, morning/evening star filters as well divergence filter options which makes it possible to filter out only the strongest setups. The indicator can also be used
PropTradeMaster mt5     Live signal For additional in-depth details, kindly refer to the  Manual Guide Revolutionize Your Trading with PropTradeMaster: A Precision Engineered Forex Robot Unleash the power of precision and innovation in your proprietary trading journey with PropTradeMaster, a cutting-edge Expert Advisor (EA) meticulously designed for MT4. Elevate your trading experience with this exceptional tool, tailored to exceed the stringent standards of prop trading firms. Embark on a
Utilities
Douglas Lucio De Araujo
Indicator with 3 features - Clock : Clock independent of the chart, counting continues even when the market is closed. - Template : After setting up a configuration in any graphic, be it color patterns, indicators, zoom ... The configuration will be copied to all active graphics. - TimeFrame : Set the TimeFrame on a chart, and with just one click all the active charts will be changed to the same TimeFrame.
Professional VWAP Trading System with Advanced Signal Detection Transform your trading with the most comprehensive VWAP indicator available for MetaTrader 5. Magic VWAP Key Levels Pro combines multiple timeframe analysis, intelligent signal detection, and professional-grade visualization to give you the edge in modern markets. CORE FEATURES: Multi-Timeframe VWAP Analysis Session, Weekly, and Monthly VWAP calculations Previous 10-day VWAP support/resistance Dynamic anchor periods (Session/Week/Mo
Quant Kelly Trader
Christian Alexander Foehl
Quant Kelly Trader EA, kesin piyasa yapısı sinyallerini Kelly formülüne dayalı matematiksel risk yönetimiyle birleştirir. S&P500 (US500) M15 zaman dilimi için geliştirilmiştir ve hızlı sermaye büyümesini kontrollü riskle bir araya getirir – dünyanın en büyük kuantları ve yatırımcılarının stratejilerinden esinlenmiştir. Biriktirme aşamalarına ve uyarlanmış Kelly formülüne net bir odaklanma ile bu EA, büyüme potansiyelinden yararlanmak isterken aynı zamanda riski kontrol altında tutmak isteyen tr
Smart Market Flow Detector
Victor Paul Hamilton
4 (1)
Smart Market Flow Detector (SMFD) - Professional V1.31 I CAN CONSISTENTLY GRIND MONEY FROM THIS, BE IT SCALPING OR LOWER LOTS ON LONGER TIME FRAMES. IF YOU ARE WILLING TO PUT THE WORK IN, TRADING GIVES BACK IN PROFIT WHAT YOU GIVE IN PATIENCE AND DISCIPLINE. WET DREAM 5000% PROFIT A MONTH GAMBLERS MOVE ALONG — THIS IS NOT FOR YOU. 4 Advanced Algorithms Combined Into One Powerful Indicator The Smart Market Flow Detector (SMFD) is a professional-grade Meta Trader 5 indicator that integrates four d
Aureon EA is a fully automated Expert Advisor designed for professional and high-precision trading. The core of the strategy is based on divergence analysis, one of the most accurate and reliable tools in technical analysis.The EA identifies divergences using the following indicators: RSI, Stochastic, CCI, MACD, RVI. Based on a combination of detected signals, the system decides whether to open a position. Additional filters include RSI, Bollinger Bands, and ATR for improved accuracy and market
BluePrint Adaptive Trader - Professional Trading System Advanced Channel Trading System based on our proprietary TrenderFlex PRO algorithm Learn more about TrenderFlex PRO KEY FEATURES • TrenderFlex PRO Channel Technology - Advanced channel calculation based on our proven algorithm • Adaptive Risk Management - Automatic TP/SL calculation based on channel width • Win Rate Statistics - Real-time tracking of TP1, TP2, TP3 success rates • Multi-Timeframe Analysis - Monitor 7 timeframes simultaneou
Bar Sequential
Maximiliano Frisione Figueroa
This indicator can help you clearly identify trend changes in both bullish and bearish markets. The indicator compares the closing price of the last candle with the closing price of the candle "X" periods ago (input parameter). In an uptrend, an initial number '1' is plotted if a candle closes higher than the closing of a candle "X" periods ago. In a downtrend, an initial number '1' is plotted if a candle closes below the closing of a candle "X" periods ago. Subsequent numbers are plotted when e
FREE
Moving pivot Average Fibonacci The  indicator compares the selected period with its counterpart from the previous period. The indicator determines the moving Fibonacci levels for the day or any time interval to assess the price movement range from the time average. The indicator helps predict the expected high or low for the day based on historical time data. The pivot line can be considered an average trend line and use it in a variety of trading strategies. If you have any question about the
Send me a message so I can send you the setfile Birkaç yapılandırma seçeneği bulunan sağlam robot, Aşağıdaki ekran görüntüsündeki ayarlarla 10 dakikalık bir zaman diliminde BTC ile kullanın. Uzman robotu satın aldığınızda, botu geliştirmeye devam etmek için değişiklik talep etme hakkına sahipsiniz. Temel Özellikler Hareketli Ortalama Geçiş Stratejisi: EA, işlem sinyalleri üretmek için iki hareketli ortalama (MA1 ve MA2) kullanır. Daha hızlı MA'nın (MA1) daha yavaş MA'nın (MA2) üstüne veya
# SSL ST Strategy MT5 Indicator - Turkish Version SSL ST Strategy MT5 Göstergesi, tüccarların ticaret grafiğinde alış ve satış sinyallerini açıkça tanımlamalarına yardımcı olmak için tasarlanmış bir teknik analiz aracıdır. Çizgiler ve oklar gibi görsel göstergeler, ayrıca ses, açılır pencere ve anında bildirimleri sunarak, ticaret fırsatı ortaya çıktığında tüccarları zamanında uyarır. ## Ana Avantajlar - Renkli çizgiler (SSL1 ve Baseline) ve alış sinyalleri (yeşil üçgen) ve satış sinyalleri
Tek bakışta analizini güçlendir! Bu gösterge, fiyatın yakın zamanda tepki verdiği veya kırdığı kilit seviyeleri otomatik olarak çizer ve destek/direnç bölgelerini manuel çizim yapmadan gösterir. Grafiğine eklemen yeterli; her döneme ait önceki en yüksek ve en düşük seviyeleri çizgi olarak görürsün. Her satır ne anlama geliyor? Previous Month High ‣ Geçen ayın en yüksek seviyesi: önceki aylık dönemde kaydedilen en yüksek fiyat. Previous Month Low ‣ Geçen ayın en düşük seviyesi: önceki aylık dön
KT DMA is a modified and advanced version of the classic Displaced Moving Averages with buy/sell crossover alerts and a Multi-Timeframe scanner that shows DMA's direction across each real-time time frame. A Displaced Moving Average is a simple moving average that moves ahead or backward in a time frame (either short-term or long-term). It also allows you to predict price movement more accurately. Features Depicts the trend direction using the alignment of three moving averages. Buy/Sell signals
Hydra Trend Rider is a non-repainting, multi-timeframe trend indicator that delivers precise buy/sell signals and real-time alerts for high-probability trade setups. With its color-coded trend line, customizable dashboard, and mobile notifications, it's perfect for traders seeking clarity, confidence, and consistency in trend trading. Setup & Guide:  Download  MT4 Version here. To learn how to use the Indicator: Indicator Manual & Guide -   Read Here Exclusively for you: It's your chance to st
My Point MT5
Claudia Ramona Angerer
Diagnosis of major and minor pivot Trend detection with many signals Can be used in all symbols Can be used in all time frames Settings: Back Show: The number of candles it displays If you need any adjustments, or have any questions or suggestions, message me How to trade: Blue: sell signal Red: buy signal Blue and red at the same time: no signal Exit signal: Opposite signal
Aussenstab Markttechnik
Alexander Josef Zeidler
This indicator shows external bars ("Aussenstäbe") in the chart in candle form. The colors of the candles can be set individually. Also different colors for bearish and bullish bars are possible. In addition, the color of the wicks or outlines is also adjustable. Outside bars are mentioned e.g. by Michael Voigt in the book "Das große Buch der Markttechnik". All other candles are inner bars.
Optimistic trader may enter the market when the price crosses the Aqua line. More reliable entry will be when the price crosses the Blue line. When the price comes back and crosses the Red line you can open a position in the course of price movements.
Fibonacci automatically draws Fibonacci retracement, Because Fibonacci automatically draws Fibonacci retracement, you can know at a glance the price to buy at a push or sell back. Therefore, you can trade in favorable conditions in a trending market. We are live-streaming the actual operation of the system. Please check for yourself if it is usable. Please check it out for yourself. https://www.youtube.com/@ganesha_forex We do not guarantee your investment results. Investments should be made
Product Description: Trading Vision – Automated Assistant for Forex Traders Introduction In today's financial markets, automating Forex trading is not just desirable but essential for success. The primary goal of automated trading systems like Trading Vision is to simplify the trading process by implementing advanced algorithms to analyze market trends. This allows traders to focus on strategic thinking while leaving routine operations to technology. What is Trading Vision? Trading Vision is a p
N/B: All our product purchase comes with our free ‘’DAILY   SCALPER EA’’ -   bit.ly/4qlFLNh Whatsapp Developer for yours after successful purchase PROFESSIONAL DOUBLE TOP/BOTTOM PATTERN SCANNER The Ultimate Reversal Trading System for Forex & Crypto Traders  TRANSFORM YOUR TRADING WITH INSTANT PATTERN RECOGNITION Are you tired of missing profitable reversal setups? Exhausted from staring at charts for hours, trying to spot double tops and bottoms? Frustrated with false breakouts and misse
SMARTMASS INDICATOR This indicator is different from all known volume indicators. It has a significant distinction; it is an algorithm that relates price movement to volume, attempting to find proportionality and efficient movement while filtering out noise and other movements that are more random and do not follow a trend or reversal. Ultimately, it reveals the true strength of the movement, indicating whether it has genuine support from bulls or bears or if it's merely a high-volume movement
This EA is a simple automated trading system for the Meta Trader 5 platform. It uses parabolic SAR to automatically adjust lot size based on market trends. By this, the EA does not take a large amount of risk, but instead steadily accumulates profits. Main Features The EA does not use the martingale method for lot size adjustment. If a position is taken before the forex market closes, the position will be carried over to the weekend. This EA is designed to hold multiple positions at the same t
Kill Zones MT5
Diego Arribas Lopez
MT4 Version Kill Zones Kill Zones allows you to insert up to 3 time zones in the chart. The visual representation of the Kill Zones in the chart together with an alert and notification system helps you to ignore fake trading setups occurring outside the Kill Zones or specific trading sessions. Using Kill Zones in your trading will help you filter higher probability trading setups. You should select time ranges where   the market   usually reacts with high volatility. Based on   EST time zone, fo
Bu ürünün alıcıları ayrıca şunları da satın alıyor
Bu indikatörü satın alırsanız, Profesyonel Trade Manager’ımı  + EA ÜCRETSİZ olarak alacaksınız. Öncelikle, bu Ticaret Sistemi'nin Non-Repainting, Non-Redrawing ve Non-Lagging Göstergesi olduğunu vurgulamak önemlidir, bu da hem manuel hem de robot ticareti için ideal hale getirir. Online kurs, kılavuz ve ön ayarları indir. "Smart Trend Trading System MT5", yeni ve deneyimli tüccarlar için özelleştirilmiş kapsamlı bir ticaret çözümüdür. 10'dan fazla premium göstergeyi birleştiriyor ve 7'den fazla
Divergence Bomber
Ihor Otkydach
4.9 (80)
Bu göstergeyi satın alan herkese aşağıdaki ekstra içerikler ücretsiz olarak sunulmaktadır: Her işlemi otomatik olarak yöneten, Stop Loss ve Take Profit seviyelerini ayarlayan ve işlemleri strateji kurallarına göre kapatan özel yardımcı araç: "Bomber Utility" Göstergenin farklı varlıklar üzerinde kullanılmasına yönelik ayar dosyaları (set dosyaları) Bomber Utility için 3 farklı modda kullanım sunan ayar dosyaları: "Minimum Risk", "Dengeli Risk" ve "Bekle-Gör Stratejisi" Bu ticaret stratejisini hı
SuperScalp Pro
Van Minh Nguyen
5 (1)
SuperScalp Pro – Gelişmiş Çoklu Filtreli Scalping Gösterge Sistemi SuperScalp Pro, klasik Supertrend ile çok sayıda akıllı onay filtresini birleştiren gelişmiş bir scalping gösterge sistemidir. Gösterge M1’den H4’e kadar tüm zaman dilimlerinde verimli çalışır ve özellikle XAUUSD, BTCUSD ve ana Forex pariteleri için uygundur. Bağımsız bir sistem olarak kullanılabilir veya mevcut ticaret stratejilerine esnek şekilde entegre edilebilir. Gösterge, hız ve yavaş EMA’lar, trend belirleyen üç EMA, EMA e
*** Entry In The Zone ve SMC Multi Timeframe, Smart Money Concepts (SMC) çerçevesine dayalı olarak geliştirilmiş gerçek zamanlı bir piyasa analiz aracıdır. Entry In The Zone ve SMC Multi Timeframe, yatırımcıların piyasa yapısını daha sistematik ve net bir şekilde analiz etmelerine yardımcı olmak, işlem verimliliğini artırmak ve stratejiniz için uzun vadeli sürdürülebilirlik yaratmak amacıyla geliştirilmiştir. Bu araç, Smart Money Concepts (SMC) çerçevesine dayanmaktadır. Birden fazla zaman dilim
Atomic Analyst MT5
Issam Kassas
4.19 (27)
Öncelikle belirtmek gerekir ki bu Ticaret Göstergesi Yeniden Çizim Yapmaz, Gecikmez ve Gecikme Göstermez, bu da hem manuel hem de robot ticareti için ideal hale getirir. Kullanıcı kılavuzu: ayarlar, girişler ve strateji. Atom Analisti, Piyasada Daha İyi Bir Avantaj Bulmak İçin Fiyatın Gücünü ve Momentumunu Kullanan PA Fiyat Hareketi Göstergesidir. Gürültüleri ve Yanlış Sinyalleri Kaldırmaya ve Ticaret Potansiyelini Artırmaya Yardımcı Olan Gelişmiş Filtrelerle Donatılmıştır. Birden fazla katmanl
FX Power MT5 NG
Daniel Stein
5 (30)
FX Power: Daha Akıllı Ticaret Kararları için Para Birimlerinin Gücünü Analiz Edin Genel Bakış FX Power , her piyasa koşulunda başlıca para birimlerinin ve altının gerçek gücünü anlamak için vazgeçilmez bir araçtır. Güçlü para birimlerini alıp zayıf olanları satarak, FX Power ticaret kararlarınızı basitleştirir ve yüksek olasılıklı fırsatları ortaya çıkarır. İster trendlere sadık kalın ister Delta'nın aşırı değerlerini kullanarak tersine dönüşleri öngörün, bu araç ticaret tarzınıza mükemmel bir
Azimuth Pro
Ottaviano De Cicco
5 (1)
LAUNCH PROMO Azimuth Pro price is initially set at 299$ for the first 100 buyers. Final price will be 499$ . THE DIFFERENCE BETWEEN RETAIL AND INSTITUTIONAL ENTRIES ISN'T THE INDICATOR — IT'S THE LOCATION. Most traders enter at arbitrary price levels, chasing momentum or reacting to lagging signals. Institutions wait for price to reach structured levels where supply and demand actually shift. Azimuth Pro maps these levels automatically: swing-anchored VWAP, multi-timeframe structure lines, an
Game Changer Indicator mt5
Vasiliy Strukov
4.21 (14)
Game Changer, metatrader'ınızı güçlü bir trend analiz aracına dönüştürmek için herhangi bir finansal enstrümanda kullanılmak üzere tasarlanmış devrim niteliğinde bir trend göstergesidir. Gösterge, yeniden çizim yapmaz ve gecikmez. Herhangi bir zaman diliminde çalışır ve trend tanımlamasına yardımcı olur, olası geri dönüşleri işaret eder, takip eden bir durdurma mekanizması görevi görür ve anında piyasa tepkileri için gerçek zamanlı uyarılar sağlar. İster deneyimli, ister profesyonel, ister avant
Super Signal – Skyblade Edition Profesyonel No-Repaint / Gecikmesiz Trend Sinyal Sistemi, Olağanüstü Kazanma Oranı ile | MT4 / MT5 için 1 dakika, 5 dakika ve 15 dakika gibi daha düşük zaman dilimlerinde en iyi şekilde çalışır. Temel Özellikler: Super Signal – Skyblade Edition, özellikle trend bazlı işlemler için geliştirilmiş akıllı bir sinyal sistemidir. Yalnızca güçlü, yönlü ve gerçek momentum destekli piyasa hareketlerini tespit etmek amacıyla çok katmanlı bir filtreleme yapısı kullanır.
Berma Bands
Muhammad Elbermawi
5 (7)
Berma Bantları (BB'ler) göstergesi, piyasa trendlerini belirlemeyi ve bunlardan yararlanmayı amaçlayan yatırımcılar için değerli bir araçtır. Fiyat ile BB'ler arasındaki ilişkiyi analiz ederek, yatırımcılar bir piyasanın trend veya aralıklı fazda olup olmadığını ayırt edebilir. Daha fazla bilgi edinmek için [ Berma Home Blog ] adresini ziyaret edin. Berma Bantları üç belirgin çizgiden oluşur: Üst Berma Bandı, Orta Berma Bandı ve Alt Berma Bandı. Bu çizgiler fiyatın etrafına çizilir ve genel tren
Trend Screener Pro MT5
STE S.S.COMPANY
4.84 (100)
Trend Göstergesi, Trend Alım Satım ve Filtreleme için Çığır Açan Benzersiz Çözüm, Tüm Önemli Trend Özellikleriyle Tek Bir Araç İçinde Yerleştirildi! Forex, emtialar, kripto para birimleri, endeksler ve hisse senetleri gibi tüm sembollerde/araçlarda kullanılabilen %100 yeniden boyamayan çoklu zaman çerçevesi ve Çoklu para birimi göstergesidir. Trend Screener, grafikte noktalarla ok trend sinyalleri sağlayan etkili bir trend trend göstergesidir. Trend analizörü göstergesinde bulunan özellikler: 1.
Trend Forecaster
Alexey Minkov
5 (7)
The Trend Forecaster indicator utilizes a unique proprietary algorithm to determine entry points for a breakout trading strategy. The indicator identifies price clusters, analyzes price movement near levels, and provides a signal when the price breaks through a level. The Trend Forecaster indicator is suitable for all financial assets, including currencies (Forex), metals, stocks, indices, and cryptocurrencies. You can also adjust the indicator to work on any time frames, although it is recommen
Gold Sniper Scalper Pro
Ich Khiem Nguyen
3.5 (8)
Gold Sniper Scalper Pro, trader'ların giriş noktalarını belirlemesine ve riski etkili bir şekilde yönetmesine destek olmak için tasarlanmış MetaTrader 5 için profesyonel bir göstergedir. Gösterge, sinyal tespit sistemi, otomatik Entry/SL/TP yönetimi, hacim analizi ve gerçek zamanlı performans istatistikleri içeren kapsamlı bir analiz araçları seti sunar. Sistemi anlamak için kullanım kılavuzu   |   Diğer diller için kullanım kılavuzu ANA ÖZELLİKLER Sinyal tespit sistemi Gösterge, price action a
AriX
Temirlan Kdyrkhan
1 (4)
AriX Indicator for MT5 A powerful trend-following and signal-evaluation tool AriX is a custom MT5 indicator that combines Moving Averages and ATR-based risk/reward logic to generate clear buy/sell signals. It visualizes dynamic SL/TP levels, evaluates past trade outcomes, and displays win/loss statistics in a clean on-chart panel. Key features include: Buy/Sell signals based on MA crossovers ATR-based SL/TP1/TP2/TP3 levels with visual lines and labels Signal outcome tracking with real-time stat
Öncelikle, bu Ticaret Aracının Non-Repainting, Non-Redrawing ve Non-Lagging Gösterge olduğunu vurgulamakta fayda var, bu da onu profesyonel ticaret için ideal hale getiriyor. Çevrimiçi kurs, kullanıcı kılavuzu ve demo. Akıllı Fiyat Hareketi Kavramları Göstergesi, hem yeni hem de deneyimli tüccarlar için çok güçlü bir araçtır. İleri ticaret fikirlerini, Inner Circle Trader Analizi ve Smart Money Concepts Ticaret Stratejileri gibi 20'den fazla kullanışlı göstergeyi bir araya getirerek bir araya
Advanced Supply Demand MT5
Bernhard Schweigert
4.5 (14)
Herhangi bir Acemi veya Uzman Tüccar için En İyi Çözüm! Bu gösterge benzersiz, yüksek kaliteli ve uygun fiyatlı bir ticaret aracıdır çünkü bir dizi tescilli özelliği ve yeni bir formülü bir araya getirdik. Bu güncelleme ile çift zaman dilimi dilimlerini gösterebileceksiniz. Yalnızca daha yüksek bir TF gösteremeyeceksiniz, aynı zamanda TF grafiğini ve ARTIK daha yüksek TF'yi de gösterebileceksiniz: YUVARLAK BÖLGELERİ GÖSTERMEK. Tüm Arz Talebi tüccarları buna bayılacak. :) Önemli Bilgiler Açıkland
ARICoins
Temirlan Kdyrkhan
ARICoin is a powerful trading companion designed to generate high-probability entry signals with dynamic TP/SL/DP levels based on volatility. Built-in performance tracking shows win/loss stats, PP1/PP2 hits, and success rates all updated live. Key Features: Buy/Sell signals with adaptive volatility bands Real-time TP/SL/DP levels based on ATR Built-in MA Filter with optional ATR/StdDev volatility Performance stats panel (Success, Profit/Loss, PP1/PP2) Alerts via popup, sound, push, or email Cust
ARIScalping
Temirlan Kdyrkhan
ARIScalp is a powerful trading companion designed to generate high-probability entry signals with dynamic TP/SL/DP levels based on volatility. Built-in performance tracking shows win/loss stats, PP1/PP2 hits, and success rates all updated live. Key Features: Buy/Sell signals with adaptive volatility bands Real-time TP/SL/DP levels based on ATR Built-in MA Filter with optional ATR/StdDev volatility Performance stats panel (Success, Profit/Loss, PP1/PP2) Alerts via popup, sound, push, or email Cus
TPSproTREND PrO MT5
Roman Podpora
4.74 (19)
TPSproTrend PRO, piyasanın yön değiştirdiği anı belirler ve hareketin başlangıcında bir giriş noktası oluşturur. Piyasaya, fiyat hareketi henüz yeni başladığı anda girersiniz, hareket gerçekleştikten sonra değil.   Gösterge       Sinyalleri yeniden çizmez ve giriş noktalarını, Zarar Durdurma ve Kar Al seviyelerini otomatik olarak göstererek alım satımı net, görsel ve yapılandırılmış hale getirir. RUSÇA TALİMATLAR   -   MT4 SÜRÜMÜ Başlıca avantajlar Yeniden çizim yapılmadan sinyaller.   Tüm sinya
Protect against whipsaws: revolutionize your swing trading approach Swing Trading is the first indicator designed to detect swings in the direction of the trend and possible reversal swings. It uses the baseline swing trading approach, widely described in trading literature. The indicator studies several price and time vectors to track the aggregate trend direction and detects situations in which the market is oversold or overbought and ready to correct. [ Installation Guide | Update Guide | Tro
ÜCRETSİZ AUX Göstergesi ve EA Desteğini Alın  Doğrudan indirme — Buraya tıklayın [ D.I.C.E ] The DICE Indicator  Divergence in Chaos Environment, Elliott Dalga Teorisi’ni Trading Chaos teknikleriyle birleştiren trader’lar için geliştirilmiş özel bir MT5 aracıdır. Bill Williams’ın tanımladığı kaotik piyasa ortamıyla senkronize olarak fiyat hareketlerindeki gizli ve normal uyumsuzlukları tespit eder. Ana Özellikler Elliott Dalgası Uyumlu Uyumsuzluk: Dalga yapılarıyla uyumlu boğa ve ayı uyumsuzluk
Grabber System MT5
Ihor Otkydach
4.82 (22)
Size mükemmel bir teknik gösterge olan Grabber’ı tanıtıyorum. Bu araç, kullanıma hazır bir “her şey dahil” işlem stratejisi olarak çalışır. Tek bir yazılım kodu içinde güçlü piyasa teknik analiz araçları, işlem sinyalleri (oklar), uyarı işlevleri ve push bildirimleri entegre edilmiştir. Bu göstergeyi satın alan herkes aşağıdaki hediyeleri ücretsiz olarak alır: Açık emirleri otomatik yönetmek için Grabber Yardımcı Aracı Kurulum, yapılandırma ve nasıl işlem yapılacağını adım adım anlatan video kıl
Trend indicator AI mt5
Ramil Minniakhmetov
5 (13)
Trend Ai göstergesi, trend tanımlamasını işlem yapılabilir giriş noktaları ve geri dönüş uyarılarıyla birleştirerek bir yatırımcının piyasa analizini geliştirecek harika bir araçtır. Bu gösterge, kullanıcıların forex piyasasının karmaşıklıklarında güvenle ve hassasiyetle yol almalarını sağlar. Birincil sinyallerin ötesinde, Trend Ai göstergesi geri çekilmeler veya düzeltmeler sırasında ortaya çıkan ikincil giriş noktalarını belirleyerek, yatırımcıların belirlenen trend içindeki fiyat düzeltmele
Golden Spike Premium
Kwaku Bondzie Ghartey
5 (1)
Golden Spikes Indicator Technical indicator for synthetic indices trading on M1 timeframe. Compatible with Boom/Crash indices on Deriv platform and Gain/Pain indices on Weltrade platform. send me A private  message to receive trade ASISTANT EA.. booklet guide:  https://drive.google.com/file/d/1knQJqGHZSP5eQN24ndRz2ayZVCst6XhN/view?usp=sharing Also check my premium spikes bot: https://www.mql5.com/en/market/product/142350 Features Uses Parabolic SAR, RSI, and Bollinger Bands analysis Three risk
The Super Arrow Indicator provides non-repainting buy and sell signals with exceptional accuracy. Key Features No repainting – confirmed signals remain fixed Clear visual arrows: green for buy, red for sell Real-time alerts via pop-up, sound, and optional email Clean chart view with no unnecessary clutter Works on all markets: Forex, gold, oil, indices, crypto Adjustable Parameters TimeFrame Default:   "current time frame" Function:   Sets the time frame for indicator calculation Options:   Can
TrendLine PRO MT5
Evgenii Aksenov
4.67 (33)
Trend Line PRO   göstergesi bağımsız bir işlem stratejisidir. Trend değişimini, işleme giriş noktasını gösterir ve ayrıca üç seviyede Kar Al ve Zarar Durdur korumasını otomatik olarak hesaplar. Trend Line PRO , tüm Meta Trader sembolleri için mükemmeldir: para birimleri, metaller, kripto para birimleri, hisse senetleri ve endeksler. Gösterge, gerçek hesaplarda işlem yaparken kullanılır ve bu da stratejinin güvenilirliğini doğrular. Trend Line PRO   ve gerçek Sinyal kullanan robotlar burada bu
Blahtech Supply Demand MT5
Blahtech Limited
4.54 (13)
Was: $299  Now: $99  Supply Demand uses previous price action to identify potential imbalances between buyers and sellers. The key is to identify the better odds zones, not just the untouched ones. Blahtech Supply Demand indicator delivers functionality previously unavailable on any trading platform. This 4-in-1 indicator not only highlights the higher probability zones using a multi-criteria strength engine, but also combines it with multi-timeframe trend analysis, previously confirmed swings a
Support And Resistance Screener, MetaTrader için tek bir gösterge içinde birden fazla araç sağlayan tek bir Düzey göstergesindedir. Kullanılabilir araçlar şunlardır: 1. Piyasa Yapısı Eleme Aracı. 2. Geri Çekilme Bölgesi Boğa. 3. Geri Çekilme Bölgesi Ayı. 4. Günlük Pivot Noktaları 5. haftalık Pivot Noktaları 6. aylık Pivot Puanları 7. Harmonik Modele ve hacme dayalı Güçlü Destek ve Direnç. 8. Banka Seviyesi Bölgeleri. SINIRLI SÜRELİ TEKLİF : YG Destek ve Direnç Göstergesi sadece 50 $ ve ömür boyu
WVAP Scalping
Domantas Juodenis
VWAP Scalping Pro – Advanced VWAP & Market Profile System Professional-Grade VWAP + Market Profile Technology for Precision Trading VWAP Scalping Pro is an advanced analytical tool that integrates Volume-Weighted Average Price (VWAP) analysis with professional Market Profile visualization. It provides traders with institutional-style insights into price structure, volume distribution, and session dynamics — ideal for scalping, intraday, and swing trading strategies. Key Features Triple VWAP St
MetaForecast M5
Vahidreza Heidar Gholami
5 (3)
MetaForecast, fiyat verilerindeki harmonileri kullanarak herhangi bir piyasanın geleceğini tahmin eder ve görselleştirir. Piyasa her zaman tahmin edilemezken, fiyatlarda bir desen varsa, MetaForecast geleceği mümkün olduğunca doğru bir şekilde tahmin edebilir. Benzer ürünlere göre, MetaForecast piyasa eğilimlerini analiz ederek daha kesin sonuçlar üretebilir. Giriş Parametreleri Past size (Geçmiş boyut) MetaForecast'ın gelecekteki tahminler oluşturmak için kullandığı çubuk sayısını belirtir. Mo
Yazarın diğer ürünleri
The indicator identifies when a divergence occurs between price and an indicator or oscillator. It identifies both regular and hidden divergences. Combined with your own rules and techniques, this indicator will allow you to create (or enhance) your own powerful system. For higher probability setups I can recommend you to use my Supply Demand indicator and trade only if the divergence occurs inside a zone. Supply zone for bearish div and demand zone for bullish div. The optimal scenario is if it
FREE
Bu gösterge, grafikte arz ve talep bölgeleri çizer. Kendi kurallarınız ve tekniklerinizle birleştiğinde, bu gösterge kendi güçlü sisteminizi yaratmanıza (veya geliştirmenize) olanak tanır. Lütfen çok daha fazlasını sunan   ücretli sürümü   de inceleyin. Tavsiyem, ilk bölge testinin en az 25 bardan sonra gerçekleştiği işlem fırsatlarını aramanızdır. Özellikler Bölgeler 3 renge sahiptir (girişle ayarlanabilir). Test edilmemiş bölge için koyu renk, test edilmiş bölge için orta renk   ve bozuk bölge
FREE
Gösterge, fiyat ile bir osilatör/gösterge arasında ne zaman bir farklılık oluştuğunu tanımlar. Hem düzenli hem de gizli sapmaları tanımlar. Yalnızca en güçlü kurulumları filtrelemeyi mümkün kılan bir RSI filtre seçeneğine sahiptir. Gösterge ayrıca bir Yutan formasyonu, Donchian kanalının kırılmasını veya fiyatın hareketli bir ortalamayı geçmesini beklemek için seçenekler sunar   (bkz. ekran görüntüsü # 3)       ticaret fırsatının sinyalini vermeden önce farklılığı doğrulamak için. Kendi kurallar
I recommend you to read the   product's blog  (manual) from start to end so that it is clear from the beginning what the indicactor offers. This multi time frame and multi symbol indicator identifies double or triple top/bottom formations or a following neckline breakout (confirmed top/bottom). It offers RSI, pin bar, engulfing, tweezer, morning/evening star filters as well divergence filter options which makes it possible to filter out only the strongest setups. The indicator can also be used
This indicator can send alerts when a Heiken Ashi Smoothed color change occurs. Combined with your own rules and techniques, this indicator will allow you to create (or enhance) your own powerful system. Features Can send all types of alerts. Option to delay the alert one or more bars in order to confirm the color (trend) change. Input parameters Candle shift for alert: Default is 1. Setting it to 0 will alert you on color change on the current candle. This should be regarded as a pending (uncon
FREE
I recommend you to read the   product's blog  (manual) from start to end so that it is clear from the beginning what the indicactor offers. This multi time frame and multi symbol divergence dashboard indicator sends an alert when one or two different divergences have been identified. It can be used with all time frames from M1 to MN. Maximum 9 time frames can be shown in the dashboard at the same time. It is possible to enable moving average, RSI or Bollinger bands trend filter to filter out on
Bu gösterge, grafikte arz ve talep bölgeleri çizer. Kendi kurallarınız ve tekniklerinizle birleştiğinde, bu gösterge kendi güçlü sisteminizi yaratmanıza (veya geliştirmenize) olanak tanır. Lütfen çok daha fazlasını sunan   ücretli sürümü   de inceleyin. Tavsiyem, ilk bölge testinin en az 25 bardan sonra gerçekleştiği işlem fırsatlarını aramanızdır. Özellikler Bölgeler 3 renge sahiptir (girişle ayarlanabilir). Test edilmemiş bölge için koyu renk, test edilmiş bölge için orta renk   ve bozuk bölge
FREE
The indicator identifies when a divergence occurs between price and an indicator or oscillator. It identifies bullish and bearish hidden or regular (classical) divergences. Combined with your own rules and techniques, this indicator will allow you to create (or enhance) your own powerful system. For higher probability setups I can recommend you to use my  Supply Demand indicator  and trade only if the divergence occurs inside a zone. Supply zone for bearish div and demand zone for bullish div. T
FREE
This indicator recognizes a special type of Inside Bar formation which is formed by a big Master candle followed by 4 smaller candles (please see the strategy explanation below). Features Plots buy/sell stop lines on the chart as well as well as take profit and stop loss levels. The TP/SL levels are based on the Average True Range (ATR) indicator. Object colors are changeable. Sends you a real-time alert when a Master candle formation is identified - sound / popup / email / push notification. On
Lütfen mümkünse satın almayı düşünün       Geliştirmeye devam edeceğim   MT5 sürümü   (bu MT4 sürümü için gelecekte güncelleme olmayacak). Ayrıca okumanızı tavsiye ederim       Baştan sona   ürün blogu   (kılavuz) böylece EA'nın ne sunduğu baştan belli olur. Bu Uzman danışmanın (EA) ana stratejisi, 3 hareketli ortalama (MA) ardışık hizada ve birbirinden belirli bir mesafede olduğunda alım satım yapmaktır (örneğin, bazı kurumsal tüccarlar tarafından kullanılan çok iyi bilinmeyen bir strateji içi
This indicator can send alerts when a Heiken Ashi Smoothed color change occurs. Combined with your own rules and techniques, this indicator will allow you to create (or enhance) your own powerful system. Features Can send all types of alerts. Option to delay the alert one bar in order to confirm the color (trend) change. Input parameters Wait for candle close: 'true' or 'false'. Setting it to 'true' will delay the alert to the opening of the bar following the bar where the color change occurred.
FREE
Bu arz ve talep bölgesi göstergesi, grafikteki bölgeleri çizer ve fiyat bir bölgeye ulaştığında veya bir bölgeyi kırdığında uyarılar gönderir. Bölgeler yerine normal çift tepeler/dipler hakkında uyarı almak için de kullanmak mümkündür. Yalnızca en güçlü kurulumları filtrelemek için RSI, hacim ve sapma filtrelerini kullanmak mümkündür. Kendi kurallarınız ve tekniklerinizle birlikte bu gösterge, kendi güçlü sisteminizi oluşturmanıza (veya geliştirmenize) izin verecektir. Bu gösterge, Arz Talebine
okumanı tavsiye ederim       ürünün blogu   (kılavuz) baştan sona böylece       EA'nın ne sunduğu en başından belli. Bu Uzman danışmanın (EA) ana stratejisi, 3 hareketli ortalama (MA) ardışık hizada ve birbirinden belirli bir mesafede olduğunda alım satım yapmaktır (örneğin, bazı kurumsal tüccarlar tarafından kullanılan çok iyi bilinmeyen bir strateji için kullanılabilir) , D1 zaman çerçevesindeki MA 10, 20 ve 30'u içerir). EA en iyi H1 ve daha büyük zaman dilimlerinde çalışır. Üçlü MA strateji
I recommend you to read the   product's blog  (manual) from start to end so that   it is clear from the beginning what the indicator offers. This multi oscillator, multi time frame and multi symbol indicator identifies when a divergence occurs between price and an oscillator/indicator. It identifies both regular/classical (trend reversal) and hidden (trend continuation) divergences. It has moving average, RSI/Bollinger, ADX, pin bar and engulfing filter options which makes it possible to filter
This multi indicator/oscillator (hereafter indicator), multi time frame and multi symbol indicator identifies when a divergence occurs between price and one, two or three indicators. It identifies both regular/classical (trend reversal) and hidden (trend continuation) divergences. It has RSI and MA trend filter options which makes it possible to filter out only the strongest setups. Combined with your own rules and techniques, this indicator will allow you to create (or enhance) your own powerfu
I recommend you to read the   product's blog  (manual) from start to end so that it is clear from the beginning what the indicactor offers. This indicator for Metatrader 4 identifies when a divergence occurs between price and an oscillator/indicator. It identifies both bullish and bearish divergences. It has a RSI filter option which makes it possible to filter out only the strongest setups. The indicator also offers options to wait for an Engulfing formation, Donchian channel breakout or for p
I  recommend you to read the   product's blog  (manual) from start to end so that it is clear from the beginning what the indicator offers. This multi time frame and multi symbol indicator identifies double top/bottom, head & shoulders, pennant/triangle and flag patterns. It is also possible to setup alerts only when a neckline/triangle/flagpole breakout has occured (neckline breakout = confirmed signal for top/bottoms and head & shoulders).  The indicator can also be used in single chart mode.
Okumanızı tavsiye ederim       Ürünün blogunu   (kılavuzunu) en baştan sona okuyun, böylece göstergenin ne sunduğu en baştan itibaren açıkça anlaşılsın. Bu çoklu zaman dilimi ve çoklu sembol göstergesi pin çubuklarını tarar. Kendi kurallarınız ve tekniklerinizle birleştiğinde, bu gösterge kendi güçlü sisteminizi yaratmanıza (veya geliştirmenize) olanak tanır. Özellikler Market Watch pencerenizde görünen tüm sembolleri aynı anda izleyebilirsiniz. Göstergeyi sadece bir grafiğe uygulayın ve tüm pi
I  recommend you to read the   product's blog  (manual) from start to end so that it is clear from the beginning what the indicator offers. This multi time frame and multi symbol indicator scans for engulfing and tweezer formations. The indicator can also be used in single chart mode. Combined with your own rules and techniques, this indicator will allow you to create (or enhance) your own powerful system. Features Can monitor all symbols visible in your Market Watch window at the same time. Ap
This multi time frame and multi symbol indicator identifies high-probability breakout patterns. It does this by identifying strong, symmetrical pennants and triangles. This pattern DOES NOT appear very often on higher time frames. But when it does, it is a very high-probability setup. The indicator also includes an Inside bars scanner. It can for example be used to detect a special type of Inside bars formation which is formed by a Master candle (MC) followed by 4 inside candles (please see the
Features This is an indicator that recognizes a special type of Inside Bar formation which is formed by a Master candle followed by 4 smaller candles (please see the strategy explanation below). Plots buy/sell stop lines on the chart as well as well as take profit and stop loss levels. The TP/SL levels are based on the Average True Range (ATR) indicator. Object colors are changeable. Sends you a real-time alert when a Master candle formation is identified - sound / pop-up / email / push notifica
This multi time frame and multi symbol indicator scans for Pin bars, Morning/Evening stars, Engulfings, Tweezers, Three line strikes, Inside bars and Pennants and Triangles. The indicator can also be used in single chart mode. Please read more about this option in the product's blog . Combined with your own rules and techniques, this indicator will allow you to create (or enhance) your own powerful system. Features Can monitor all symbols visible in your Market Watch window at the same time. App
I  recommend you to read the   product's blog  (manual) from start to end so that it is clear from the beginning what the indicator offers. This multi symbol and multi time frame indicator scans for the following candlestick patterns (please see screenshot for explanation of the patterns): Three white soldiers (reversal>continuation pattern) Three black crows (reversal>continuation pattern) Bullish and bearish Three line strike (reversal pattern) The patterns do not appear very often on higher
I recommend you to read the   product's blog  (manual) from start to end so that it is clear from the beginning what the indicactor offers. This multi time frame and multi symbol indicator can identify the following 5 crosses: when a fast moving average crosses a slow moving average line. when price has reached a single moving average (closed above/below or just bounced). when a triple moving average formation has appeared (all 3 MA:s in consecutive alignment). when the MACD main line crosses t
I recommend you to read the   product's blog  (manual) from start to end so that it is clear from the beginning what the indicactor offers. This multi time frame and multi symbol indicator identifies double or triple top/bottom formations or a following neckline breakout (confirmed top/bottom). It offers filters for RSI overbought/oversold, candle patterns (pin bar, engulfing, tweezer, morning/evening star, three line strike) and divergences (MACD, OsMA, Awesome (AO), RSI, CCI, Stochastic) whic
This multi indicator/oscillator (hereafter indicator), multi time frame and multi symbol indicator identifies when a divergence occurs between price and one, two or three indicators. It identifies both regular/classical (trend reversal) and hidden (trend continuation) divergences. It has RSI and MA trend filter options which makes it possible to filter out only the strongest setups. Combined with your own rules and techniques, this indicator will allow you to create (or enhance) your own powerfu
This multi time frame and multi symbol indicator identifies when the stochastics signal line (D) crosses the stochastics main line (K) as well as options  to scan for main line and signal line level crossovers.  As a bonus it can also scan for Bollinger bands and RSI overbought/oversold crosses. Combined with your own rules and techniques, this indicator will allow you to create (or enhance) your own powerful system. Features Can monitor all symbols visible in your Market Watch window at the sam
This cost averaging Expert advisor (EA) places additional trades in the same direction as the original (manually opened) order when the price goes against you. It can be used as a grid system or as pure martingale system (exponential increasing of lot size) or smoothed martingale (for instance linear increasing of the lot size). Due to the risk involved, this EA is more suitable for intermediate to advanced traders who are well aware of how to handle risk management and trading an already profit
I recommend you to read the   product's blog  (manual) from start to end so that it is clear from the beginning what the indicactor offers. This multi time frame and multi symbol trend indicator sends an alert when a strong trend or trend reversal has been identified. It can do so by selecting to build up the dashboard using Moving average (single or double ( both MA:s aligned and price above/below both ) ), RSI, Bollinger bands, ADX, Composite index, Parabolic SAR, Awesome (AO), MACD (signal l
I recommend you to read the   product's blog  (manual) from start to end so that it is clear from the beginning what the indicactor offers. This multi time frame and multi symbol divergence dashboard indicator sends an alert when one or two different divergences have been identified. It can be used with all time frames from M1 to MN. It is possible to enable moving average or RSI trend filter to filter out only the strongest setups. It should be combined with your own confirmation rules, techni
Filtrele:
tunck
1204
tunck 2023.04.08 02:44 
 

SL/TP for patterns?

Jan Flodin
139140
Geliştiriciden yanıt Jan Flodin 2023.04.08 13:45
Hello and many thanks for the review :-)
Engulfing, Tweezer and Three line strike:
The entry is typically at the high/low of the pattern. SL and risk level for trading can be placed at the swing high/low of the pattern. This makes it relatively easy for traders to target (TP) at least twice the distance of their stop loss, creating a 1:2 risk-to-reward ratio.
Pin bar:
Entry on break of pin bar high/low. SL at pin bar low/high. TP at previous swing point. For this purpose you can use Donchian channel (highest/lowest of last 20 bars). Please make sure that it will give at least R/R (risk/reward) of 1:2).
Inside bars and Pennants/triangles:
Will need to attach a document which is not possible here. I will send you a private message on MQL5 as soon as you have approved my Friends request (you have blocked sending private messages from non friends)
Kayhan
62
Kayhan 2021.09.07 16:25 
 

I was looking forward to seeing this kind of indicator. Thank you very much.

Delboyuk
81
Delboyuk 2020.12.29 18:22 
 

Kullanıcı incelemeye herhangi bir yorum bırakmadı

smmfx
80
smmfx 2020.11.05 16:07 
 

An amazing indicator that gives me very accurate signals based on my strategy. I thank Jan for answering my challenging questions before I buy it. The coding and details that saw looks very professional.

Thomas
84
Thomas 2019.07.10 11:22 
 

Perfect. Get really good Signals. Thx Jan again.

Devonish
3254
Devonish 2018.11.21 20:23 
 

I've just rented this for a month and initial impressions are good. Its quite likely I may go on to purchase as scanning all assets on all time frames is not practical. It will be used to support existing strategies. The only reason its not 5 star is having the candle/s highlighted on the chart would be nice, but I accept its not possible.

June 2019 Update: I purchased this product and have been using it for six months. It compliments my strategies very well. Upgraded to 5 stars.

İncelemeye yanıt