MA on MA on MA
- Indikatoren
- Version: 4.6
- Aktualisiert: 20 November 2021
- Aktivierungen: 5

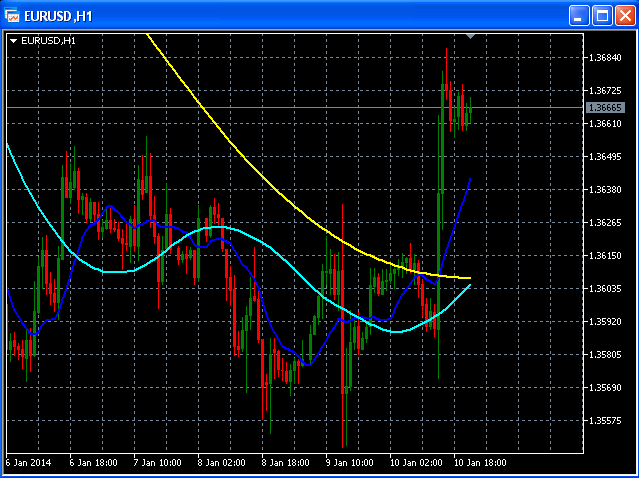
Dieser Indikator zeigt eine Hauptlinie des Gleitenden Durchschnitts mit den Eingabeparametern nPeriod, nMethod und nPrice an.
Die zweite Linie wird als gleitender Durchschnitt aus den Daten der ersten Linie berechnet, zusätzlich hat sie die Parameter nPeriod_2 und nMethod_2.
Die dritte Zeile wird als gleitender Durchschnitt aus den Daten der zweiten Zeile berechnet, zusätzlich hat sie die Parameter nPeriod_3 und nMethod_3.