TSO Adaptive Moving Average
- Indikatoren
-
Dionisis Nikolopoulos
 We are a small team of individuals with a strong passion for trading.
Our research is focused in the area of trading methods and mechanical trading systems
developed on the MT4 and MT5 trading platforms.
Many more features will be coming in the future, so stay with us! - Version: 1.0
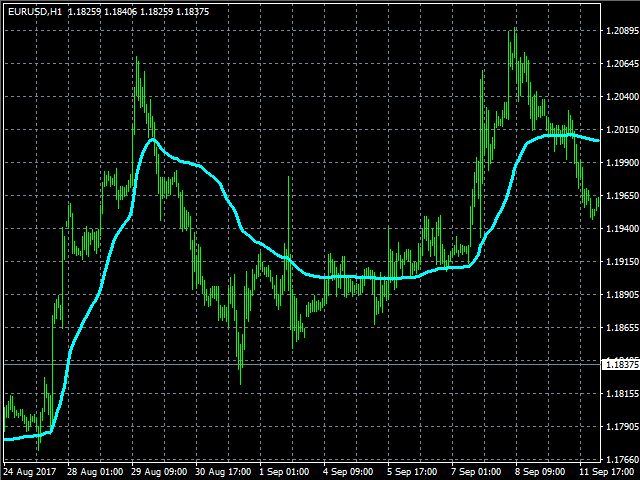
Der von Perry Kaufman entwickelte Adaptive Moving Average (AMA) ist eine Variante des gleitenden Durchschnitts, die eine geringe Empfindlichkeit gegenüber Marktstörungen und Volatilität sowie eine minimale Verzögerung bei der Trenderkennung aufweist. Diese Eigenschaften machen ihn zum idealen Instrument für die Erkennung des allgemeinen Markttrends, für das Erkennen von Wendepunkten und für das Filtern von Kursbewegungen. Eine detaillierte Analyse der Berechnungen zur Bestimmung des AMA finden Sie in der MetaTrader 5 Hilfe(https://www.metatrader5.com/en/terminal/help/indicators/trend_indicators/ama)
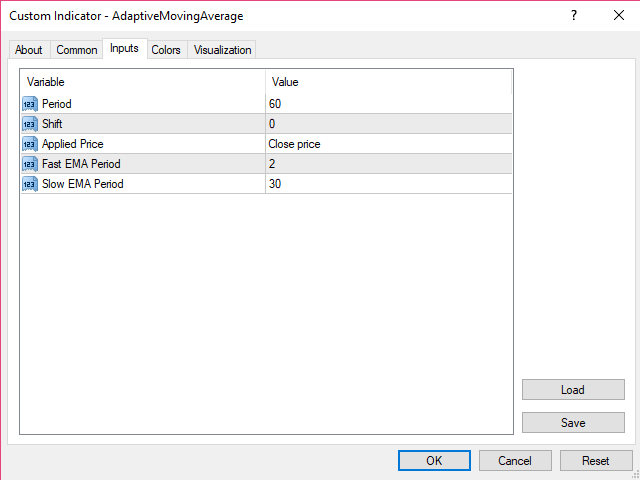
Eingaben
- Zeitraum: Die Preisperiode, die zur Berechnung des Adaptiven Gleitenden Durchschnitts verwendet wird.
- Verschiebung: Die Anzahl der Perioden, um die der AMA relativ zum Kurschart verschoben wird.
- Angewandter Preis: Der Preis der Kerze, auf dem die AMA-Berechnungen basieren sollen. In der Regel wird der Schlusskurs verwendet.
- Schnelle EMA-Periode: Die Periode des schnellen Exponential Moving Average.
- Langsamer EMA-Zeitraum: Die Periode des langsamen Exponential Moving Average.
Für EA-Entwickler
- AMA-Wert: Puffer = 0