TSO Stochastic RSI
- Indikatoren
-
Dionisis Nikolopoulos
 We are a small team of individuals with a strong passion for trading.
Our research is focused in the area of trading methods and mechanical trading systems
developed on the MT4 and MT5 trading platforms.
Many more features will be coming in the future, so stay with us! - Version: 1.15
- Aktualisiert: 29 Juni 2019
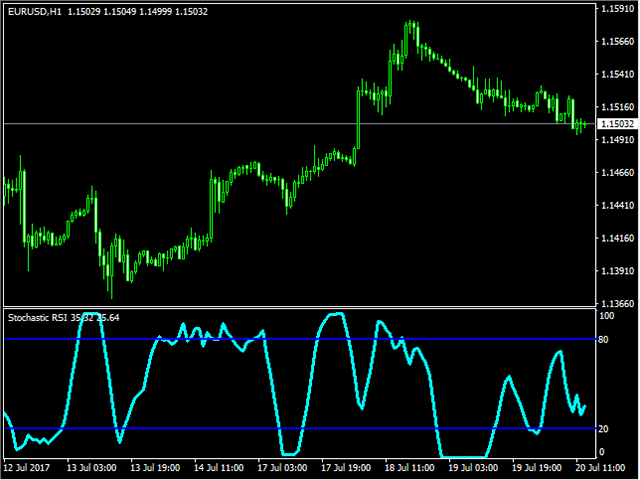
Stochastic RSI führt eine stochastische Berechnung auf der Grundlage des RSI-Indikators durch. Der Relative Strength Index (RSI) ist ein bekannter Momentum-Oszillator, der die Geschwindigkeit und Veränderung von Kursbewegungen misst und von J. Welles Wilder entwickelt wurde.
Merkmale
- Finden Sie überkaufte und überverkaufte Situationen.
- Warnton, wenn das überkaufte/überverkaufte Niveau erreicht ist.
- Erhalten Sie E-Mail- und/oder Push-Benachrichtigungen, wenn ein Signal erkannt wird.
- Der Indikator wird nicht neu gemalt.
- Gibt Pufferwerte für %K und %D zurück, die als Teil eines EAs verwendet werden können (siehe unten).
Grundlegende Strategie
- Suchen Sie nach Shorts, wenn der Kurs über die obere Grenze steigt.
- Suchen Sie nach Long-Positionen, wenn der Kurs unter die untere Begrenzung fällt.
Eingaben
- RSI-Periode: Normalerweise auf 14 eingestellt
- %K-Periode: Typischerweise auf 8 eingestellt
- %K Glättungsperiode: Setzen Sie den Wert auf 1 für die standardmäßige %K-Berechnung. Stellen Sie einen höheren Wert ein, um %K mit einem gleitenden X-Perioden-Durchschnitt (SMA) zu glätten. Dies wirkt sich auch auf %D aus, da es der SMA von %K ist.
- %D-Periode: Normalerweise auf 5 eingestellt
Für EA-Entwickler
Der Indikator kann leicht als Teil eines EAs verwendet werden.
- Puffer für %D-Wert = 0
- Puffer für den %K-Wert = 1


I too used this indicator, and I Love it! Can´t thank you enough for sharing it with us.But, Can you tell me if there is any way of getting the "source code"(MQL File) for it?