TSO Total Top Bottom Divergence
- Indikatoren
-
Dionisis Nikolopoulos
 We are a small team of individuals with a strong passion for trading.
Our research is focused in the area of trading methods and mechanical trading systems
developed on the MT4 and MT5 trading platforms.
Many more features will be coming in the future, so stay with us! - Version: 2.0
- Aktualisiert: 24 Dezember 2020
- Aktivierungen: 10
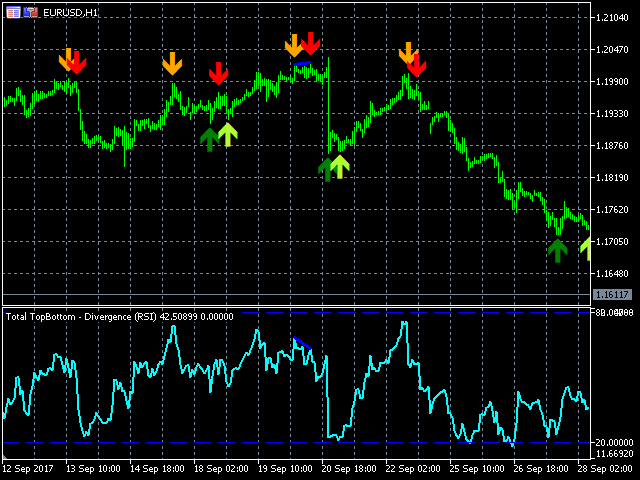
Ein unverzichtbares Tool für jede Strategie, die auf der Erkennung von Divergenzen basiert. 10 verschiedene Oszillatoren können zur Erkennung von Divergenzen verwendet und mit Double Top/Bottom-Mustern kombiniert werden, um Umkehrsignale zu bestätigen.
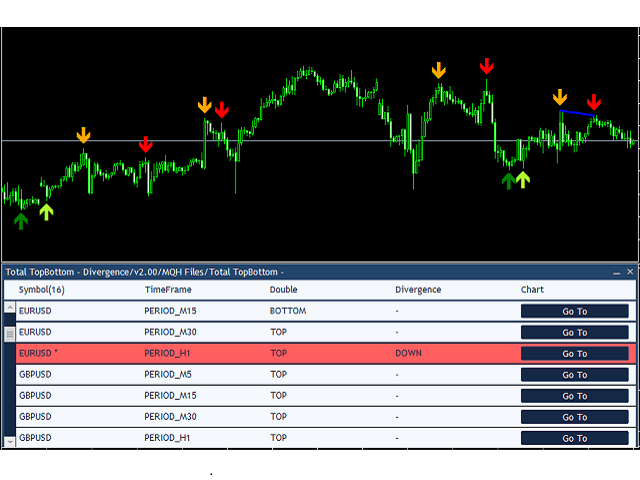
SCANNER ist enthalten. Mit dem Scanner können Sie jetzt einfacher und schneller Handelsmöglichkeiten und Setups finden.
Merkmale
- Einfaches Erkennen starker Umkehrsignale.
- 10 verschiedene Oszillatoren stehen für die Erkennung von Divergenzen zur Verfügung.
- Divergenz- und Top/Bottom-Erkennung können unabhängig voneinander oder kombiniert eingesetzt werden.
- Erhalten Sie E-Mail-/Push-Benachrichtigungen, wenn eine Divergenz erkannt wird.
- Der Indikator wird nicht neu gezeichnet.
- Kann leicht in einem EA verwendet werden (siehe Für Entwickler).
Verfügbare Oszillatoren für die Divergenzerfassung
- Relative Stärke Index (RSI).
- Rohstoff-Kanal-Index (CCI).
- Chaikin-Oszillator (CHO).
- Chande Momentum Oszillator (CMO).
- Gleitender Durchschnitt Konvergenz Divergenz (MACD).
- Momentum.
- Stochastik.
- Stochastischer RSI.
- Relativer Vigor-Index (RVI).
- Änderungsrate (ROC).
Eingaben
- Name: Der Name, der in den Klammern in der oberen linken Ecke des Oszillatorfensters erscheinen soll.
- Doppeltes Oben - Unten AKTIVIEREN: Aktivieren Sie den doppelten Top-Bottom-Indikator.
- Divergenz-Oszillator auswählen: Wählen Sie einen der verfügbaren Divergenzindikatoren oder deaktivieren Sie die Divergenzerfassung.
- Beziehung zwischen Double Top-Bottom und RSI-Divergenz:
- Kombiniert: Alle Double Top-Bottom-Signale werden angezeigt, aber nur die RSI-Divergenzsignale, die mit Double Top-Bottom-Signalen korrespondieren, werden angezeigt. Sowohl Double Top - Bottom als auch RSI Divergence Indikatoren sollten aktiviert sein.
- Unabhängig: Jeder Indikator zeigt seine Signale unabhängig an.
- Anzahl der Balken (ungerade Anzahl) [wirkt sich nur auf die Divergenz aus]: Dies ist die Anzahl der Balken, die erforderlich sind, um ein Kurshoch oder -tief zu erkennen, einschließlich des oberen/unteren Balkens. Wird beispielsweise der Wert 5 eingestellt, werden Kurs-Hochs bei Takten erkannt, deren Hoch höher ist als das Hoch der ersten beiden Takte links und rechts davon. Wenn der RSI Divergence unabhängig verwendet wird, nutzt er diesen Mechanismus, um Hochs und Tiefs zu erkennen. Andernfalls werden Hochs und Tiefs durch den Indikator Double Top/Bottom erkannt.
Die folgenden Eingaben sind in Gruppen unterteilt, die sich auf jeden der verfügbaren Oszillatoren beziehen. Nur die Eingaben, die sich auf den im Feld Divergenz-Oszillator auswählen ausgewählten Indikator beziehen, müssen angepasst werden.
- RSI Zeitraum.
- RSI Angewandter Kurs: Der Barpreis, der für die RSI-Berechnungen verwendet wird.
- CCI Zeitraum.
- CCI Angewandter Preis: Der Barpreis, der für CCI-Berechnungen verwendet wird.
- CHO Schnelle Periode: Legen Sie die schnelle Periode des CHO fest.
- CHO Langsamer Zeitraum: Legen Sie die langsame Periode des CHO fest.
- CHO-Methode: Legen Sie die Methode zur Berechnung der CHO fest.
- CHO Angewandtes Volumen: Das Volumen, das für CHO-Berechnungen verwendet werden soll. (Verwenden Sie das reale Volumen nur, wenn es verfügbar ist, z. B. bei Aktien, und das Tick-Volumen, wenn das reale Volumen nicht verfügbar ist, z. B. bei FOREX).
- CMO-Periode.
- MACD Schnelle Periode: Legen Sie die schnelle Periode des MACD fest.
- MACD Langsam Periode: Legen Sie die langsame Periode des MACD fest.
- MACD-Signal-Periode: Legen Sie die Periode für das MACD-Signal fest.
- MACD Angewandter Preis: Der Barpreis, der für die MACD-Berechnungen verwendet wird.
- Momentum-Periode.
- Momentum Angewandter Preis: Der Barpreis, der für Momentum-Berechnungen verwendet wird.
- Stochastik %K Zeitraum: Legen Sie den Zeitraum für die Berechnung von %K des Stochastik-Oszillators fest.
- Stochastik %D Zeitraum: Legen Sie den Zeitraum für die Berechnung von %D des stochastischen Oszillators fest.
- Stochastische Verlangsamung: Stellen Sie die interne Glättung von %K ein.
- Stochastische Methode: Legen Sie die Methode fest, die zur Berechnung von %D verwendet wird.
- Stochastisches Preisfeld: Das Volumen, das für die Berechnungen des Stochastik-Oszillators verwendet wird. (Normalerweise Real für Aktien, Tick für FOREX).
- Stochastischer RSI Zeitraum: Legen Sie die Periode des RSI fest.
- Stochastischer RSI %K Zeitraum: Legen Sie den Zeitraum für die Berechnung von %K des stochastischen Oszillators fest.
- Stochastischer RSI %D Zeitraum: Legen Sie die Periode für die Berechnung von %D des stochastischen Oszillators fest.
- RVI Zeitraum.
- ROC Zeitraum.
- ENABLE MetaTrader Alert / Email Alert / Push Notifications
- Deaktivieren.
- Kombiniert: Sie erhalten nur dann eine Benachrichtigung, wenn die Indikatoren Top/Bottom und Divergence ein gemeinsames Signal ergeben.
- Nur Top/Bottom: Sie erhalten nur Alarme für Top/Bottom-Signale.
- Nur Divergenz: Sie erhalten nur Alarme für Divergenzsignale.
- Beide: Sie erhalten Alarme sowohl für Top/Bottom- als auch für Divergenz-Signale.