Smart ZigZag
- Indikatoren
- Version: 1.11
- Aktualisiert: 8 November 2022
- Aktivierungen: 5

DerSmart ZigZag-Indikator ist ein ZigZag, für den der Markt tatsächlich nicht zufällig ist. Dies ist keine bloße Behauptung, sondern kann anhand der angezeigten Charts bestätigt werden, in denen Smart ZigZag und die HZZ-Parameter verglichen werden.
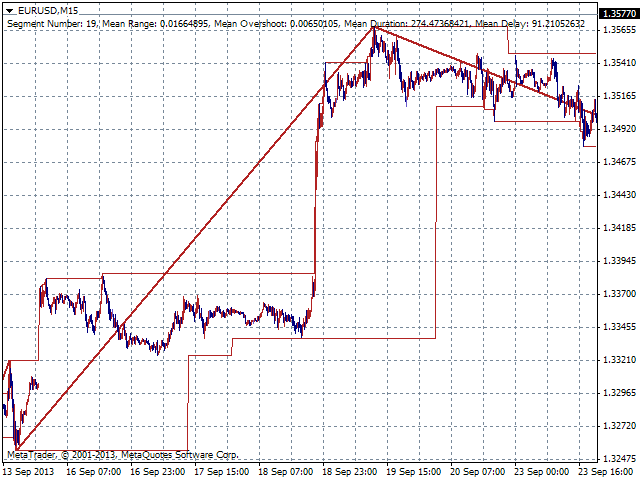
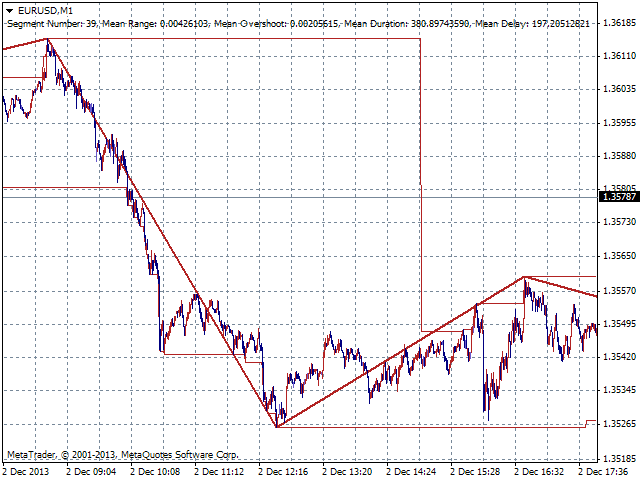
Doch bevor ich die Screenshots beschreibe, möchte ich einige Details zu Smart ZigZag erläutern . Dieser Indikator analysiert den Chart und identifiziert bestimmte Aktivitätshorizonte, indem er ihnen Zahlen zuweist. Dies kann als Ranking bezeichnet werden. Zum Beispiel hat der M1 EURUSD Chart vom 4.01.1999 bis zum 3.12.2013 eine durchschnittliche Segmentamplitude von 31,08 Punkten (76 982 Segmente) für Rang 2, 65,98 (17 298) - für Rang 3, 141,90 (3 959) - für Rang 4, 305,25 (868) - für Rang 5, 690,74 (174) - für Rang 6, 1 618,51 (32) - für Rang 7. Alle weiteren Berechnungen haben wenig Sinn.
Der angezeigte Rang wird in den Indikatorparametern eingestellt. Neben dem ZigZag selbst wird auf dem Chart ein Bereich mit den Grenzen angezeigt, die den Wechsel der Richtung des aktuellen Segments von Smart ZigZag definieren. Diese Niveaus können z.B. für die Platzierung von Pending Orders oder Stop Loss entweder manuell oder mit Hilfe von Expert Advisors verwendet werden.
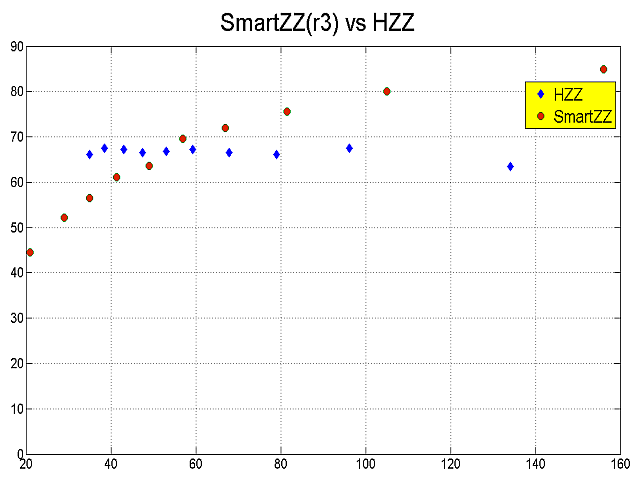
Kommen wir nun zu den Charts. Dies sind die Abhängigkeiten der durchschnittlichen Amplitude des ZigZag-Segments vom vorherigen Segment für Rang 3(SmartZZ(r3) vs HZZ) und 4(SmartZZ(r4) vs HZZ). Dies ist also "nur" ein Parameter für die Vorhersagekraft der Indikatoren. Die Achsen stellen die Amplituden in vier Ziffern dar. Die HZZ-Schaltparameter werden so gewählt, dass die durchschnittliche Amplitude ihrer Segmente fast gleich der durchschnittlichen Amplitude der SmartZZ-Segmente ist.
Etwa 2 000 Segmente für r3 und etwa 400 Segmente für r4 werden in jedem Kartenpunkt "gebaut". Es stellt sich heraus, dass die Punkte für HZZ fast horizontal angeordnet sind. Das bedeutet, dass es praktisch keine langfristige Abhängigkeit zwischen den Amplituden der beiden aufeinanderfolgenden Segmente gibt. Das bedeutet nicht, dass der HZZ ein schlechter ZigZag ist, denn der Markt hat seine Stimmung in den letzten 14 Jahren oft geändert. Ich denke, dass es nur wenige Indikatoren gibt, deren "Vorhersagen" sich von 50/50 in einer solchen Stichprobe unterscheiden. Bitte beachten Sie jedoch, dass der SmartZZ-Indikator genau diesen Fall repräsentiert, da wir eine deutliche Abhängigkeit des folgenden Segments von der Amplitude des vorherigen sehen können.
Wir sollten verstehen, dass dies eine statistische Beziehung ist. Diese Abhängigkeit kann nur nach den Maßstäben des Marktes als stark bezeichnet werden (wir sollten uns bewusst sein, dass das "Ziel" des Marktes darin besteht, jede kausale Beziehung zu zerstören, d.h. der Markt strebt immer nach "Effizienz"). Wenn Sie dieser Abhängigkeit folgen, werden Sie also sowohl günstige als auch ungünstige Perioden haben, wobei die ersteren überwiegen werden. Ungünstige Perioden werden jedoch den Drawdown erhöhen, so dass Sie mit recht kleinen Lots handeln müssen. Dies würde Ihren relativen Gewinn stark reduzieren.
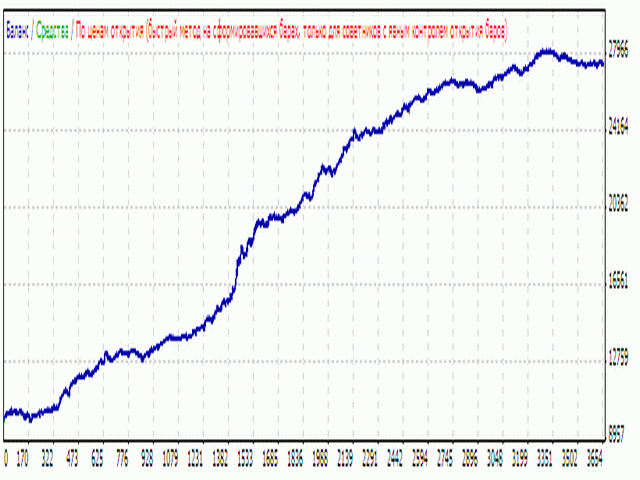
Mit anderen Worten, eine solche Rentabilität (unter Berücksichtigung der verbleibenden Risiken, die unvermeidlich sind) wird Ihnen kaum zusagen. SmartZZ wird Ihnen jedoch gute Primärsignale für die weitere Filterung liefern. Das "Einzige", was Sie lernen müssen, ist, günstige Perioden zu nutzen und ungünstige zu vermeiden. Die Testergebnisse eines Expert Advisors, der auf der Filterung von SmartZZ-Signalen basiert, finden Sie auch in den beigefügten Screenshots (Sommer 2004 - Dezember 2013, stabiles Lot).
Außerdem zeigen die Charts, dass die maximalen Amplituden von SmartZZ deutlich höher sind als die von HZZ (während die Durchschnittswerte gleich sind, wie Sie sich erinnern). Das bedeutet, dass SmartZZ im Falle eines Trailing-Stopps wesentlich effizienter sein wird.
SmartZZ berechnet einige statistische Parameter im laufenden Betrieb, zeigt sie als Kommentare an und ermöglicht auch das Schreiben der Koordinaten der Extremwerte in eine Datei.
SmartZZ-Parameter:
- ShowRank setzt den angezeigten Rang.
- HistoryDepth legt die Tiefe des berechneten Verlaufs in Balken fest. 0 bedeutet Berechnung entlang des gesamten verfügbaren Verlaufs. -1 bedeutet die Berechnung im angegebenen Intervall. Trotz dieser bemerkenswerten Eigenschaften ist SmartZZ ein sehr schneller Indikator, d.h. Sie können in den meisten Fällen 0 verwenden.
- StartDate legt den Startzeitpunkt der Berechnung fest (im Falle von HistoryDepth = -1).
- StopDate legt die Endzeit der Berechnung fest (im Falle von HistoryDepth = -1).
- SaveData verwaltet das Schreiben der Koordinaten der Extremwerte in eine Datei.

i RENTED TODAY BUT ITS NOT LOADING ON TO THE CHART. pLEASE HELPND ADVISE.