Dashboard Critical Support and Resistance MT5
- Indikatoren
-
Wang Yu
 Providing quick Developments and Conversion of MT4/MT5 EAs, Indicators, Scripts, and Tools. If you are looking for an Dashboard EA to turn your trading strategy into auto trading algo and to manage multi trades in one chart with visualizing tool, come and visit http://www.ex4gzs.com/en for more
 - Version: 1.1
- Aktualisiert: 23 November 2021
- Aktivierungen: 5
如果产品有任何问题或者您需要在此产品上添加功能,请联系我
Kontaktieren Sie mich, wenn Sie Probleme bei der Verwendung des Produkts haben oder zusätzliche Funktionen für die Basisversion benötigen.
Um auf die kostenlose Demoversion zuzugreifen, leiten Sie bitte zu diesem LINK weiter.
Um auf die Einzelpaar-Version zuzugreifen, leiten Sie bitte zu diesem LINK weiter.
Es ist wahrscheinlich, dass der Kurs an wichtigen Unterstützungs- und/oder Widerstandsmarken einen Pullback oder Ausbruch vollzieht. Dieses Dashboard soll Ihnen helfen, diese kritischen Unterstützungs- und Widerstandsbereiche zu überwachen. Sobald sich der Kurs diesen wichtigen Unterstützungs- und Widerstandsbereichen innerhalb des Warnbereichs nähert (der Bereich des Warnbereichs ist einstellbar), wird eine Warnung oder Benachrichtigung gesendet, und das Indikatorpanel wird rot eingefärbt, damit es auffällt. So müssen Sie nicht den ganzen Tag das Chart beobachten und überwachen.
Das Dashboard Super Critical Support and Resistance ist ein intuitives und praktisches grafisches Tool, das Ihnen hilft,:
- Sie haben die am häufigsten verwendeten kritischen Unterstützungen und Widerstände (Pivot-Unterstützung1/2/3, Pivot-Widerstand1/2/3, täglicher/wöchentlicher/monatlicher Pivot, tägliche Eröffnung, 100 runde Punkte und vorherige tägliche Hochs/Tiefs) von 28 wichtigen Paaren mit einem Dashboard unter Kontrolle.
Merkmale
- Möglichkeit, die Verwendung der Alarm-/Benachrichtigungsfunktion auszuwählen.
- Einstellbarer Warnbereich für jeden Typ von kritischen Unterstützungen/Widerständen.
- Auswahl der kritischen Unterstützungen/Widerstände, die verwendet werden sollen; standardmäßig sind alle von ihnen ausgewählt.
- Einstellbare Position der Anzeigetafel
Wichtige Punkte vor der Verwendung von Dashboard
- Wenn Sie Dashboard zum ersten Mal laden, kann es 3-5 Minuten dauern, bis die historischen Daten heruntergeladen sind. Bei weiteren Ladevorgängen dauert es nur noch wenige Sekunden.
- Vergewissern Sie sich, dass Sie alle 28 Symbole im Symbol-Fenster haben (wenn Ihr Broker 28 Paare anbietet).
Eingabe-Parameter
- Warnung bei Signal senden
- Benachrichtigung bei Signal senden
- Pivot-Unterstützung verwenden1
- True: Das Pivot-Support-Zellenfeld wird rot eingefärbt, und eine Warnung/Benachrichtigung wird gesendet, sobald sich der Preis in einen Bereich innerhalb der Pivot-Support-Warnzone bewegt
- Falsch: Es wird keine Aktion ausgelöst.
- Dieselbe Regel wird auf die folgenden Unterstützungen/Widerstände angewendet
- Pivot-Support1-Warnbereich
- Wahr: Die Pivot-Support-Zelle wird rot eingefärbt, und es wird eine Warnung/Benachrichtigung gesendet, sobald der Preis in den Bereich der Pivot-Support-Warnzone fällt.
- Dieselbe Regel wird auf die folgende Warnzone angewendet
- Pivot Support2 verwenden
- Pivot Support2 Warnzone
- Pivot Support3 verwenden
- Pivot Support3 Warnzone
- Pivot-Widerstand1 verwenden
- Pivot-Widerstand1 Warnbereich
- Pivot-Widerstand2 verwenden
- Pivot-Widerstand2 Warnbereich
- Pivot-Widerstand3 verwenden
- Pivot-Widerstand3 Warnbereich
- Täglichen Pivot verwenden
- Täglicher Pivot Warnzone
- Weekly Pivot verwenden
- Weekly Pivot Warnzone
- Monthly Pivot verwenden
- Monatlicher Pivot-Warnbereich
- Daily Open verwenden
- Täglich offener Warnbereich
- Verwenden Sie 100 Round Point
- 100-Runden-Punkt-Warnzone
- Vorheriges Tageshoch verwenden
- Vorheriges Tageshoch Warnzone
- Vorheriges Tagestief verwenden
- Vorheriges Tagestief Warnzone
- Suffix: Suffix-String Ihres Symbols. z.B.: Ihr Symbol ist 'EURUSDx' anstelle von 'EURUSD', geben Sie 'x' in die Suffix-Zelle ein, lassen Sie die Präfix-Zelle leer
- Präfix: Präfix-String Ihres Symbols
Dashboard-Objekte
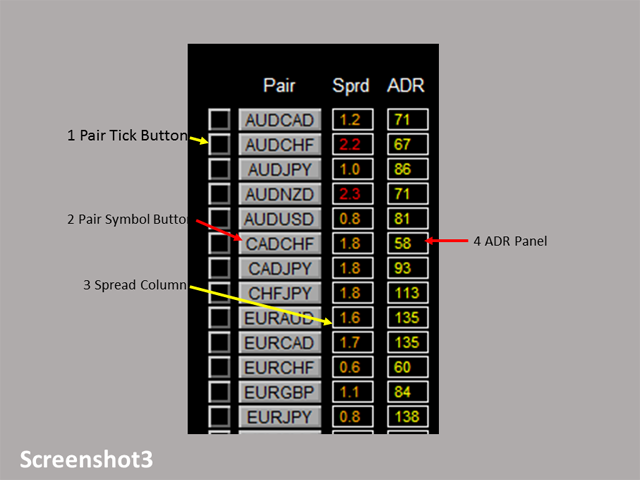
Bitte beachten Sie die Screenshots 3 bis 7.
- Paar Tick Button: Klicken Sie einmal, um das entsprechende Paar für den Handel zu aktivieren. Klicken Sie noch einmal, um es wieder zu deaktivieren.
- Schaltfläche "Paar-Symbol":
- Klicken Sie auf die Schaltfläche, um ein entsprechendes neues Chart-Fenster zu öffnen.
- Spalte "Aktueller Preis": Zeigt den aktuellen Preis für jedes Paar an.
- Schaltfläche zur Auswahl von Paaren/Währungen:
- Alle: alle 28 Paare auswählen
- Keine: alle ausgewählten Paare löschen
- EUR: Auswahl aller EUR-Paare, wie EURUSD, EURJPY...
- Die gleichen Regeln gelten für die Schaltflächen USD, GBP, JPY...
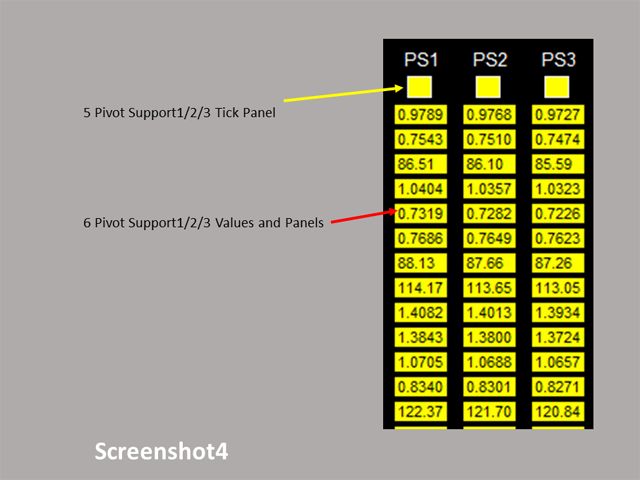
- Pivot Unterstützung1/2/3 Tick Panel
- Pivot Support1/2/3 Werte und Panels
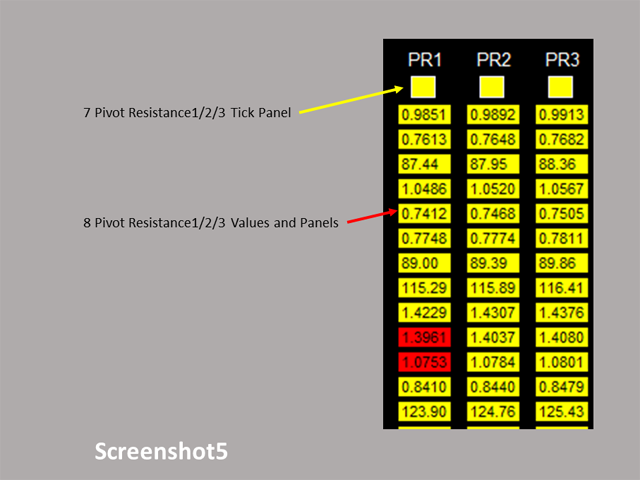
- Pivot-Widerstand1/2/3 Tick-Panel
- Pivot Resistance1/2/3 Werte und Panels
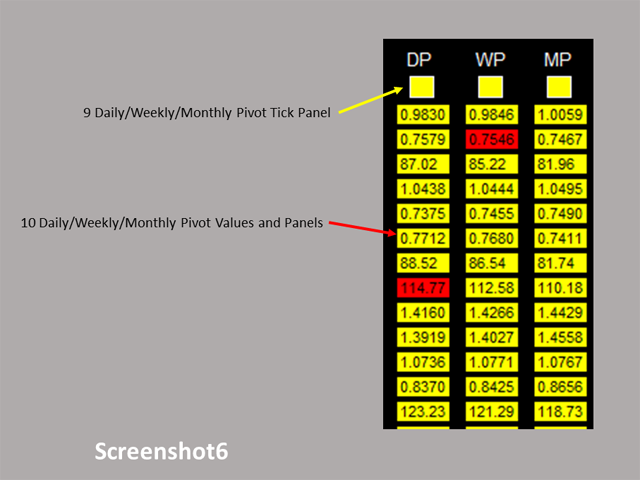
- Täglich/Wöchentlich/Monatlich Pivot-Tick-Panel
- Tägliche/Wöchentliche/Monatliche Pivot-Werte und -Panels
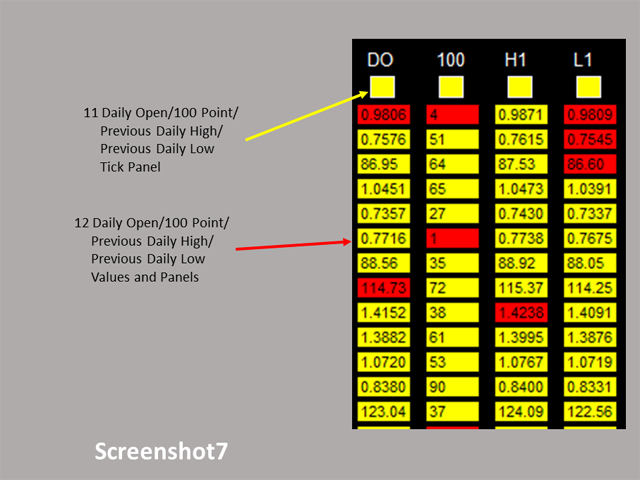
- Tägliche Eröffnung/100 Punkte/Vorheriges Tageshoch/Vorheriges Tagestief Tick-Panel
- Täglich Open/100 Point/Vorheriges Tageshoch/Vorheriges Tagestief Werte und Panels