Alpha Bands
- Indikatoren
-
Ziheng Zhuang
 About me:a C/C++ programmer and forex trader, develop MT4/5 apps from October 2007.
Email: admin@fxmeter.com
My products: https://www.mql5.com/en/users/fxmeter/seller - Version: 6.0
- Aktivierungen: 20
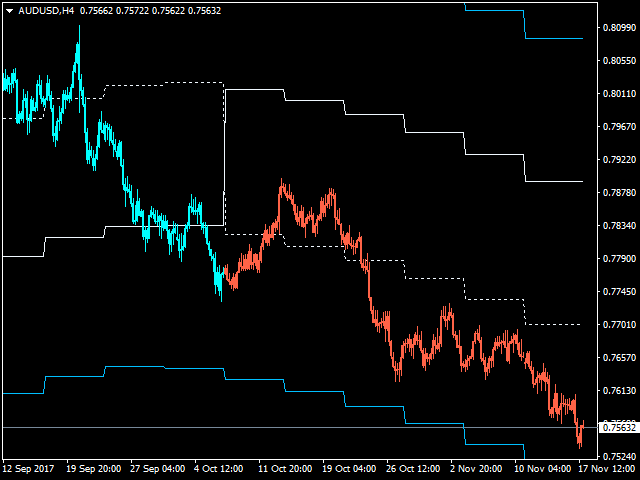
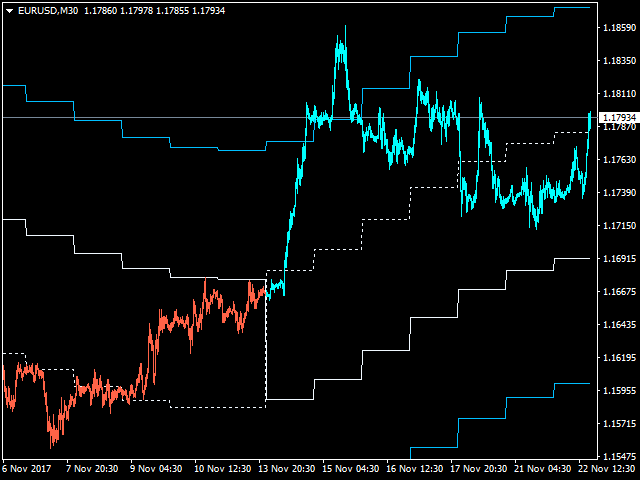
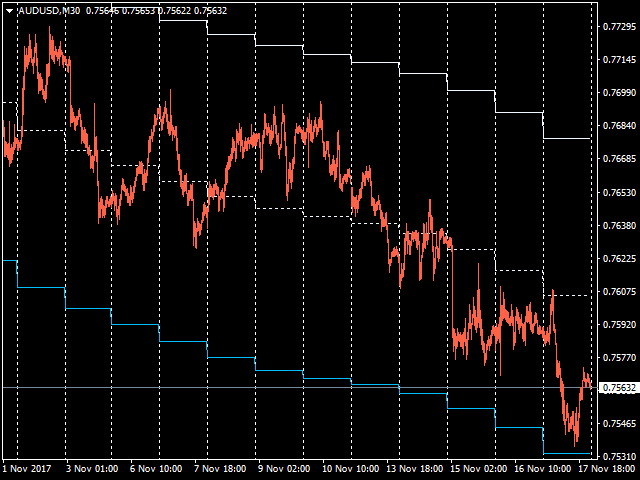
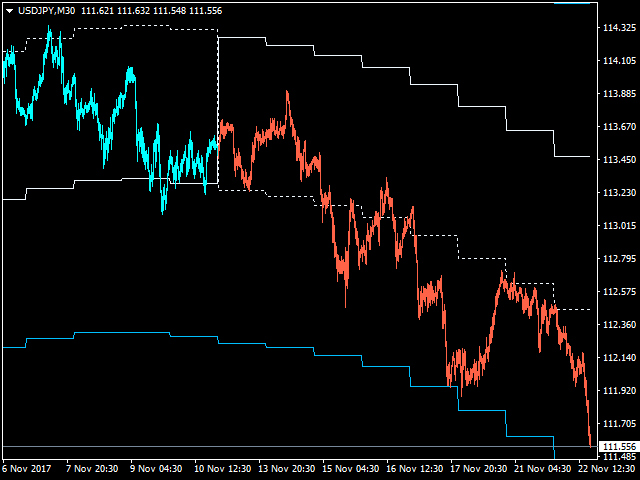
Dieser Indikator zeigt den Haupttrend im aktuellen Chart an.
Merkmale
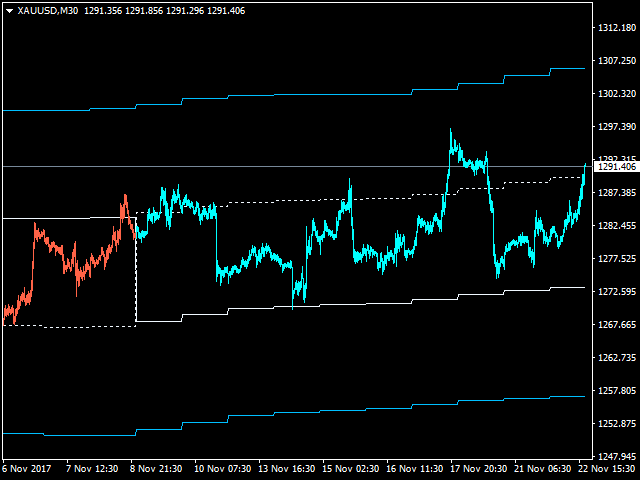
- Dieser Indikator umfasst zwei Bänder, ein inneres weißes Band und ein äußeres blaues Band.
- Wenn die weiß gepunktete Linie die weiße durchgezogene Linie nach unten kreuzt, bedeutet dies, dass sich der Trend zum Bären verändert hat.
- Wenn die weiß gepunktete Linie die weiße durchgezogene Linie nach oben kreuzt, bedeutet dies, dass sich der Trend zu einem Aufwärtstrend verändert hat.
- Sobald die Kreuzung stattgefunden hat, wird sie nicht erneut angezeigt.
Einstellungen
- ShowColorCandle: wenn 'true', wird die farbige Kerze angezeigt.
- BullColor: die Farbe der Kerze im bullischen Markt (Standard ist clrAqua).
- BearColor: die Farbe der Kerze im bärischen Markt (Standardwert ist clrTomato).
Verwendung
Steigen Sie in den Markt ein, wenn sich der Preis in den inneren Bändern befindet. Wenn der Preis die äußeren Bänder erreicht, sollte der Auftrag geschlossen werden.
Der Schlüssel zum Handel ist die Auswahl des richtigen Zeitrahmens. Natürlich können Sie Ihre eigene Strategie auf der Grundlage dieses Indikators erstellen.