ZigZag on average for MQL5
- インディケータ
- バージョン: 1.3
- アップデート済み: 14 6月 2021
- アクティベーション: 10

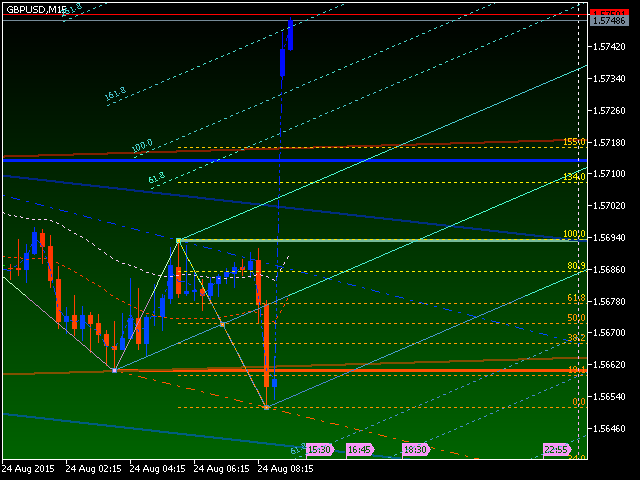
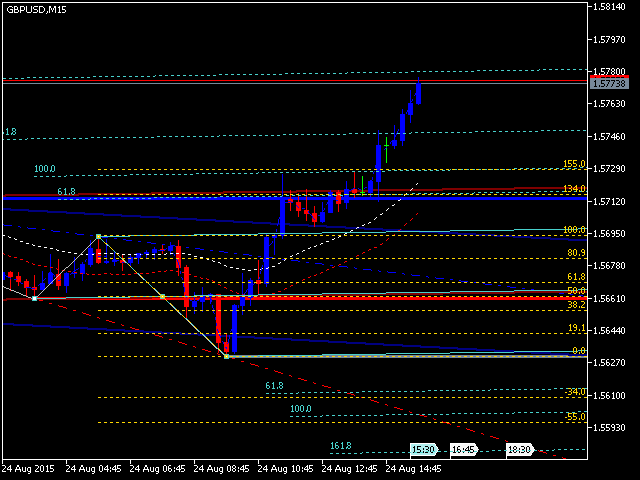
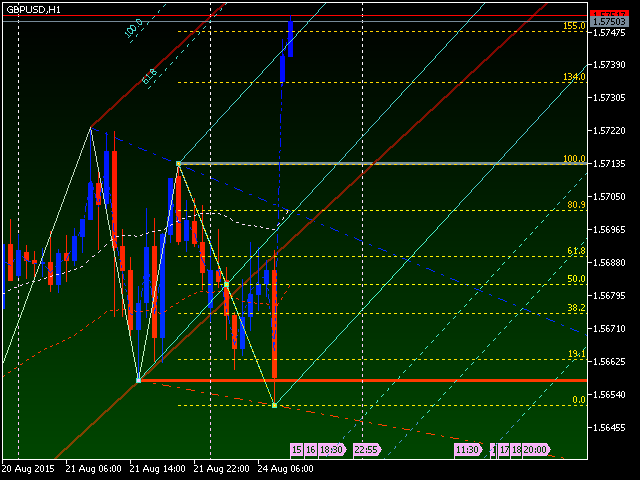
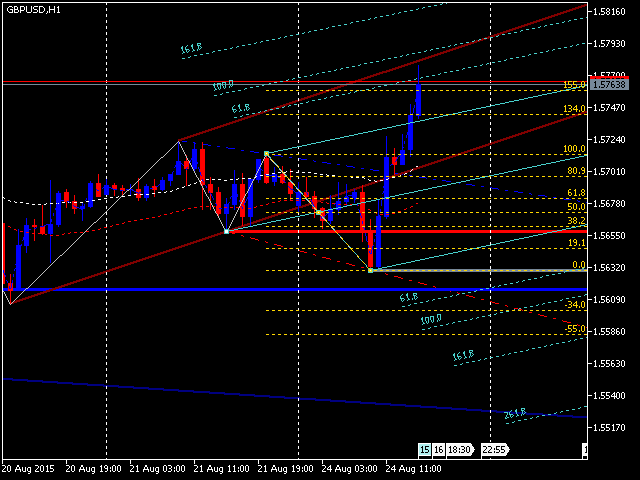
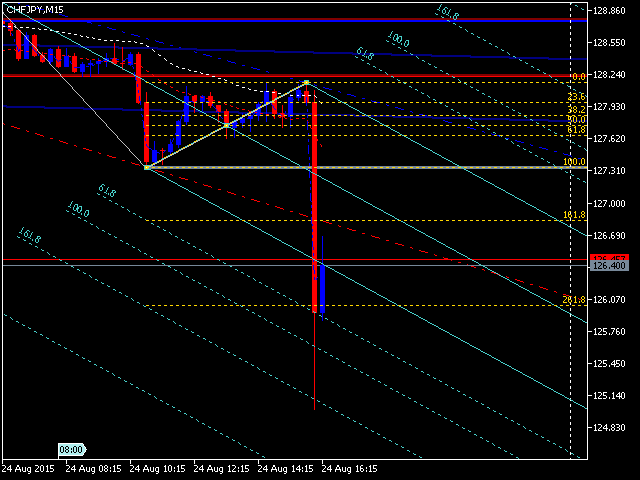
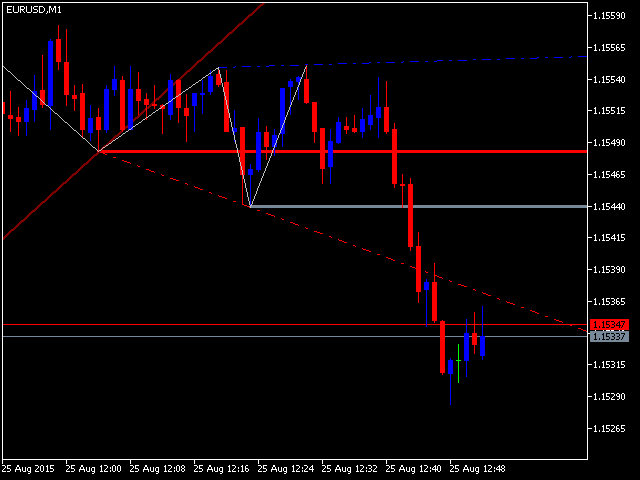
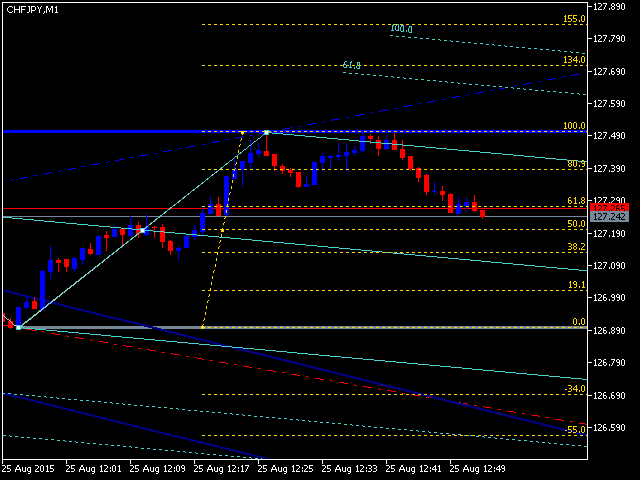
This is a well-known ZigZag indicator. But it differs by the fact that its plot is based on values of the middle line which is set by a user. It can display Andrews’ Pitchfork and standard or Bobokus Fibo levels. NO REPAINTING.
Parameters
- Period МА — middle line period. Default value is 34. Minimum value is 4. Maximum value is set at your discretion.
- Used to calculate price — type of price used for the midline calculations.
- The averaging method — type of smoothing for the middle line.
- Turning pitchfork — enable (true) or disable (false) Andrews’ Pitchfork.
- PitchColor — Andrews’ Pitchfork color.
- Inclusion levels Fibo — enable (true) or disable (false) Fibo levels.
- Installing Fibo Bobokus levels — use Bobokus Fibo levels (true) ot standard Fibo levels (false).
- Distance to turn Fib levels Bobokus — distance in points between spots of the last movement to visualize Bobokus Fibo levels.
- Color Fibonacci zone — Bobokus Fibo levels color.
- switch (OFF) display support and resistance levels — show (hide) support and resistance levels.
- switch (OFF) display channels support and resistance — show (hide) support and resistance channels.
Customize here the color scheme and the width of lines. Please note the following construction specifics of support and resistance lines. They only appear where trend direction changes, so they are a good assistant in detecting entry/exit points. Also note the "traces" of previous channels, which appear as short trendlines on the zigzag tops (bottoms). This indicator provides more you confidence in trade decision making.


ユーザーは評価に対して何もコメントを残しませんでした