The Strat Combo
- Indikatoren
-
Minh Truong Pham
 Hello, my name is Pham and I am a programmer and trader! At here, I create amazing forex indicators and expert advisors for Metatrader.
I will try:
+ Provide best tools base on my 5 years experience as a trader and 10 years as a programmer. - Version: 1.0
- Aktivierungen: 5
Alerts sind auch für die Erkennung von bestimmten Kerzennummern, benutzerdefinierte Combos und PMGs enthalten.
🔶 SETTINGS
- Nummern im Chart anzeigen: Zeigt die Kerzennummerierung auf dem Chart an.
- Kerzen gestalten: Gestaltet Kerzen auf der Grundlage der erkannten Nummer. Nur wirksam bei nicht-linearen Charts und wenn das Skript in den Vordergrund gebracht wird.
🔹 Benutzerdefinierte Kombisuche
- Kombo: Benutzerdefinierte Kombination, die vom Skript durchsucht werden soll. Die Kombinationen können aus einer beliebigen Zahlenreihe bestehen, einschließlich (1, 2, -2, 3), z. B. 2-21. Es sollten keine Leerzeichen oder andere Zeichen verwendet werden.
🔹 Pivot-Maschinengewehr
- Beschriftungen anzeigen: Hebt erkannte PMGs mit einer Beschriftung hervor.
- Min. Sequenzlänge: Minimale Sequenzlänge von aufeinanderfolgenden höheren Tiefstwerten/niedrigeren Höchstwerten, die erforderlich ist, um einen PMG zu erkennen.
- Min Brüche: Erforderliche Mindestanzahl an gebrochenen vorherigen Hochs/Tiefs, um einen PMG zu erkennen.
- Levels anzeigen: Zeigt die Niveaus der gebrochenen Hochs/Tiefs an.
🔹 Pivot Combos
- Pivot-Rückblick: Rückblickzeitraum, der für die Erkennung von Pivot-Punkten verwendet wird.
- Rechte Balken scannen: Anzahl der Bars, die auf der rechten Seite eines erkannten Pivots gescannt werden.
- Linker Balken Scan: Anzahl der Takte, die auf der linken Seite eines erkannten Pivots gescannt werden.
🔹 Dashboard
- Dashboard anzeigen: Zeigt das Statistik-Dashboard im Diagramm an.
- Zahlen-Zähler: Zeigt den Abschnitt Zahlen-Zähler auf dem Dashboard an.
- Pivot-Kombinationen: Zeigt den Bereich der Pivot-Kombinationen auf dem Dashboard an.
- MTF anzeigen: Zeigt eine MTF-Kerzennummerierung auf dem Dashboard an.
🔶 ANWENDUNG
(Abbildung 1) Mit diesem Skript können Benutzer, die mit The Strat vertraut sind, Elemente wie Kerzennummern, Pivot-Maschinengewehre und benutzerdefinierte Combos schnell hervorheben. Die Verwendung dieser Konzepte wird in den folgenden Unterabschnitten erläutert.
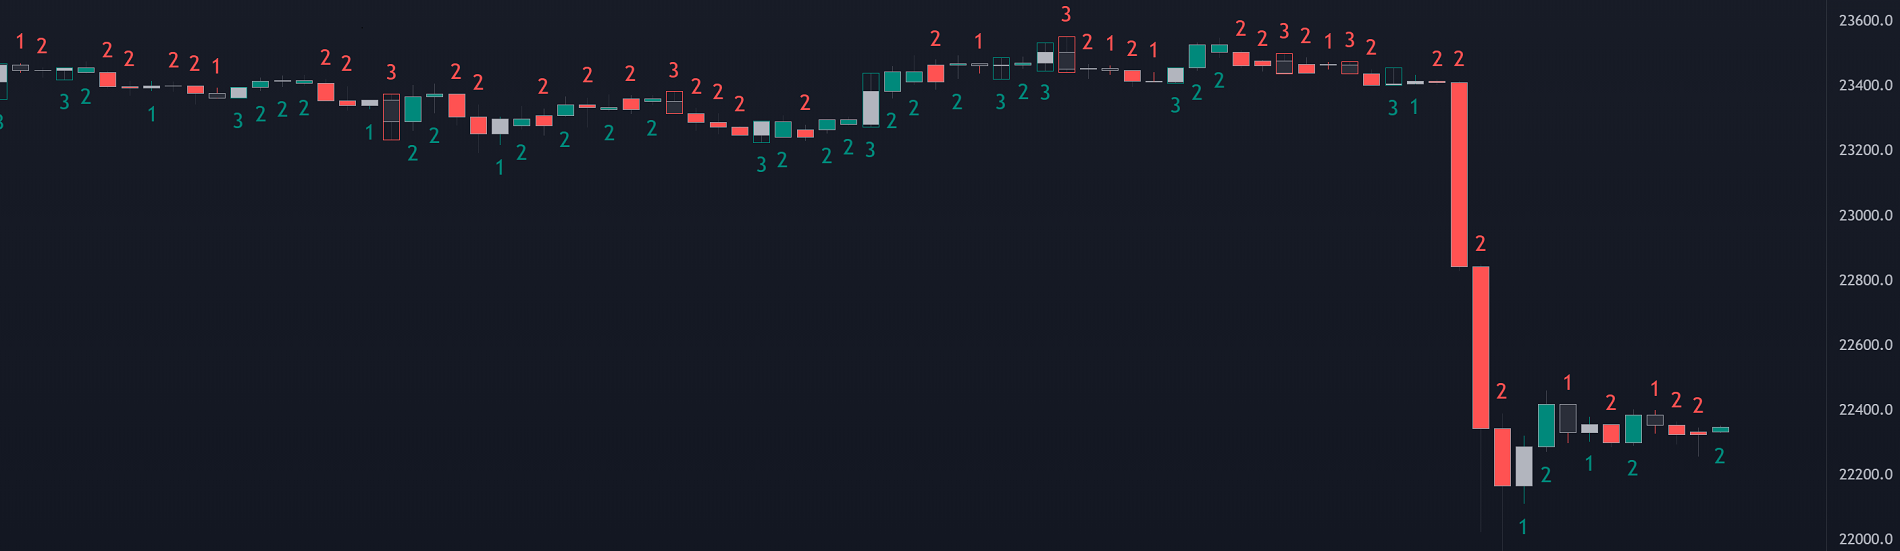
🔹 Candle Numbers
- Nummer 1 - Inside Bar, tritt auf, wenn der vorherige Kerzenbereich den aktuellen verschlingt.
- Nummer 2 Up - Upside Directional Bar, tritt auf, wenn das aktuelle Kurshoch das vorherige Hoch durchbricht, während das aktuelle Tief niedriger ist als das vorherige Hoch.
- Nummer 2 - Down - Downside Directional Bar, tritt auf, wenn das aktuelle Preistief das vorherige Tief durchbricht, während das aktuelle Hoch höher ist als das vorherige Tief.
- Nummer 3 - Outside Bar, tritt auf, wenn der aktuelle Kerzenbereich den vorherigen verschlingt.
Das Skript kann die Nummer einer Kerze durch die Verwendung von Etiketten hervorheben, aber auch Kerzen in Abhängigkeit von der Kerzennummer gestalten. Bei Innenbars (1) wird nur der Kerzendocht hervorgehoben, bei Richtungsbars (2) (-2) wird nur der Kerzenkörper hervorgehoben. Bei äußeren Leisten wird der Kerzenbereich hervorgehoben.
Beachten Sie, dass untere direktionale Leisten mit der Zahl -2 hervorgehoben werden.
Benutzer können auf dem Dashboard, das in den Einstellungen verfügbar ist, die Gesamtzahl der Erkennungen einer bestimmten Kerzennummer in den historischen Daten sowie die Anzahl der Erkennungen einer Kerzennummer im Verhältnis zur Gesamtzahl der erkannten Kerzennummern, ausgedrückt als Prozentsatz, sehen.
Es ist auch möglich, die aktuellen Kerzennummern, die von mehreren Zeitrahmen zurückgegeben werden, auf dem Dashboard zu sehen.
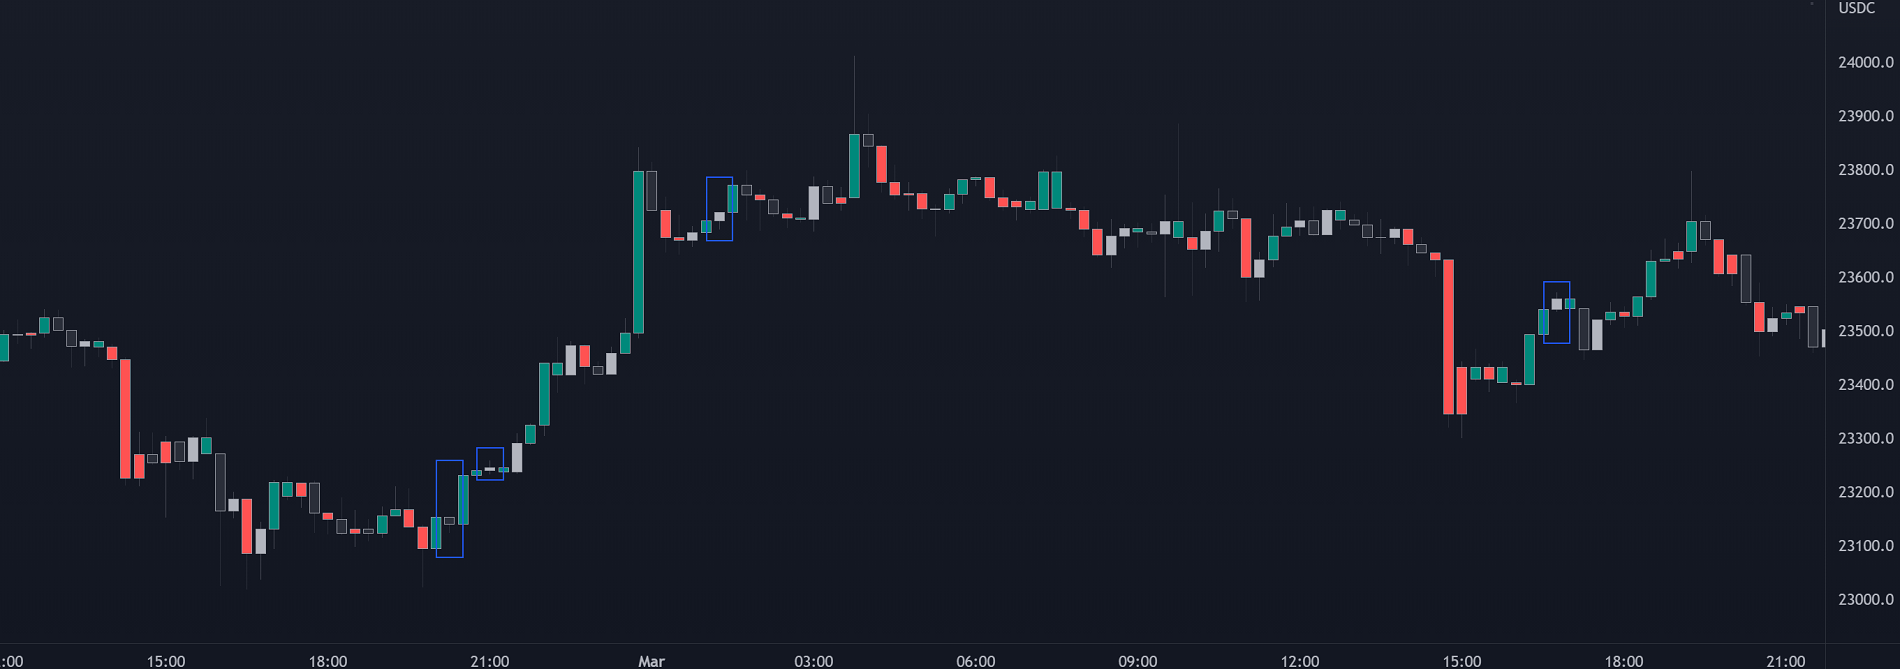
🔹 S uche nach benutzerdefinierten Combos
(Abbildung 3) Combos bestehen aus einer Sequenz von zwei oder mehr Kerzennummern. Diese Combos können mehrere Umkehr-/Fortsetzungsszenarien aufzeigen. Verschiedene gebräuchliche Combos sind von der Strat-Gemeinschaft dokumentiert.
Dieses Skript ermöglicht es Benutzern, nach benutzerdefinierten Combos zu suchen, indem sie sie in das Combo-Benutzereinstellungsfeld eingeben.
Wenn eine Benutzer-Combo gefunden wird, wird sie auf dem Diagramm als Kästchen hervorgehoben, das den Combo-Bereich hervorhebt.
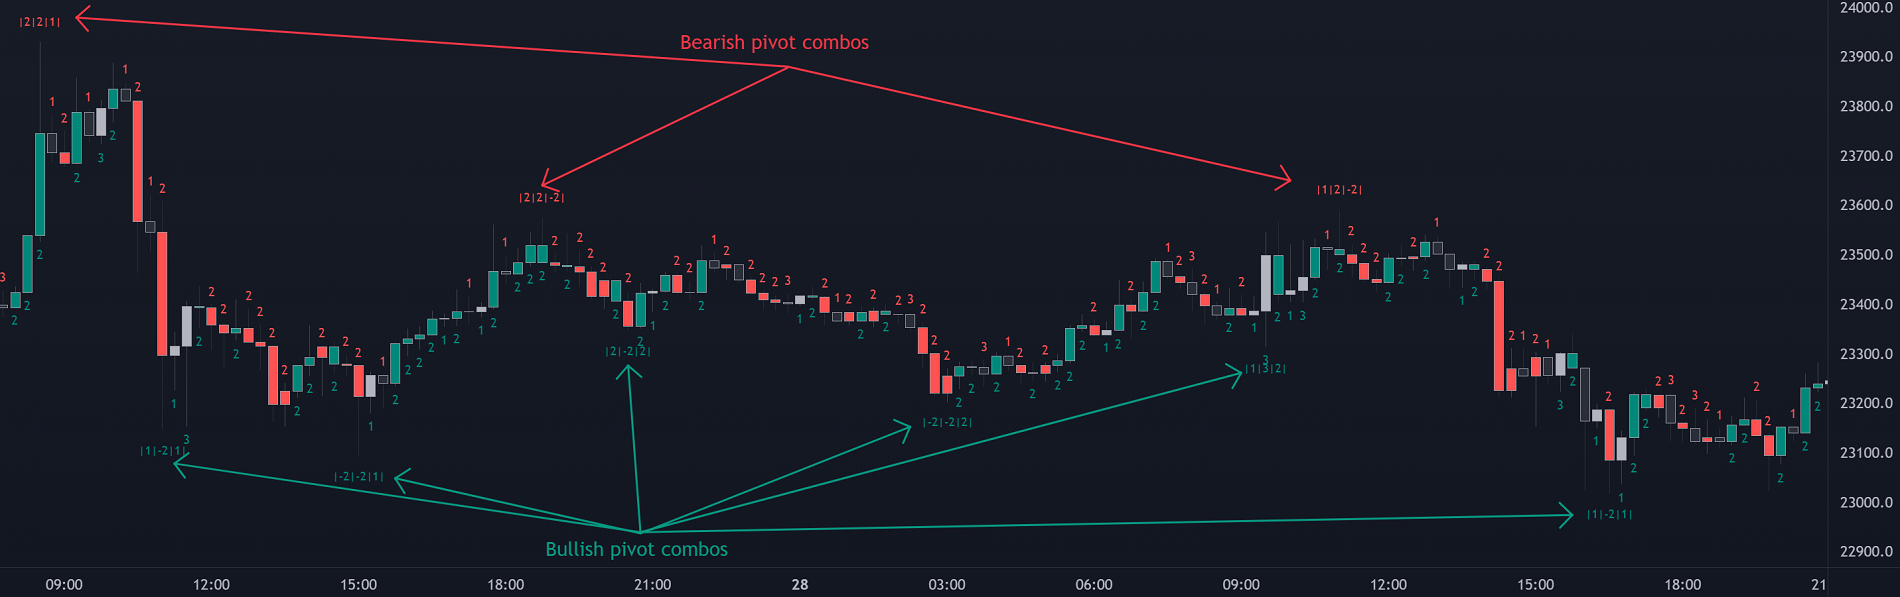
🔹 Pivot Combos
(Abbildung 4) Es kann für einen Benutzer von Interesse sein, die mit einem Pivot-Hoch/Tief verbundene Kombination anzuzeigen. Dieses Skript hebt die Position der Pivot-Punkte im Diagramm hervor und zeigt standardmäßig die zugehörige Kombination an. Diese basieren auf dem Pivot-Combo-Lookback und werden nicht in Echtzeit angezeigt.
Benutzer können auf dem Dashboard die Combos sehen, die mit einem Pivot-Hoch/Tief verbunden sind, diese sind nach Häufigkeit geordnet.
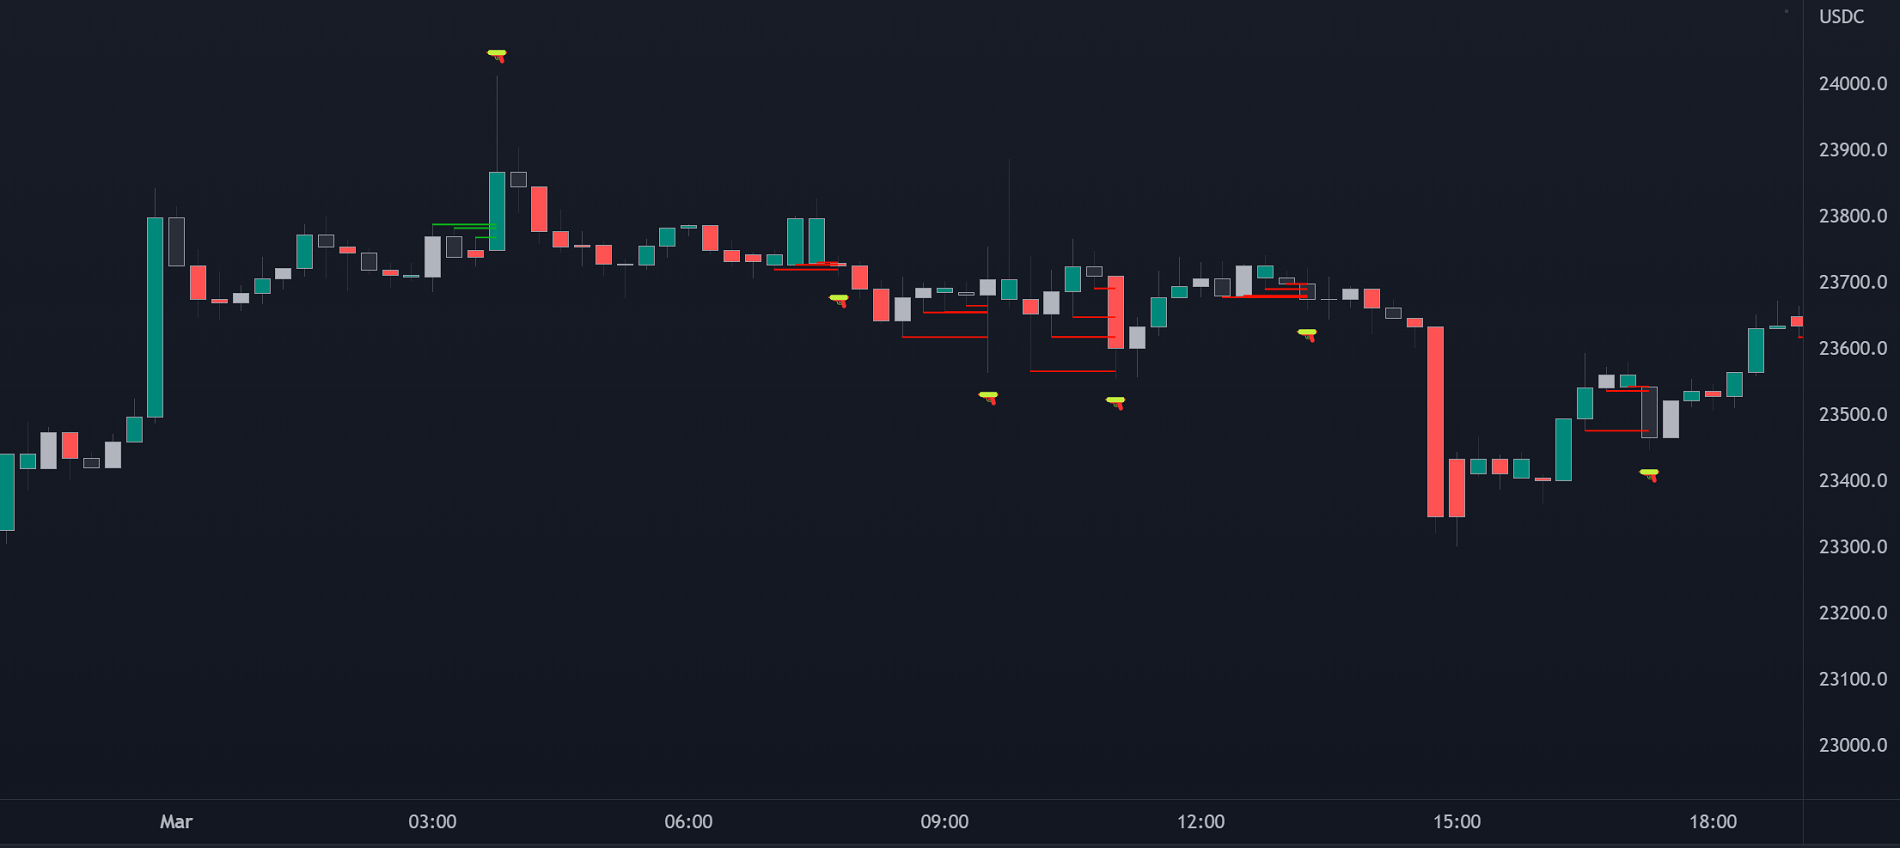
🔹 Pivot Machine Gun (PMG)
Benutzer können die Mindestlänge der Sequenz aufeinanderfolgender höherer Tiefs/tiefere Hochs auswählen, die für die Erkennung einer PMG erforderlich ist, sowie die Anzahl dieser aufeinanderfolgenden höheren Tiefs/tieferen Hochs, die durchbrochen werden müssen.