Standard Deviation Channel MT4
- Indikatoren
-
Do Thi Phuong Anh
 Hi, I'm PA, 27 years old. I have 3 years of experience in forex trading and freelance work on various related projects, especially programming... I look forward to your assistance in the future and hope you have a good experience here.
 - Version: 1.0
- Aktivierungen: 5
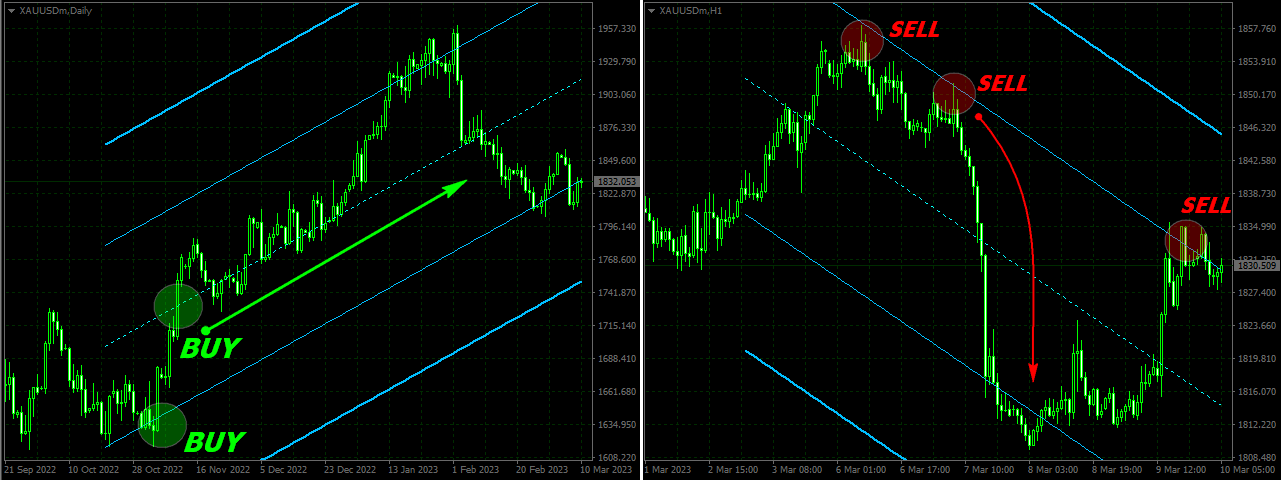
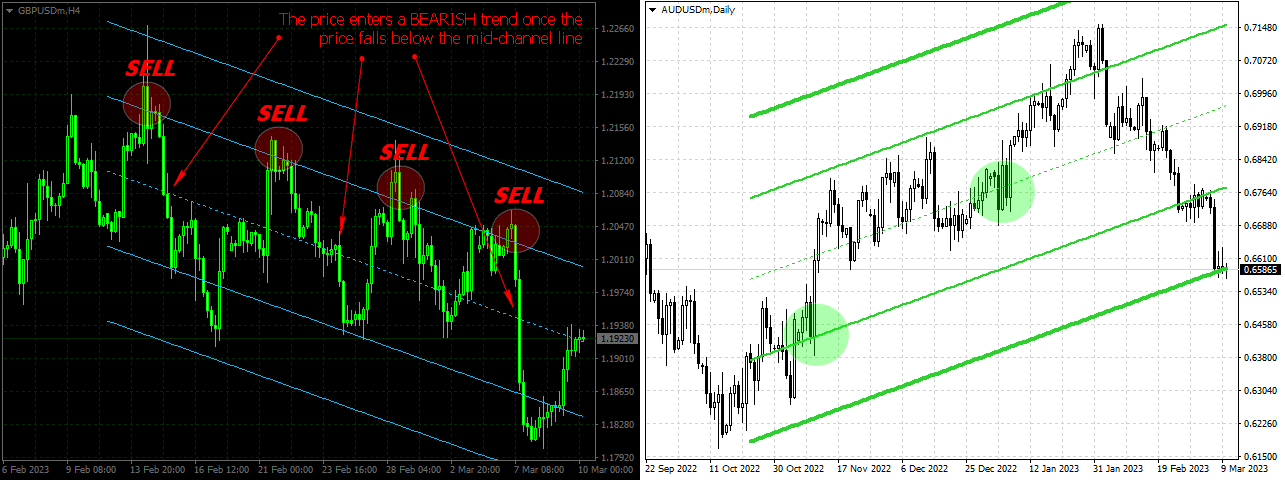
Der MT4-Kanal-Standardabweichungsindikator zeichnet automatisch Unterstützungs- und Widerstandskanäle auf dem Preisdiagramm unter Verwendung der Preisstandardabweichung.
Er zeigt BULLISH und BEARISH Marktbedingungen an und ist sowohl für neue als auch für fortgeschrittene Forex-Händler geeignet.
Dieser Indikator bietet Unterstützung, Widerstand, Einstiegs- und Ausstiegsniveaus sowie Stop-Loss- und Take-Profit-Punkte.
Er identifiziert präzise BULLISH- und BEARISH-Markttrends, was ihn sowohl für den Intraday- als auch für den langfristigen Handel über verschiedene Zeitrahmen hinweg effektiv macht.