Support Resistance Lines Safe to Trade
- Indikatoren
- Do Thi Phuong Anh
- Version: 1.1
- Aktivierungen: 5
Beim Devisenhandel ist es von entscheidender Bedeutung, Unterstützung und Widerstand zu kennen. Praktisch jede Handelsstrategie bezieht diese Ebenen mit ein.
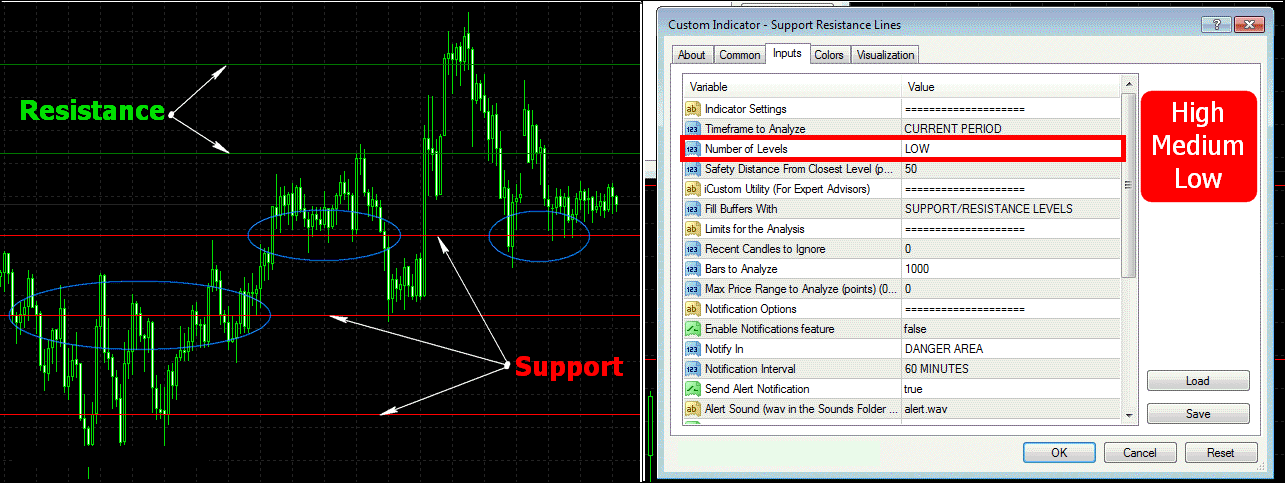
MetaTrader verfügt nicht über integrierte Funktionen zur Berechnung von Unterstützungs- und Widerstandsniveaus, aber es gibt eine Lösung - den Support and Resistance Lines Indikator.
Dieser leistungsstarke MetaTrader-Indikator berechnet automatisch die Unterstützungs- und Widerstandsniveaus für jedes beliebige Währungspaar oder Handelsinstrument und zeigt diese an.
Die Vorteile des Support and Resistance Lines Indikators:
1. Identifizieren Sie bessere Handelsmöglichkeiten, indem Sie Ihre Strategie auf der Grundlage von Unterstützungs- und Widerstandsniveaus anpassen.
2. Sparen Sie Zeit mit automatischen Berechnungen der Niveaus, die auf dem Chart angezeigt werden.
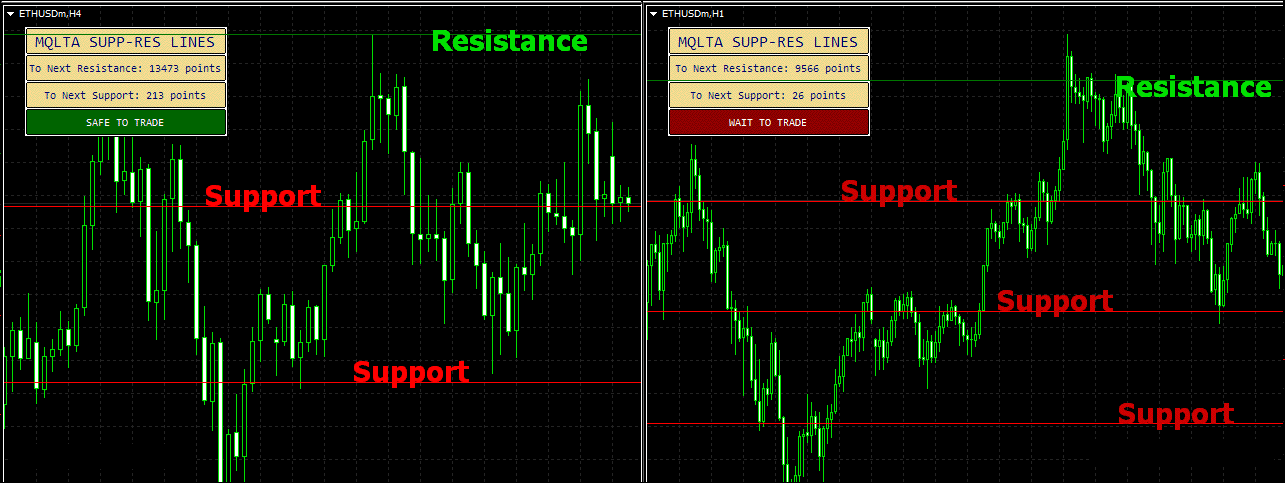
3. Erhalten Sie Benachrichtigungen, wenn sich der Kurs den Unterstützungs- oder Widerstandsniveaus nähert oder von ihnen abweicht.
Praktische Anwendungen des Indikators:
1. Beurteilen Sie Einstiegssignale, indem Sie die Nähe des Kurses zur Unterstützung oder zum Widerstand berücksichtigen.
2. Passen Sie Ihre Strategie an die Stagnation oder den Wiederanstieg des Preises auf diesen Niveaus an.
3. Legen Sie Ausstiegspunkte wie Take-Profit oder Stop-Loss fest oder nutzen Sie diese für Trailing-Stops.