PipTick Pairs Cross MT5
- Indikatoren
-
Michal Jurnik
 "Talent is cheaper than table salt. What separates the talented individual from the successful one is a lot of hard work." - Stephen King. Those few words reflect myself very well. I am probably not the most talented developer in the world but I truly believe in hard work, professional attitude and
 - Version: 1.5
- Aktualisiert: 1 Dezember 2021
- Aktivierungen: 5
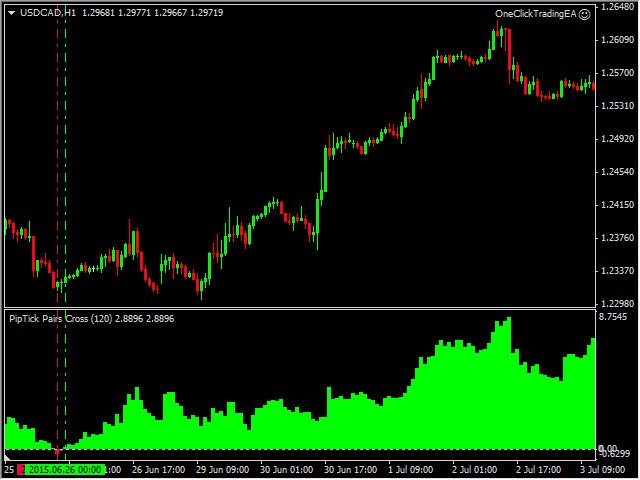
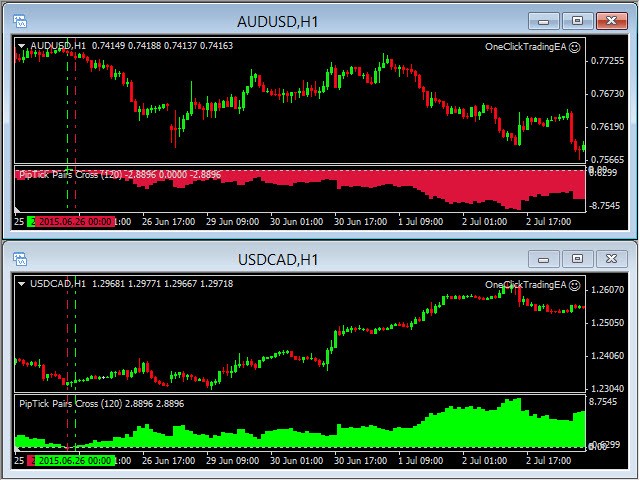
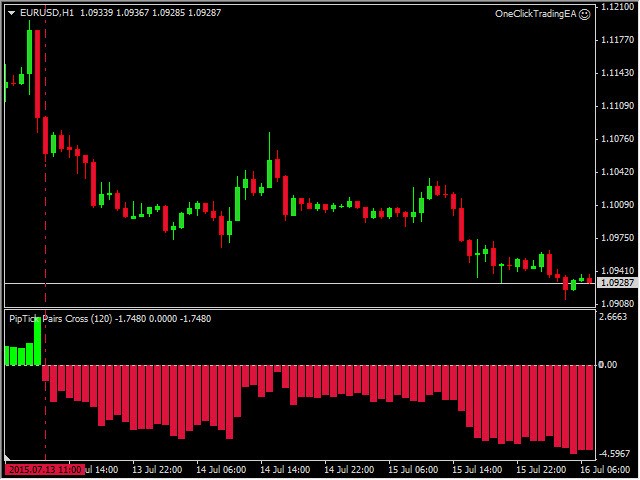
DerPairs Cross-Indikator ist ein einzigartiges Instrument für negativ korrelierte Handelsinstrumente, wie z.B. die Währungspaare EURUSD und USDCHF. Er basiert auf einem Konzept, das als Pairs Trading (oder Spread Trading) bezeichnet wird. Unser Indikator vergleicht die Stärke von zwei Währungspaaren, die umgekehrt korreliert sind, und zeigt Ihnen schnell an, wann es an der Zeit ist, das erste Paar zu kaufen und ein zweites Paar zu verkaufen und umgekehrt. Dies ist ein unkomplizierter Ansatz für den Handel mit Währungspaaren, der sehr gut funktioniert.
Wie können Sie den Pairs Cross Indikator verwenden?
Es gibt nur zwei grundlegende Möglichkeiten, wie Sie mit diesem Indikator handeln können:
- Das Histogramm hat seine Farbe von rot nach grün geändert (Kreuz über 0) - KAUFEN Paar 1, VERKAUFEN Paar 2
- Das Histogramm hat die Farbe von grün zu rot gewechselt (Kreuz unter 0) - SELL Pair 1, BUY Pair 2
Um den Erfolg der Signale zu erhöhen, empfehlen wir auch die Anwendung einiger zusätzlicher Filter, wie z.B. denHeikin Ashi Indikator.
Geeignete Währungspaare
- EURUSD vs. USDCHF
- GBPUSD vs. USDCHF
- AUDUSD vs. USDCHF
- EURUSD vs. USDCAD
- AUDUSD vs. USDCAD
Wichtigste Merkmale
- Der Indikator vergleicht die Stärke von zwei invers korrelierten Währungspaaren.
- Die Signallinie für den Einstieg oder Ausstieg in die Trades.
- Funktioniert auf jedem Zeitrahmen (M1, M5, M15, M30, H1, H4, D1, W1, MN).
- Der Indikator ist nicht malerisch.
- Bereit für Backtesting (anpassbare Rückblicksperiode).
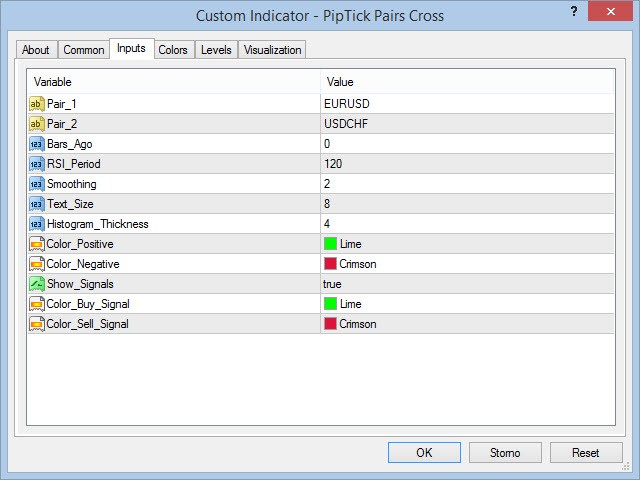
- Anpassbare Parameter (Farben, Liniendicke, RSI-Periode...).
- Hochgeschwindigkeitsberechnung.
- Der Indikator arbeitet auch mit Präfixen und Suffixen von Symbolen (EURUSD.m, EURUSD-pro...).
- Verfügbar für MT4 und MT5.