PipTick Pairs Cross MT5
- Indicadores
-
Michal Jurnik
 "Talent is cheaper than table salt. What separates the talented individual from the successful one is a lot of hard work." - Stephen King. Those few words reflect myself very well. I am probably not the most talented developer in the world but I truly believe in hard work, professional attitude and
 - Versión: 1.5
- Actualizado: 1 diciembre 2021
- Activaciones: 5
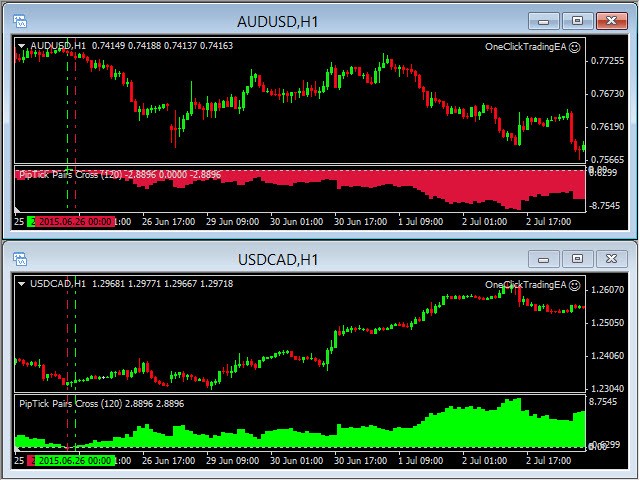
Elindicador Pairs Cross es una herramienta única para instrumentos de negociación con correlación negativa, como los pares de divisas EURUSD y USDCHF. Se basa en un concepto denominado trading de pares (o spread trading). Nuestro indicador compara la fuerza de dos pares de divisas que están inversamente correlacionados y le dice rápidamente cuándo es el momento de comprar el primer par y vender el segundo, y viceversa. Se trata de un enfoque sencillo para operar con pares de divisas que funciona muy bien.
¿Cómo utilizar el indicador Pairs Cross?
Sólo hay dos formas básicas de operar con este indicador:
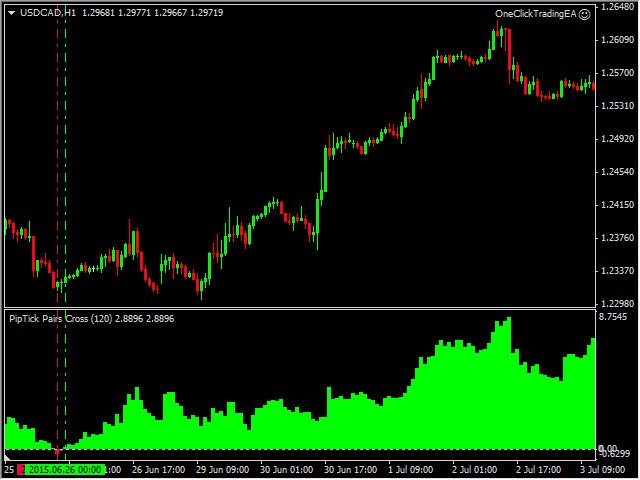
- El histograma ha cambiado de color de rojo a verde (cruce por encima de 0) - COMPRAR Par 1, VENDER Par 2
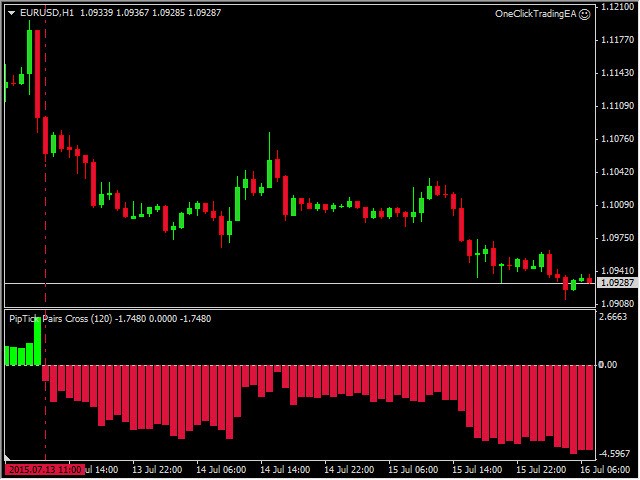
- El histograma ha cambiado de color de verde a rojo (cruce por debajo de 0) - VENTA Par 1, COMPRA Par 2
Para aumentar el éxito de las señales, también recomendamos aplicar algunos filtros adicionales, como elindicador Heikin Ashi.
Pares de divisas adecuados
- EURUSD vs. USDCHF
- GBPUSD vs. USDCHF
- AUDUSD vs USDCHF
- EURUSD contra USDCAD
- AUDUSD vs. USDCAD
Características principales
- El indicador compara la fuerza de dos pares de divisas inversamente correlacionados.
- La línea de señal para entrar o salir de las operaciones.
- Funciona en todos los marcos temporales (M1, M5, M15, M30, H1, H4, D1, W1, MN).
- El indicador no repinta.
- Listo para backtesting (periodo de retrospectiva personalizable).
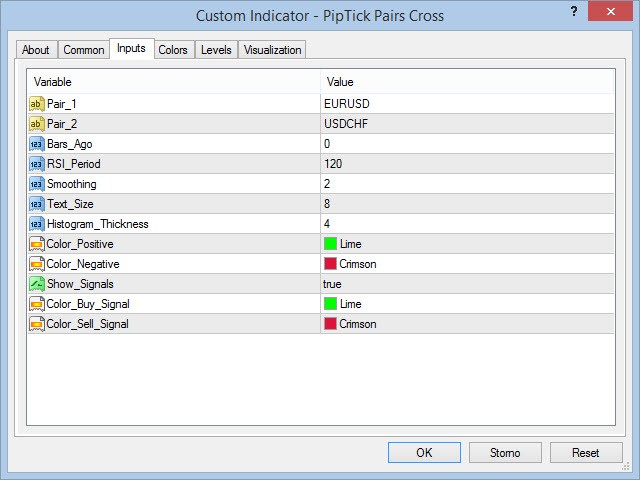
- Parámetros personalizables (colores, grosor de línea, periodo RSI...).
- Cálculo de alta velocidad.
- El indicador funciona también con prefijos y sufijos de símbolos (EURUSD.m, EURUSD-pro...).
- Disponible para MT4 y MT5.