PipTick Pairs Cross MT5
- Göstergeler
-
Michal Jurnik
 "Talent is cheaper than table salt. What separates the talented individual from the successful one is a lot of hard work." - Stephen King. Those few words reflect myself very well. I am probably not the most talented developer in the world but I truly believe in hard work, professional attitude and
 - Sürüm: 1.5
- Güncellendi: 1 Aralık 2021
- Etkinleştirmeler: 5
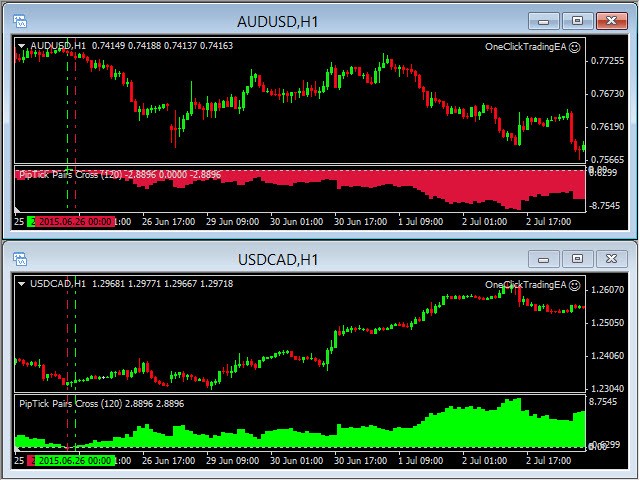
The Pairs Cross indicator is a unique tool for negatively correlated trading instruments, such as EURUSD and USDCHF currency pairs. It is based on a concept called pairs trading (or spread trading). Our indicator compares the strength of two currency pairs that are inversely correlated and quickly tells you when it’s time to buy the first pair and short a second pair, and vice versa. This is a straightforward approach to trading currency pairs that works very well.
How to you use the Pairs Cross indicator?
There are only two basic ways how to trade with this indicator:
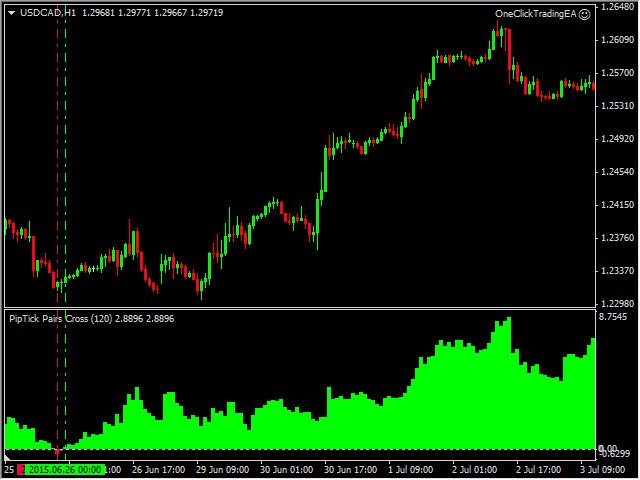
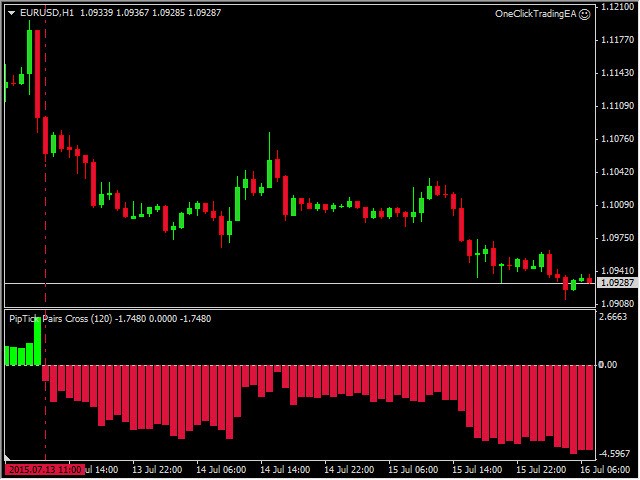
- The histogram has changed color from red to green (cross above 0) - BUY Pair 1, SELL Pair 2
- The histogram has changed color from green to red (cross below 0) - SELL Pair 1, BUY Pair 2
To increase the success of signals, we also recommend applying some additional filters, such as the Heikin Ashi indicator.
Suitable currency pairs
- EURUSD vs. USDCHF
- GBPUSD vs. USDCHF
- AUDUSD vs. USDCHF
- EURUSD vs. USDCAD
- AUDUSD vs. USDCAD
Main features
- The indicator compares the strength of two inversely correlated currency pairs.
- The signal line for entering or exiting the trades.
- Works on every timeframe (M1, M5, M15, M30, H1, H4, D1, W1, MN).
- The indicator is non-repainting.
- Ready for backtesting (customizable look-back period).
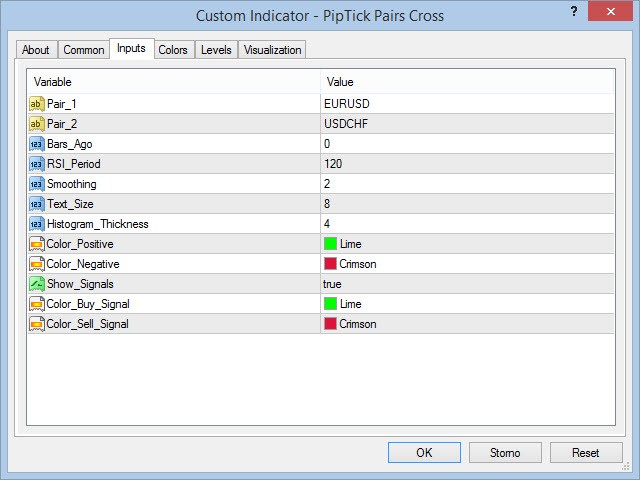
- Customizable parameters (Colors, Line thickness, RSI period...).
- High-speed calculation.
- The indicator works with prefixes and suffixes of symbols as well (EURUSD.m, EURUSD-pro...).
- Available for MT4 and MT5.