
Custom Panel
- Indikatoren
-
Marcin Konieczny
 Marcin Konieczny - Soft4FX
High-quality trading solutions for Metatrader 4
Indicators, simulators, scripts and more...
http://soft4fx.com - Version: 1.2
- Aktualisiert: 7 November 2018
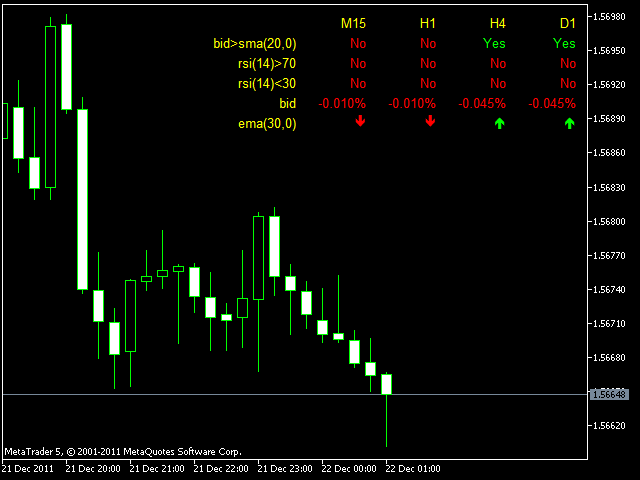
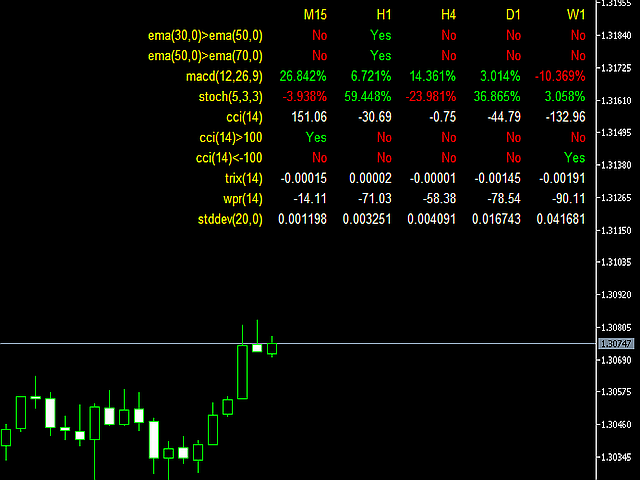
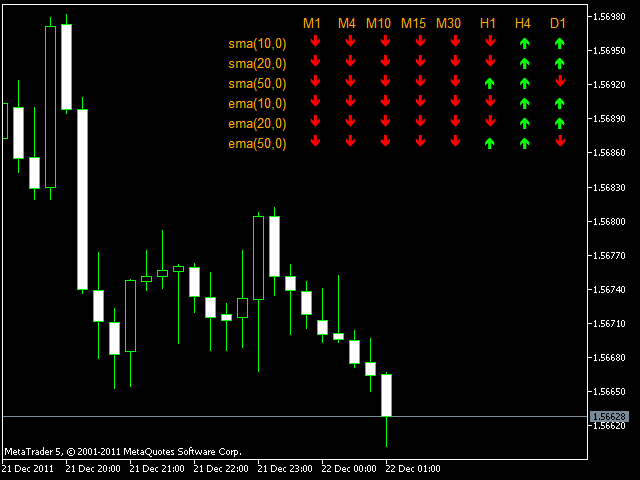
Mit dem benutzerdefinierten Panel können Sie alle wichtigen Informationen sammeln und sie in einer praktischen Tabelle in der oberen rechten Ecke des Diagramms anzeigen.
Sie können den Inhalt der Tabelle selbst bestimmen. Jede Zeile zeigt Ihre eigene Bedingung oder Ihren eigenen Wert an. Jede Spalte zeigt einen anderen Zeitrahmen an. Das Panel kann bis zu 10 Zeilen und bis zu 8 Spalten enthalten.
Beispielhafte Verwendung
Zeile: Preis > EMA(30)
Modus: YES_NO
Bedeutung: liegt aktueller Kurs über EMA(30)
Zeile: Ask < Bands[L]
Modus: YES_NO
Bedeutung: liegt der aktuelle Briefkurs unter dem unteren Bollinger Band
Zeile: CCI(16)
Modus: PERCENT
Bedeutung: Wie hoch ist die prozentuale Veränderung des CCI(16) im Vergleich zum vorherigen Bar Close?
Zeile: MACD[S](12,20,10)
Modus: ARROWS
Bedeutung: Ist die Signallinie des MACD(12,20,10) aufwärts oder abwärts gerichtet?
Zeile: Stoch[M] > Stoch[S]
Modus: YES_NO
Bedeutung: liegt die Stochastik-Hauptlinie über der Stochastik-Signallinie
Zeile: Bid
Modus: ÄNDERUNG
Bedeutung: Wie hoch ist die Veränderung des Geldkurses gegenüber dem Schlusskurs des vorherigen Balkens?
Ausführliche Informationen
Jede Zeile des Panels kann in einem von 5 Modi arbeiten:
- YES_NO - zeigt YES oder NO an, basierend auf Ihrer benutzerdefinierten Bedingung (z.B. Preis > SMA(30), RSI(14) < 30, EMA(5) > EMA(10), ...). Sie können die Operatoren '<', '>' und '=' verwenden.
- WERT - zeigt einfach den aktuellen Wert eines Indikators oder des aktuellen Preises an
- ÄNDERUNG - zeigt die Änderung des Preises oder des Indikatorwertes zwischen dem vorherigen und dem aktuellen Balken anPERCENT - wie im Modus ÄNDERUNG, aber in Prozent angezeigt
- PFEILE - wie im Modus ÄNDERN, jedoch wird nur der Pfeil nach oben oder unten angezeigt
Im Modus YES_NO muss genau ein Operator (<,>,=) verwendet werden. In allen anderen Modi sind Operatoren verboten.
Das Panel unterstützt die folgenden integrierten Indikatoren:
- Gleitende Durchschnitte(SMA, EMA, SMMA und LWMA)
- Relative Stärke Index (RSI)
- Rohstoff-Kanal-Index (CCI)
- MACD
- Stochastischer Oszillator (Stoch)
- Parabolischer SAR
- Williams Percent Range (WPR, %R)
- Dreifacher Exponentialer Durchschnitt (TRIX)
- Bollinger Bänder
- Standardabweichung (StdDev)
- Durchschnittliche wahre Spanne (ATR)
- Momentum-Oszillator (MOM)
- Relativer Vigor-Index (RVI)
- Durchschnittlicher direktionaler Bewegungsindex (ADX)
Das Panel erkennt nur die folgenden Funktionen. Die Groß- und Kleinschreibung spielt keine Rolle. Die in Klammern angegebenen Parameter können weggelassen werden. Die Parameter, die nicht angegeben werden, werden auf Standardwerte gesetzt. Zum Beispiel ist es möglich, nur den ersten oder den ersten und den zweiten oder alle drei oder keinen anzugeben.
- P oder PRICE oder BID -> zeigt den Geldkurs an
- ASK -> zeigt den Briefkurs an
- beliebige Zahl, z.B. 20, 1.4506, -100, ...
- CCI(Zeitraum)
- RSI(Zeitraum)
- MACD(fast ema, slow ema, macd ema) -> zeigt MACD Hauptlinie
- MACD[M](fast ema, slow ema, macd ema) -> zeigt die MACD-Hauptlinie
- MACD[S](fast ema, slow ema, macd ema) -> zeigt die MACD-Signallinie
- MA(Periode, Verschiebung) -> zeigt standardmäßig SMA an
- SMA(Zeitraum, Verschiebung)
- EMA(Zeitraum, Verschiebung)
- SMMA(Zeitraum, Verschiebung)
- LWMA(Zeitraum, Verschiebung)
- STOCH(%K, %D, Verlangsamung) -> zeigt die stochastische Hauptlinie
- STOCH[M](%K, %D, Verlangsamung) -> zeigt die stochastische Hauptlinie
- STOCH[S](%K, %D, Verlangsamung) -> zeigt die stochastische Signallinie
- SAR(Schritt, Maximum) oder PSAR(Schritt, Maximum) -> zeigt den Parabolic SAR
- WPR(Zeitraum) oder %R(Zeitraum)
- TRIX(Zeitraum)
- BANDS[U](Periode, Verschiebung, Abweichung) oder BB[U](Periode, Verschiebung, Abweichung) -> zeigt oberes Bollinger Band
- BANDS[L](Periode, Verschiebung, Abweichung) oder BB[L](Periode, Verschiebung, Abweichung) -> zeigt das untere Bollinger Band
- STDDEV(Zeitraum, Verschiebung) oder DEV(Zeitraum, Verschiebung)
- ATR(Zeitraum)
- MOM(Zeitraum)
- RVI(Periode) oder RVI[M](Periode) -> zeigt RVI Hauptlinie
- RVI[S](Zeitraum) -> zeigt die RVI-Signallinie
- ADX(Periode) -> zeigt die Hauptlinie des ADX
- ADX[DI+](Periode) -> zeigt die DI+ Linie
- ADX[DI-](Periode) -> zeigt die DI-Linie


I just love it! Simple to configure, very versatile, small size. Great work! Thanks