Konstenfreie technische Indikatoren für den MetaTrader 5 - 2
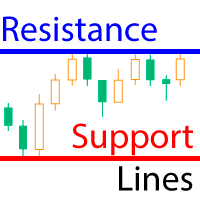
Der Indikator berechnet fraktale Linien, die technisch gesehen psychologische Unterstützungs-/Widerstandslinien sind. Es handelt sich dabei um die Höchst- und Tiefststände des Preises über einen bestimmten Zeitraum. Der Indikator funktioniert auf allen Charts und Zeitrahmen. Diese kostenlose Version des Resistance Support Lines Pro Indikators kommt so wie sie ist! Einstellungen: Diese Einstellungen können in dieser Version nicht geändert werden Fractal Candels = 5 - die Anzahl der Candlesticks,
FREE

Der RSI-Divergenz-Indikator findet Divergenzen zwischen dem Kurschart und dem RSI-Indikator und informiert Sie mit Warnungen (Popup, mobile Benachrichtigung oder E-Mail). Seine Hauptaufgabe besteht darin, Trendumkehrungen im Chart zu finden. Verwenden Sie die Divergenz-Indikatoren immer zusammen mit anderen technischen Hilfsmitteln wie Unterstützungs- und Widerstandszonen, Candlestick-Mustern und Preisaktionen, um eine höhere Wahrscheinlichkeit zu haben, Trendumkehrungen zu finden. Drei Bestätig
FREE
Anzeige der Zeit bis zum Ende der Kerze. Zeigt die Zeit bis zum Ende der Kerze sowie die Serverzeit an. Text kann den Trend oder die Richtung der Kerze anzeigen, akustische Benachrichtigungen sind integriert Besonderheiten:
Zeigt die Zeit bis zum Ende der aktuellen Kerze sowie andere Zeitrahmen an, die bei Bedarf angepasst oder deaktiviert werden können AW Candle Time kann die Richtung der aktuellen Kerze oder des Trends mit dem AW Super Trend Indikator auswählen Die Trendstrategie wird in der a
FREE
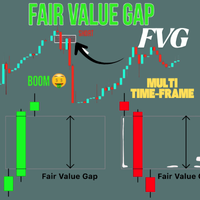
Crystal FVG Touch Detector – Professioneller Smart Money Indicator Crystal FVG Touch Detector ist ein professioneller Indikator für Trader, die mit Smart Money Concepts (SMC) und ICT handeln.
Er erkennt automatisch Fair Value Gaps (FVG) in allen Zeitrahmen und zeigt sie mit Farbzonen und Berührungsanzeige an.
Dank seiner nicht-neu-zeichnenden Logik zeigt er institutionelle Ungleichgewichte in Echtzeit. Hauptmerkmale Präzise Erkennung von bullischen und bärischen FVGs. Sofortige Aktualisierung be
FREE
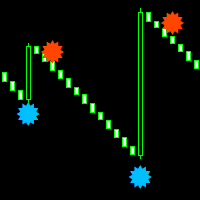
Boom- und Crash-Smasher kostenloser Indikator, der auf allen Zeitrahmen von einer Minute bis zum monatlichen Zeitrahmen funktioniert. Der Indikator ist 100% nicht nachgemalt. der Indikator kommt mit akustischen Alarmen und E-Mail-Push-Benachrichtigung der Indikator erscheint auf der aktuellen Kerze Stick für schnellere Einträge kann auf allen Charts und Renko-Charts verwendet werden der orange Punkt ist Ihr Verkaufssignal der blaue Punkt ist Ihr Kaufsignal
FREE

[ Mein Kanal ] , [ Meine Produkte ]
Dieser Indikator zeigt die Punkte, an denen sich der Trend einer Kerze aufgrund eines plötzlichen Drucks ändert, während sich der allgemeine Trend nach oben oder unten bewegt. Der vom Indikator angezeigte Pfeil wird gezeichnet, wenn die vorherige Kerze bestimmte Kriterien erfüllt. Beim Erstellen Ihrer Strategie können Sie 3-4 aufeinanderfolgende Pfeile als potenzielles Ausbruchssignal interpretieren. Wenn beispielsweise der vierte Pfeil erscheint, können Sie
FREE

Expert Advisor Version (EA) Wenn Sie automatisierten Handel anstelle von manuellen Signalen bevorzugen, finden Sie die Expert Advisor-Version dieses Indikators hier:
https://www.mql5.com/en/market/product/148222 Dieser Indikator berechnet Preis-Wiedereinstiegszeitpunkte (ReEntry), nachdem eine Kerze außerhalb der Bollinger-Bänder ausgebrochen ist, und kombiniert dieses Signal mit einer RSI-Bestätigung , um Fehlalarme zu reduzieren.
Ein Buy ReEntry -Signal wird erkannt, wenn der Preis zuvor unter
FREE

Der Indikator "Haven Key Levels PDH PDL" hilft Tradern, Schlüsselniveaus auf dem Chart zu visualisieren. Er markiert automatisch die folgenden Niveaus: DO (Daily Open) — Tageseröffnung. NYM (New York Midnight) — New Yorker Mitternacht. PDH (Previous Day High) — Hoch des Vortages. PDL (Previous Day Low) — Tief des Vortages. WO (Weekly Open) — Wocheneröffnung. MO (Monthly Open) — Monatseröffnung. PWH (Previous Week High) — Hoch der Vorwoche. PWL (Previous Week Low) — Tief der
FREE

Die Moving Average Convergence Divergence (MACD) Handelsstrategie ist ein beliebtes technisches Analysewerkzeug, das verwendet wird, um Änderungen im Momentum und in der Trendrichtung zu identifizieren. Der MACD wird berechnet, indem man den 26-Perioden-exponentiellen gleitenden Durchschnitt (EMA) vom 12-Perioden-EMA subtrahiert. Eine 9-Perioden-EMA, genannt "Signal Line", wird dann oben auf den MACD geplottet, um als Auslöser für Kauf- und Verkaufssignale zu fungieren. Der MACD wird als bullish
FREE
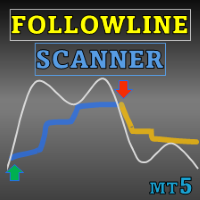
Special offer : ALL TOOLS , just $35 each! New tools will be $30 for the first week or the first 3 purchases ! Trading Tools Channel on MQL5 : Join my MQL5 channel to update the latest news from me Maximieren Sie Ihren Handelsvorteil mit Follow Line MT5 mit Scanner, einem fortschrittlichen, auf Volatilität basierenden Indikator, der für ernsthafte Trader entwickelt wurde. Dieses Tool kombiniert die Kraft der Bollinger Bänder mit anpassbaren Einstellungen und bietet präzise Einblick
FREE

Crystal Volume Indicator – Intelligentes Volumen-Analyse-Tool für MT5 Crystal Volume ist ein fortschrittlicher und dennoch benutzerfreundlicher Volumen-Indikator, der Tradern hilft, die verborgene Stärke hinter Preisbewegungen visuell zu interpretieren. Durch die Kombination von Preisaktionen mit Volumendynamik hebt dieses Tool wichtige Volumenereignisse wie Buying Climax , Selling Climax und Schwache Kerzen hervor. Hauptfunktionen: Echte Volumenanalyse – Unterstützt Tick- und Echtzeitvo
FREE

Beherrschen Sie Markttrends mit dem SuperTrend Alert MT5, einem leistungsstarken Indikator, der präzise Trendfolgesignale für den Handel mit Forex, Aktien, Kryptowährungen und Rohstoffen liefert. In Handelsgemeinschaften wie Forex Factory und Reddit’s r/Forex gefeiert und in Diskussionen auf Investopedia und TradingView für seine robuste Trenddetektion gelobt, ist dieser Indikator ein unverzichtbares Werkzeug für Trader, die zuverlässige Ein- und Ausstiegspunkte suchen. Nutzer berichten von bis
FREE
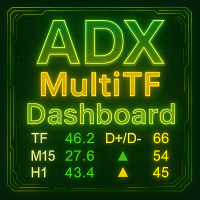
ADX MultiTF Dashboard Übersicht ADX MultiTF Dashboard ist ein Multi-Zeitrahmen-Indikator, der wichtige Informationen über Trendstärke und -richtung gleichzeitig über drei ausgewählte Zeitrahmen anzeigt. Der Indikator präsentiert die Daten in einem kompakten Dashboard-Format und zeigt ADX-Werte, Richtungsbewegungsindikatoren und RSI-Messwerte für eine umfassende Marktanalyse. Das Dashboard liefert kritische Informationen für Handelsentscheidungen, einschließlich der durch ADX gemessenen Trendstär
FREE

ECHTES ANTI-SPIKE-DERIVAT
Find the user manual here, as well as settings fro boom 1000, crash 500, crash 1000 https://t.me/automated_TLabs DM: https: //t.me/gg4rex
Professioneller Indikator zur Erkennung von Umkehrbewegungen Fortschrittliches Multi-Timeframe Reversal Detection System für Boom & Crash Indizes
Laden Sie hier das Benutzerhandbuch des Produkts herunter:
WAS IST TRUE ANTI-SPIKES? True Anti-Spikes ist ein präzisionsgefertigter Umkehrindikator, der speziell für synthetische Boom
FREE

Wir stellen Ihnen unseren aufregenden neuen Price Retest-Indikator vor! Erhalten Sie sofortige Warnungen, wenn der Kurs einen Retest durchführt, und verschaffen Sie sich so einen entscheidenden Vorteil in Ihrer Handelsstrategie. Denken Sie daran, Ihre eigene Analyse durchzuführen, bevor Sie irgendwelche Bewegungen auf dem Markt machen. MT4-Version - https://www.mql5.com/en/market/product/118031 Melden Sie sich an, um Markttiefe zu lernen - h ttps:// www.mql5.com/en/channels/suvashishfx
Hier fin
FREE

Der Indikator zeichnet Trendlinien im Diagramm. Dieser Indikator hat sechs Eingänge. Der Benutzer kann alternative Beschriftungen für beide Zeilen angeben. Wenn mehrere Instanzen des Indikators verwendet werden, müssen sich die Beschriftungen unterscheiden. Der Benutzer kann die Breite und Farbe der Linien und die Tiefe festlegen, um festzulegen, welche signifikanten Peaks verwendet werden sollen. Zum Beispiel setzt Depth = 10 Trendlinien unter Verwendung der aktuellen Spitzen und Täler, die rec
FREE
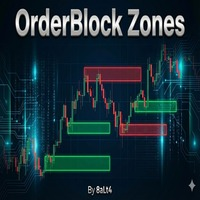
Übersicht OrderBlock Zone ist ein fortschrittlicher MetaTrader 4-Indikator, der automatisch Order Blocks (Order-Blöcke) auf dem Markt erkennt und visualisiert. Er verfolgt die Spuren großer Akteure (Banken, Hedgefonds) und ermittelt potenzielle Unterstützungs- und Widerstandsniveaus.
Hauptmerkmale Automatische OrderBlock-Erkennung Fraktalbasierte Analyse: Bestimmt starke Wendepunkte mit einer 36-Perioden-Fraktalanalyse (anpassbar) Bull & Bear Zones: Grüne Pfeile markieren steigende, rote Pfeil
FREE
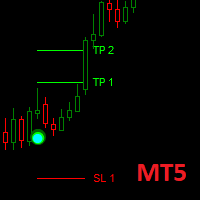
Dark Point ist ein Indikator für den Intraday-Handel. Dieser Indikator basiert auf einer Trendfolgestrategie , die auch die Verwendung des atr zur Bestimmung der richtigen Volatilität vorsieht. Mit diesem Indikator können wir bei guten Preisen einsteigen, um dem starken Trend des aktuellen Instruments zu folgen. If you love Dark Point, consider adding some power: Dark Power
Wichtigste Vorteile
Leicht sichtbare Gewinnmitnahme-/Stop-Loss-Linien Intuitive Richtungspunkte/Pfeile durch Farben Nützli
FREE

Setup Tabajara wurde von einem brasilianischen Händler namens "The OGRO of Wall Street" erstellt.
Die Idee dieses Setups besteht darin, dem Händler den aktuellen Trend der Preise und die Art der Operation anzuzeigen, nach der in der Grafik gesucht werden sollte.
Betrieb Dies geschieht durch die Positionierung des Schließens der Kerzen und des VWAP bis 10:40 Uhr und danach durch das arithmetische Mittel von 20 Perioden, die die Kerzen in 4 möglichen Farben bemalen: Grün -> Preis steigt im Aufw
FREE

MT4 version | Owl Smart Levels Indikator | Owl Smart Levels-Strategie | FAQ
Der Fractals Indikator ist eines der Elemente der Handelsstrategie des Autors von Bill Williams . Es wird verwendet, um nach Preisumkehrpunkten auf dem Preisdiagramm und folglich nach Unterstützungs- und Widerstandsniveaus zu suchen. Der Full Fractals Indikator ist ein verbesserter Fractals, der im Toolkit fast aller Handelsterminals verfügbar ist. Der einzige Unterschied besteht darin, dass wir zum
FREE
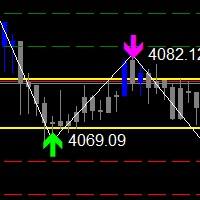
Der Zigzag-Preispfeil-Indikator ist eine verbesserte Version des klassischen Zigzag-Indikators, die das traditionelle Zickzack-Muster mit fortschrittlichen visuellen Funktionen kombiniert. Er identifiziert nicht nur wichtige Wendepunkte im Markt, sondern liefert auch klare Handelssignale durch: - Richtungspfeile: Farbige Pfeile (grün für Kauf, magenta für Verkauf) zeigen mögliche Trendrichtungen an.
- Preisbeschriftungen: Zeigt die genauen Preiswerte an jedem Pivot-Punkt direkt im Chart an.
- V
FREE
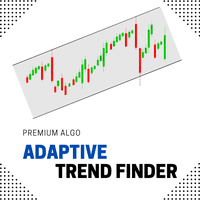
Wir stellen den Adaptive Trend Finder vor, einen innovativen Forex-Indikator, der automatisch Trendlinien identifiziert und mit höchster Genauigkeit zeichnet. Dieses leistungsstarke Tool wurde entwickelt, um sich an veränderte Marktbedingungen anzupassen. Es hilft Händlern, die wichtigsten Trends zu erkennen, um aufkommende Chancen zu nutzen und die Stärke der laufenden Marktbewegungen zu bestätigen. Der Adaptive Trend Finder nutzt fortschrittliche Algorithmen, um den Markt nach entscheidenden K
FREE
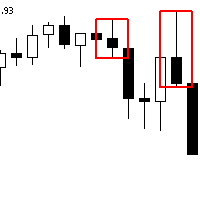
Der Advanced Order Block Indicator für MetaTrader 5 wurde entwickelt, um die technische Analyse zu verbessern, indem er signifikante Orderblöcke identifiziert, die Liquidität abziehen und beim Wegdrücken Fair Value Gaps (FVG) erzeugen. Dieser Indikator ist ideal für Händler, die sich auf institutionelle Handelskonzepte konzentrieren und fortgeschrittene Orderflow- und Preisaktionsstrategien in ihre Handelsroutine einbauen möchten. Überblick Identifizierung von Orderblöcken : Ein Orderblock stell
FREE
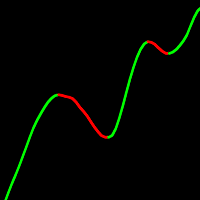
Gleitender Durchschnitt mit enormen Anpassungsmöglichkeiten. 10 arten von glättung. 12 preisoptionen für den Aufbau. Möglichkeit der Abtastung des resultierenden Movings. Schneller Code. Die Möglichkeit, in Experten ohne Einschränkungen zu verwenden. Der UniversalMA-Indikator kombiniert die am meisten nachgefragten Konstruktionsmethoden, die im modernen Handel verwendet werden. Auf diese Weise müssen Sie nicht mehr viele verschiedene Indikatoren haben. Indikatorbasierter Expert Advisor Gleitende
FREE

Der Indikator erkennt, wenn eine Divergenz zwischen dem Preis und einem Indikator oder Oszillator auftritt. Er identifiziert sowohl regelmäßige als auch versteckte Divergenzen. In Kombination mit Ihren eigenen Regeln und Techniken können Sie mit diesem Indikator Ihr eigenes leistungsstarkes System erstellen (oder verbessern). Für Setups mit höherer Wahrscheinlichkeit kann ich Ihnen empfehlen, meinen Supply Demand Indikator zu verwenden und nur zu handeln, wenn die Divergenz innerhalb einer Zone
FREE

Haven Stop Loss Hunter Indicator
Präzises Werkzeug zur Analyse von Schlüsselbereichen. Entwickelt für Trader, die die Preisdynamik besser verstehen und ihre Handelsentscheidungen verbessern möchten.
Weitere Produkte -> HIER Hauptfunktionen: Hilft, schnell wichtige Preisextreme zu finden.
Identifizierung von potenziellen Ausbruchsniveaus (Sweep)
Erkennt Momente, in denen der Preis versucht, ein Niveau zu durchbrechen, es aber nicht schafft, und signalisiert eine mögliche Umkehr oder Fortsetzu
FREE

Position Size Calculator Lite MT5 – Kostenloser Risiko-Management-Indikator Wichtig Wenn Sie interaktive Stop-Loss- und Take-Profit-Zonen benötigen (Verschieben mit der Maus auf dem Chart), sowie ein erweitertes Panel mit Margin-Anzeige, Break-Even und detaillierten Risikokennzahlen, suchen Sie im Market nach: Position Size Calculator PRO MT5 . Diese Lite-Version ist eine kostenlose und vereinfachte Edition, die auf die Berechnung der Positionsgröße spezialisiert ist. Überblick Der Position Size
FREE
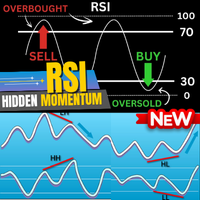
The Real RSI – Professioneller Divergenz-Indikator Übersicht The Real RSI ist ein professioneller Indikator zur Erkennung von Divergenzen, entwickelt für Trader, die institutionelle Präzision bei der Identifizierung von auf RSI basierenden Umkehr- und Fortsetzungssignalen suchen.
Er erkennt automatisch reguläre und versteckte Divergenzen zwischen Preis und RSI und bestätigt jedes Setup mithilfe einer intelligenten Pivot-Logik und einer Echtzeit-Strukturvalidierung.
Dieser Indikator wurde für Gen
FREE

Funktionen
Indikator für Fibonacci-Retracement-Handel Ein Fibonacci-Diagramm wird basierend auf der vorherigen ausgewählten Kerze von 1H, 4H, 1D und 1W gezeichnet. Wenn der Marktpreis das Fibonacci-Niveau berührt, ändert sich die Farbe und die Berührungszeit wird angezeigt. Das Fibonacci-Diagramm wird bei den Niveaus -23.6, 0, 23.6, 38.2, 50, 61.8, 76.4, 100 und 123.6 gezeichnet und das Diagramm wird aktualisiert, wenn die Kerze aktualisiert wird.
Variablen
Zeitrahmen: Ein Fibonacci-Diagramm
FREE

Institutional Tick Engine Lite: Tick-Geschwindigkeits- & Umkehr-Tool Institutional Tick Engine Lite ist ein technischer Indikator zur Analyse der Marktgeschwindigkeit und der Mikrostrukturlogik unter Verwendung von Roh-Tick-Daten. Er verarbeitet Echtzeitdaten und liefert Metriken für Scalping und Daytrading. Enthaltene Funktionen Tick-Geschwindigkeitsmonitor: Echtzeit-Histogramm, das "Ticks pro Sekunde" (TPS) anzeigt. Umkehrsignale (Lite): Identifiziert Umkehrpunkte basierend auf Mikrostruktur-E
FREE
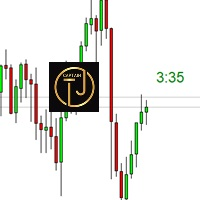
Der CTJM Candle Timer Indicator ist ein robustes Tool, das für Trader entwickelt wurde, die MetaTrader 5 verwenden. Es wurde mit Präzision entwickelt und zeigt die verbleibende Zeit für die aktuelle Kerze auf einem Handelsdiagramm an, so dass Händler den Markt effektiver überwachen und zeitnahe Entscheidungen treffen können. Mit einer anpassbaren visuellen Schnittstelle können die Benutzer Farben, Schriftgröße und Positionierung nach ihren Wünschen einstellen. Zu den wichtigsten Funktionen dies
FREE
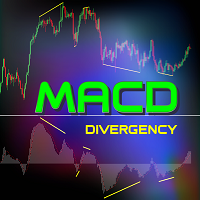
Dieser Indikator erkennt präzise bullishe und bearishe Divergenzen zwischen Kursbewegungen und dem MACD-Histogramm unter Verwendung exponentieller gleitender Durchschnitte (EMA) mit Perioden von 5 (schnell) und 34 (langsam) sowie einer Signallinie mit Periode 5. Der Indikator hebt Punkte hervor, an denen Momentum nachlässt, und signalisiert mögliche Trendwenden. Regeln zur korrekten Divergenz-Erkennung: Bullishe Divergenz ist gültig, wenn der Kurs tiefere Tiefs bildet und das MACD-Histogramm gle
FREE

Der Indikator analysiert die Volumenskala und teilt sie in zwei Komponenten auf - Verkäufer- und Käufervolumen - und berechnet außerdem das Delta und das kumulative Delta. Der Indikator flackert nicht und wird nicht neu gezeichnet, seine Berechnung und Darstellung erfolgen relativ schnell, wobei die Daten der kleineren (im Vergleich zum aktuellen) Zeiträume verwendet werden. Die Betriebsmodi des Indikators können über die Eingangsvariable Modus umgeschaltet werden: Kaufen - zeigt nur die Käuferv
FREE

Der Consolidation Zone Indicator ist ein leistungsfähiges Instrument, mit dem Händler Konsolidierungsmuster auf dem Markt erkennen und nutzen können. Dieser innovative Indikator erkennt Konsolidierungsbereiche und gibt rechtzeitig Warnmeldungen aus, wenn der Kurs diese Zonen über- oder unterschreitet, so dass Händler fundierte Handelsentscheidungen treffen können. MT4 Version : https://www.mql5.com/en/market/product/118734 Beitreten und Markttiefe lernen - h ttps:// www.mql5.com/en/channels/suv
FREE
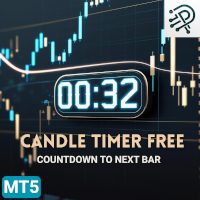
Dieser Indikator zeigt die verbleibende Zeit bis zur Schließung der aktuellen Kerze auf einem MT5-Chart an. Er funktioniert auf ausgewählten Intraday-Zeitfenstern und bietet eine klare, stabile Anzeige. Merkmale Countdown-Timer für Kerzenschluss auf M1-, M15- und H1-Charts Feste Position, Schriftart und Farben für einfache Lesbarkeit Informative Kopfzeilen und Beschriftungen Automatische Entfernung von Diagrammobjekten, wenn sie abgetrennt werden Leichte modulare Struktur für zuverlässige Leistu
FREE
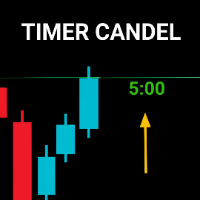
Timer Candle MT5 ist ein leichtgewichtiger Indikator, der einen Countdown-Timer anzeigt, bis die aktuelle Kerze geschlossen wird. Dieser Indikator hilft visuellen Händlern, die verbleibende Zeit bis zum Schließen der Kerze zu überwachen, insbesondere auf niedrigeren Zeitrahmen. Hauptmerkmale: Countdown-Anzeige im Sekunden- oder Minuten:Sekunden-Format. Die Textfarbe ändert sich automatisch, wenn sich der Countdown den letzten Sekunden nähert (Warnfarbe). Der Text wird zur besseren Lesbarkeit fe
FREE

Auto Fibo ist ein Indikator, der entwickelt wurde, um Ihren manuellen Handel zu verbessern. Er zeichnet den Goldenen Schnitt automatisch, spart Ihnen Zeit und erleichtert Ihren Handel. Wenn Sie den Indikator an das Diagramm anhängen, zeichnet er automatisch den exakten Goldenen Schnitt ein und erspart Ihnen die Suche nach dem kritischen Punkt. Die Schnittstelle passt sich an Ihren Computer an, um die ungefähren Hoch- und Tiefpunkte des Bandes zu ermitteln. Dieser Indikator korrigiert die meis
FREE

Dieser Indikator gehorcht dem beliebten Spruch, dass: "DER TREND IST DEIN FREUND". Er malt eine GRÜNE Linie für KAUFEN und eine ROTE Linie für VERKAUFEN. (Sie können die Farben ändern). Er gibt Alarme und Warnungen aller Art aus. Es wiederholt sich nicht und kann für alle Währungspaare und Zeitrahmen verwendet werden. Ja, so einfach und simpel ist das. Selbst ein Neuling kann damit großartige und zuverlässige Geschäfte machen. NB: Die besten Ergebnisse erzielen Sie mit meinen anderen Premium-Ind
FREE

Crystal Quantum Flow
Fortschrittlicher Marktintelligenz-Indikator Crystal Quantum Flow ist ein professioneller Trading-Indikator der nächsten Generation, entwickelt für Trader, die Klarheit, Präzision und ein Marktverständnis auf institutionellem Niveau verlangen.
Dieser Indikator wurde als vollständiges Entscheidungsunterstützungssystem konzipiert und kombiniert multidimensionale Marktflussanalyse, synchronisierte Multi-Timeframe-Intelligenz und fortschrittliche visuelle Interpretation in eine
FREE

Pivot Point Fibo RSJ ist ein Indikator, der die Unterstützungs- und Widerstandslinien des Tages mithilfe von Fibonacci-Kursen verfolgt.
Dieser spektakuläre Indikator erzeugt bis zu 7 Unterstützungs- und Widerstandsebenen durch Pivot Point unter Verwendung von Fibonacci-Kursen. Es ist fantastisch, wie die Preise jedes Niveau dieser Unterstützung und dieses Widerstands respektieren, wo es möglich ist, mögliche Einstiegs- / Ausstiegspunkte einer Operation zu erkennen.
Merkmale Bis zu 7 Unterstü
FREE

Der Supertrend-Indikator wurde ursprünglich von einem französischen Kollegen namens Olivier Seban entwickelt und hat zum Ziel, den Haupttrend der Kurse zu ermitteln. Seine Berechnung ist einfach und basiert auf dem Durchschnitt der Höchst- und Tiefstwerte, zu denen wir die Volatilität eines bestimmten Zeitraums plus einen Multiplikator addieren. Auf diese Weise erhalten wir die Supertrendlinie. Im Internet finden Sie mehrere Ansätze und Handelsstrategien, die diesen sehr nützlichen Indikator ver
FREE

Entwickelt von smart2trader.com Smart Super Trend ist ein fortschrittlicher Trendindikator, der bullische und bearische Marktbewegungen mit hoher Präzision erkennt. Der Smart Super Trend-Indikator verwendet adaptive Algorithmen in Kombination mit Volatilitätsfiltern und liefert saubere Signale, die mit der realen Preisdynamik übereinstimmen. Darüber hinaus verfügt er über ein intelligentes Überwachungssystem, das Sie in Echtzeit benachrichtigt, sobald ein Trendwechsel eintritt, und Ihnen hilft,
FREE

Dieser Indikator zeichnet Angebots- und Nachfragezonen in das Diagramm ein. In Kombination mit Ihren eigenen Regeln und Techniken können Sie mit diesem Indikator Ihr eigenes leistungsstarkes System erstellen (oder verbessern). Bitte sehen Sie sich auch die kostenpflichtige Version an, die viel mehr bietet. Ich empfehle, nach Handelsmöglichkeiten zu suchen, bei denen der erste Zonentest nach mindestens 25 Balken erfolgt. Merkmale Die Zonen haben 3 Farben (durch Eingabe einstellbar). Dunkle Fa
FREE

Der beliebte "SuperTrend" Indikator ist ein technisches Analysetool, das hilft, die Richtung eines Trends und mögliche Ein- oder Ausstiegspunkte auf den Finanzmärkten zu identifizieren. Der Indikator basiert auf der Average True Range (ATR), die die Marktvolatilität basierend auf Preisspannen misst. Er ist auf anderen Plattformen kostenlos verfügbar, und hier sollte keine Ausnahme gemacht werden! Er wird in der Regel auf drei Arten verwendet: Um den aktuellen Trend zu identifizieren: Wenn der Pr
FREE

Dieser Indikator zeigt Fractal Breakout Trendlinien und Support und Resistance
Die Fractal Ascending Trendline und die Fractal Descending Trendline werden von den letzten gültigen Fraktalen abgeleitet. Ausbrüche können über oder unter diesen Trendlinien erfolgen. Horizontale Linien werden aus dem letzten oberen und dem letzten unteren Fraktal gezeichnet, um Unterstützungs- und Widerstandsniveaus anzuzeigen. Horizontale obere und untere Schnittlinien werden dort gezeichnet, wo eine fraktale Tre
FREE

Prüfen Sie auch meinen Premium-Spikes-Bot: https://www.mql5.com/en/market/product/142350 Prüfen Sie auch meinen Premium-Spikes-Bot: https://www.mql5.com/en/market/product/142350 Prüfen Sie auch meinen Premium-Spikes-Bot: https://www.mql5.com/en/market/product/142350 MEGASPIKES BOOM AND CRASH v1.32 NB: Quellcodes dieses Indikators sind verfügbar: PM me: https://t.me/Machofx BITTE TRETEN SIE DEM KANAL UNTEN BEI, UM ZUGANG ZU ALLEN FRÜHEREN VERSIONEN ZU HABEN siehe Spikes Roboter
BoomCrash Cheatco
FREE

The Oracle ist der perfekte Begleiter für Trader, die präzise Marktanalysen benötigen, ohne mehrere Indikatoren verwalten zu müssen.
Während die meisten Indikatoren nur einzelne Signalperspektiven zeigen, vereint The Oracle wissenschaftlich bewährte Methoden mit proprietären Verbesserungen in einem Konsens-Histogramm. Sieben Modelle, darunter unser Ultimate Flow Index (UFI) mit Ehlers-Glättungsalgorithmen, stimmen unabhängig bei jeder Kerze ab.
Wenn genügend Modelle übereinstimmen – je nach S
FREE

Der Indikator ist für die Erkennung und Markierung von 1-2-3 Kauf- und Verkaufsmustern auf einem Chart bestimmt. Der Indikator hilft beim Handel, die Start- und Signalfraktale zu bestimmen und die möglichen Einstiegspunkte auf allen Zeitfenstern in МetaTrader 5 zu bestimmen. Fibonacci-Linien werden auf dem Chart eingezeichnet, um vermeintliche Ziele der Bewegung auf Basis der Wellentheorie anzuzeigen. Besonders wichtig scheinen die 1-2-3-Formationen zu sein, da sich Divergenzen (Konvergenzen) an
FREE
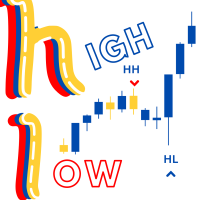
Swing Hoch/Tief Kennung
Der Swing High/Low Identifier ist ein benutzerdefinierter MetaTrader 5 (MT5) Indikator, der entwickelt wurde, um signifikante Swing-Punkte auf Ihrem Chart hervorzuheben. Dieser Indikator identifiziert und markiert Swing-Hochs und Swing-Tiefs auf der Grundlage einer konfigurierbaren Reihe von Bars.
- Swing Highs werden mit roten Pfeilen oberhalb der jeweiligen Kerzen markiert. - Schwungtiefs werden mit blauen Pfeilen unterhalb der entsprechenden Kerzen markiert.
Dieses
FREE

Kennen Sie die VWAP-Bänder? Es handelt sich um einen Indikator, der dazu dient, Unterstützungs- und Widerstandspunkte auf der Grundlage des täglichen VWAP zu ermitteln, und den Sie verwenden können, um die besten Einstiegs- und Ausstiegspunkte zu ermitteln. Dieser Indikator verwendet nicht das Prinzip der Bollinger-Bänder. Es gibt einen Unterschied in der Berechnungsmethode. Verwenden Sie ihn je nach Ihrer Strategie. Sehen Sie sich die Anwendungen und die Ergebnisse an, die Sie erhalten können.
FREE
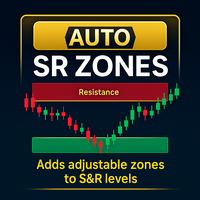
Unterstützungs-/Widerstandszone - Produktübersicht für MetaTrader 5 Übersicht Die Unterstützungs-/Widerstandszone ist ein intuitiver Indikator für MetaTrader 5 (MT5), der die technische Analyse verbessert, indem er automatisch anpassbare Zonen um horizontale Linien auf Ihrem Chart erstellt. Diese Zonen, die durch einen benutzerdefinierten Pip-Abstand definiert sind, heben visuell wichtige Unterstützungs- und Widerstandsbereiche hervor und helfen Tradern, wichtige Preisbereiche und potenzielle Um
FREE
Über Range Explosion Range Explosion ist ein leistungsstarkes und kostenloses Handelstool, das Marktbereiche erkennt, präzise Unterstützungs- und Widerstandszonen zeichnet und Breakout-Möglichkeiten mit Genauigkeit identifiziert.
Es ist Teil des Break Out Explosion Projekts und bietet sowohl Anfängern als auch professionellen Tradern eine zuverlässige und visuell fortschrittliche Lösung. Wenn Sie sich für Breakout-Trading interessieren, sehen Sie sich das fortschrittliche Tool an, das Trendlinie
FREE
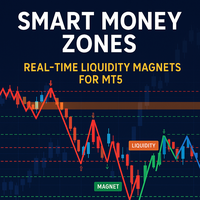
Der SM Zones-Indikator wurde nach den Prinzipien der Smart Money Management-Strategien entwickelt und ist ein sehr praktisches Tool für Händler auf der Plattform MetaTrader 5 (MT5). Er zeigt auf dem Chart grafisch alle wichtigen Zonen an, die in der SM-Strategie verwendet werden: Marktstruktur, Preisniveaus mit erhöhter Liquidität, "Preismagnet"-Zonen - Ungleichgewichte, Orderblöcke, fvg, Breaker-Blöcke und Mitigation-Blöcke -, auf die sich der Preis des Instruments zubewegt. Die Zonen, die den
FREE

EXTREME POI-Anzeige Join the telegram community for an exciting trading journey. https://t.me/automated_TLabs Professioneller Handelsindikator für MetaTrader 5/Metatrader 4
EXTREME POI ist ein fortschrittlicher Handelsindikator für institutionelle Anleger, der auf der Grundlage des Smart Money-Konzepts hochwahrscheinliche Points of Interest (POI) identifiziert. Der Indikator kombiniert mehrere hochentwickelte Techniken, um Bereiche zu erkennen, in denen institutionelle Händler wahrscheinlich
FREE

Kerzenzähler Dieser Indikator zählt Kerzen und zeigt ihre Anzahl basierend auf einem längeren Zeitraum an Langer Zeitraum Sie können den täglichen Zeitrahmen als " Bigger Timeframe " auswählen und ihn auf dem Chart mit dem kleinsten Zeitrahmen ausführen. dass der Zähler die Balken gemäß dem Tages-Chart zählt. Wenn Sie den Zeitrahmen " H1 " als Parameter übergeben, weiß der Indikator, wie Balken im H1-Diagramm zu zählen sind, er muss ihn nur auf Diagrammen mit kleineren Zeitrahmen ausführen. Der
FREE

Sind Sie es leid, Fibonacci-Levels manuell in Ihre Diagramme einzutragen? Suchen Sie nach einer bequemen und effizienten Möglichkeit, wichtige Unterstützungs- und Widerstandsniveaus in Ihrem Handel zu identifizieren? Suchen Sie nicht weiter! Wir stellen Ihnen DrawFib Pro vor, den ultimativen MetaTrader 5-Indikator, der automatische Fibonacci- Level durchführt Es greift auf Ihre Diagramme zurück und gibt rechtzeitige Warnungen aus, wenn diese Werte überschritten werden. Mit DrawFib
FREE
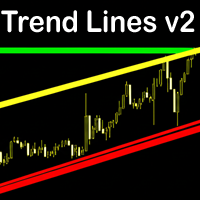
Trend Lines v2 MT5 ist ein intelligenter Auto-Trendlinien-Indikator, der wichtige dynamische Unterstützungs- und Widerstandszonen sofort erkennt. Der Indikator basiert auf der Pivot-Hoch/Tief-Struktur und bietet eine klare und präzise Sicht auf Markttrends über alle Zeitrahmen hinweg. Merkmale Vollautomatisches Zeichnen von Trendlinien auf der Grundlage präziser Pivot-Punkte. Filtert Rauschen heraus - nur saubere und zuverlässige Trendlinien werden angezeigt. Steuern Sie die Anzahl der Linien, u
FREE

Order Flow Lite ist ein Dienstprogramm für die technische Analyse zur Visualisierung von synthetischem Order Flow, Footprint Charts und Tick-Analysen unter Verwendung von Standard-Brokerdaten. Es hilft Händlern bei der Analyse der Delta-Logik und des Volumenprofils auf der Grundlage der jüngsten Kursbewegungen. Hauptmerkmale: Synthetischer Fußabdruck: Visualisiert Volumendaten für die letzten 3 geschlossenen Kerzen und bietet einen klaren Überblick über die aktuelle Marktstimmung. Tick-Delta: Z
FREE

Der Indikator dient der Umwandlung von normalem Volumen in Niveaus und der Bestimmung von Kontrollpunkten für die finanzielle Liquidität.
Er ist in seiner Funktion dem Fixed Volume Profile sehr ähnlich.
Er gilt jedoch als genauer und einfacher zu verwenden als der Indikator in Trading View, da er das gesamte Handelsvolumen jeder Kerze und aller in MetaTrade vertretenen Broker berechnet, im Gegensatz zum Indikator in Trading View, der nur die angezeigten Kurse des Brokers misst.
Um uns auf de
FREE
Engulfing Candle Signal Alert: Erhöhen Sie Ihre Handelsstrategie Erschließen Sie das volle Potenzial Ihres Handels mit dem Engulfing Candle Signal Alert, dem ultimativen Werkzeug zur Erkennung von Marktumkehrungen und zur Verbesserung Ihrer Handelspräzision. Dieser leistungsstarke Indikator wurde speziell für Händler entwickelt, die Wert auf Genauigkeit und rechtzeitige Warnungen legen. Er erkennt engulfing Candle-Muster, ein Schlüsselsignal in der technischen Analyse, das häufig eine potenziell
FREE
Beschreibung des Indikators Range Filter Pro ist ein hochentwickeltes Handelsinstrument für XAUUSD (Gold), das adaptive Preisfilterung mit Volumenanalyse und Marktbeobachtung in Echtzeit kombiniert. Dieser Indikator wurde sowohl für Anfänger als auch für professionelle Händler entwickelt und hilft durch seinen vielschichtigen Ansatz, Trendrichtungen, potenzielle Umkehrungen und bedeutende Marktbewegungen zu erkennen.
Wichtigste Komponenten 1. dynamischer Bereichsfilter 2. volatilitätsangepasst
FREE
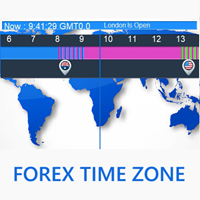
Kurze Einführung in Forex Time Zone Willkommen bei einem neuen kostenlosen professionellen Tool – Forex Time Zone ! Professionelle Trader wissen, wie wichtig die Zeit im Forex-Markt ist. Jede Sekunde öffnen einige Märkte weltweit, während andere schließen, was die Marktvolatilität beeinflusst und die Bewegungen einzelner Währungen beeinflusst. Dieses Tool hilft Tradern, leicht zu erkennen, welcher Markt gerade geöffnet ist und welche Zeitzone aktuell ist. Wie funktioniert es? Wählen Sie einfach
FREE

Haven Bar Replay — Ihr persönlicher Trading-Simulator Wir präsentieren Haven Bar Replay – einen professionellen Simulator für manuelles Trading und Strategietests. Dieses Tool verwandelt Ihren MT5-Chart in einen historischen Player, mit dem Sie Monate an Marktbewegungen in nur wenigen Minuten erleben können. Meine anderen Produkte ansehen -> HIER KLICKEN . Möchten Sie lernen, profitabel zu handeln, sind aber nicht bereit, stundenlang auf die Bildung von Setups zu warten? Dieses Tool wurde
FREE
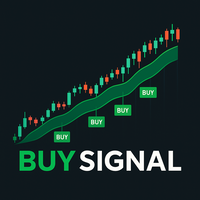
Dieser Indikator wurde als Analyseinstrument auf der Grundlage exponentiell gleitender Durchschnitte (EMA) entwickelt. Er soll zusätzliche Einblicke in die Marktdynamik bieten, indem er zwei exponentiell gleitende Durchschnitte (EMA) und einen geglätteten exponentiell gleitenden Durchschnitt (SMMA) verwendet. Der Indikator kann auf verschiedene Finanzinstrumente und Zeitrahmen angewandt werden, je nach den Präferenzen der Nutzer. Einige Händler verwenden ihn auf 30-Sekunden-Charts und ergänzen i
FREE

Haven HTF Candle – Die Kraft des höheren Zeitrahmens auf Ihrem Chart Wir stellen vor: Haven HTF Candle – ein leistungsstarkes Werkzeug, das Kerzen eines höheren Zeitrahmens (HTF) direkt auf Ihrem Arbeitschart anzeigt. Hören Sie auf, ständig zwischen den Fenstern zu wechseln, und beginnen Sie, den wahren Marktkontext zu sehen, der die Grundlage für fundierte Handelsentscheidungen ist. Weitere Produkte -> HIER . Hauptmerkmale und das "Power of 3"-Konzept Analyse nach dem "Power of 3"-Konzept (AMD
FREE

Free automatic Fibonacci ist ein Indikator, der automatisch ein Fibonacci-Retracement basierend auf der Anzahl der von Ihnen in der BarsToScan-Einstellung des Indikators ausgewählten Bars erstellt. Das Fibonacci-Retracement wird automatisch in Echtzeit aktualisiert, sobald neue Höchst- und Tiefstwerte unter den ausgewählten Balken erscheinen. Sie können in den Einstellungen des Indikators auswählen, welche Level-Werte angezeigt werden sollen. Sie können auch die Farbe der Levels auswählen, so da
FREE

Dieses All-in-One-Trading-Indikator vereint Ausbruchssignale, Hoch- und Tiefststände sowie einen Trailing-Stop mit Alarmen in einem einzigen, leistungsstarken Werkzeug. Wenn Sie sich jemals überfordert gefühlt haben, zu viele Indikatoren in Ihrem Chart zu überlagern, vereinfacht dieser Indikator alles und verschafft Ihnen gleichzeitig einen deutlichen Vorteil auf dem Markt. Er kombiniert drei wesentliche Elemente in einer klaren, übersichtlichen Darstellung, die Ihnen hilft, Einstiegsmöglichkeit
FREE

Erweiterter SMC & Volumetric Order Block Indikator Übersicht
Dieser erweiterte Indikator für MetaTrader 5 wurde entwickelt, um das Marktverhalten mithilfe der Smart Money Concepts (SMC) -Methode zu entschlüsseln . Er geht über die standardmäßige Preisaktionsanalyse hinaus, indem er volumetrische Daten direkt in die Marktstruktur integriert und Händlern dabei hilft, hochwahrscheinliche Umkehr- und Fortsetzungszonen mit Präzision zu identifizieren. Hauptmerkmale Volumetrische Orderblöcke : Eine e
FREE
Der KOSTENLOSE Heiken Ashi Smoothed-Indikator ist vollständig anpassbar, einfach zu bedienen und bietet die Möglichkeit, über die iCustom-Funktion auf den Indikator zuzugreifen, sodass Sie ihn in Ihrer eigenen Handelssoftware verwenden können. Der Indikator kann auch Warnungen anzeigen, wenn sich das Signal ändert, oder Push-Benachrichtigungen senden. Für die Metatrader 4 Version klicken Sie hier: https: //www.mql5.com/en/market/product/70824 Für detaillierte Informationen klicken Sie: >>HIER<<
FREE
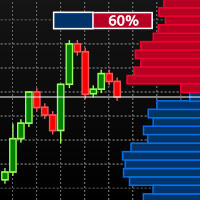
Visual Book on Chart ist ein Indikator, der speziell für Aktien- und Terminmärkte entwickelt wurde. Um zu überprüfen, ob Sie das Tool mit Ihrem Broker verwenden können, öffnen Sie die Markttiefe (Depth of Market) in Ihrem MT5-Terminal und prüfen Sie, ob Preis- und Volumendaten verfügbar sind. Erfahren Sie mehr über die MT5-Markttiefe auf der offiziellen Seite. Der Indikator zeigt die Markttiefendaten im Chartfenster an und verwendet einen Farbverlauf, der auf den Marktdaten basiert, um die Hist
FREE
MetaTrader Market bietet jedem Entwickler eine einfache und bequeme Plattform für den Verkauf von Programmen.
Wir unterstützen Sie bei der Veröffentlichung des Produkts und beraten Sie gerne, wie man eine Beschreibung für den Market vorbereitet. Alle Produkte, die im Market verkauft werden, sind durch eine zusätzliche Verschlüsselung geschützt und können nur auf dem Rechner des Kunden gestartet werden. Illegales Kopieren ist ausgeschlossen.
Sie verpassen Handelsmöglichkeiten:
- Freie Handelsapplikationen
- Über 8.000 Signale zum Kopieren
- Wirtschaftsnachrichten für die Lage an den Finanzmärkte
Registrierung
Einloggen
Wenn Sie kein Benutzerkonto haben, registrieren Sie sich
Erlauben Sie die Verwendung von Cookies, um sich auf der Website MQL5.com anzumelden.
Bitte aktivieren Sie die notwendige Einstellung in Ihrem Browser, da Sie sich sonst nicht einloggen können.