Boom and crash smasher
- Indikatoren
- Version: 1.0
Boom- und Crash-Smasher
kostenloser Indikator, der auf allen Zeitrahmen von einer Minute bis zum monatlichen Zeitrahmen funktioniert.
Der Indikator ist 100% nicht nachgemalt.
der Indikator kommt mit akustischen Alarmen und E-Mail-Push-Benachrichtigung
der Indikator erscheint auf der aktuellen Kerze Stick für schnellere Einträge
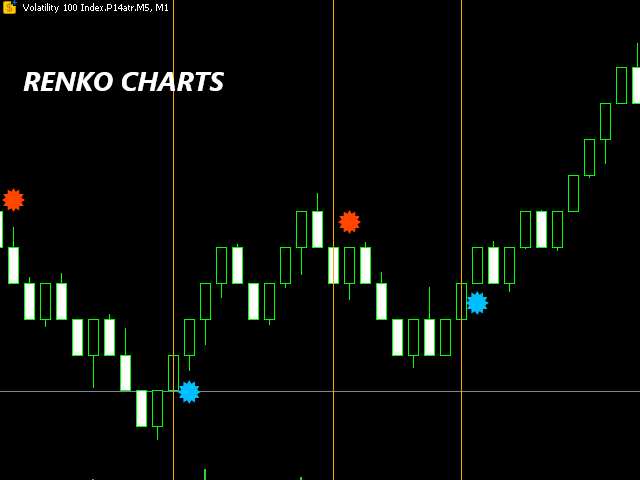
kann auf allen Charts und Renko-Charts verwendet werden
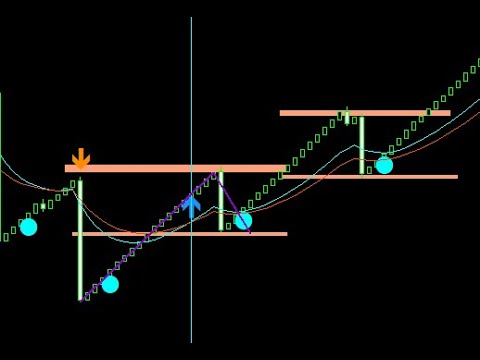
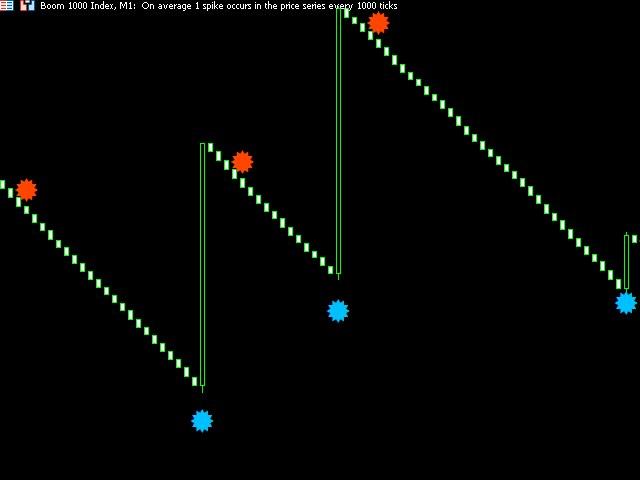
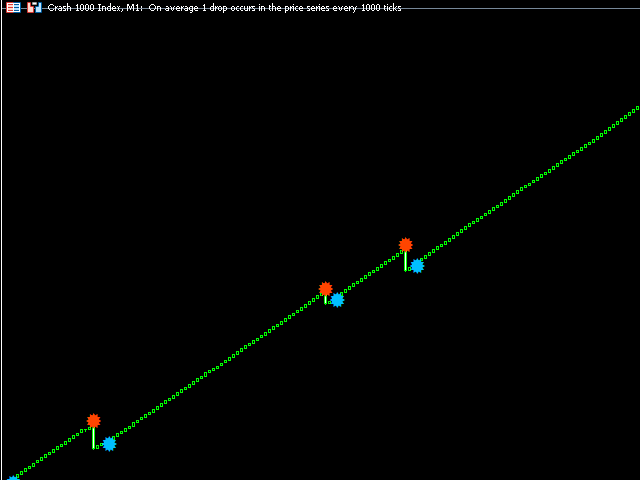
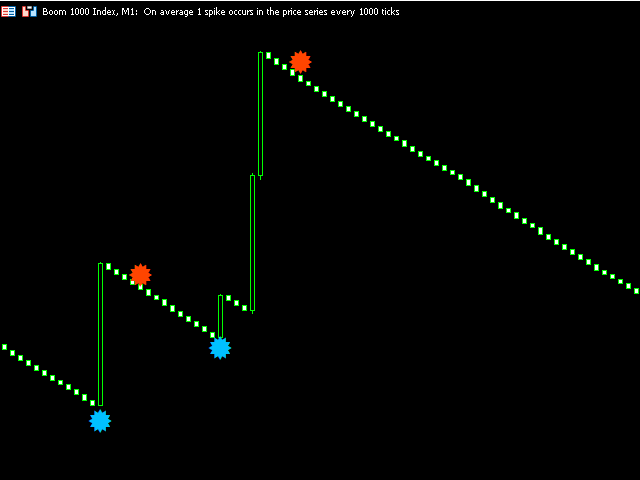
der orange Punkt ist Ihr Verkaufssignal
der blaue Punkt ist Ihr Kaufsignal


It is working great for a 1-hour candle. I built an EA around it, and it now works perfectly. Do we have any documentation on how the boom and Crasher get identified??