YouTubeにあるマーケットチュートリアルビデオをご覧ください
ロボットや指標を購入する
仮想ホスティングで
EAを実行
EAを実行
ロボットや指標を購入前にテストする
マーケットで収入を得る
販売のためにプロダクトをプレゼンテーションする方法
MetaTrader 5のための無料のテクニカル指標 - 2
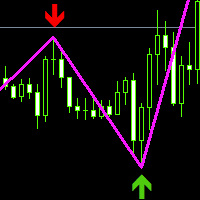
本指標は、zigzingの二次開発に基づいて、高値と安値の矢印を追加し、線を太くし、色を変更します。現在の入場売買信号をよく見せてくれます。今は多くしますか?それとも空いていますか?実際の取引のプロセスでは、より正確なことを発見し、他の指標と組み合わせて使用することができます。この指標自体は標準的に未来の関数を持っています。一般的な傾向指標や振動バッチに対して、ヒストリカルデータの研究判断から見れば、必ず高いものを確定します。この指标は価格点の変化を消し、分析の価値が与えられた価値より少ないです。そのため、字形の指标は明らかな変化だけを反映しています。多くの场合、私たちが使っている字形は価格点の具体的な位置を感知しやすいです。最も重要なのは、その転換と変化を示すことができます。同時に重要なのは、指標の最終四半期はあなたの分析データの変化に依存するかもしれません。それは特殊な指標の一つです。いくつかの取引価格に対して変更すると、前の値が変わります。すでに突然価格の変化を分析するために、Zigzagツールのこの能力は価格によって自身を訂正することができます。
FREE
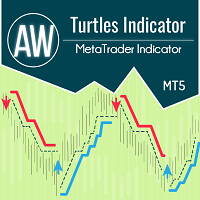
このインジケーターはタートル システムに従って機能し、古典的に 20 ローソク足と 55 ローソク足の時間間隔を想定しています。傾向は、指定された時間間隔にわたって監視されます。エントリーはサポートまたはレジスタンスレベルを下抜けた瞬間に行われます。出口シグナルは、同じ時間間隔のトレンドの反対方向への価格ブレイクアウトです。 利点:
金融商品: 通貨ペア、株式、商品、指数、暗号通貨 タイムフレーム: 古典的には D1、あらゆるタイムフレームでの作業にも適しています 取引時間: 24時間 資金管理戦略: 取引あたりのリスクは 1% 以下 追加注文を使用する場合、追加ポジションごとのリスクは 0.25% MT4 indicator version -> HERE / AW Turtles EA MT5 -> HERE / More products -> HERE エントリールール: 1) 短いエントリー: エントリー条件は20日間の高値または安値をブレイクアウトすることです。
前のシグナルが成功した場合、取引はスキップされます。
注記!以前の取引が利益で終了した場合は、
FREE

Introducing our exciting new Price Retest indicator! Get instant alerts when the price retests, giving you a powerful edge in your trading strategy. Remember to do your own analysis before making any moves in the market. MT4 Version - https://www.mql5.com/en/market/product/118031 Join To Learn Market Depth - https://www.mql5.com/en/channels/suvashishfx
Here’s a detailed explanation of how the Price Retest indicator works, its components, and how you can incorporate it into your trading strat
FREE

RSI divergence indicator finds divergences between price chart and RSI indicator and informs you with alerts (popup, mobile notification or email). Its main use is to find trend reversals in the chart. Always use the divergence indicators with other technical assets like support resistance zones, candlestick patterns and price action to have a higher possibility to find trend reversals. Three confirmation type for RSI divergences: RSI line cross 50 level Price returns to previous H/L C
FREE

Moving Average Convergence Divergence(MACD)トレーディング戦略は、勢いとトレンドの方向の変化を特定するために使用される人気のあるテクニカル分析ツールです。 MACDは、26期間の指数移動平均(EMA)から12期間のEMAを引いて計算されます。 MACDの上には、トリガーとして機能する9期間のEMAである「シグナルライン」がプロットされます。 MACDラインがシグナルラインの上にある場合、MACDはブルッシュ領域と見なされ、下にある場合はベア領域と見なされます。トレーダーはこの情報を使用して、潜在的な買いと売りの機会を特定することがよくあります。 MACDは多目的な指標であり、さまざまな方法で使用できます。一般的な使用方法のいくつかは次のとおりです。 クロスオーバー:MACDラインがシグナルラインを上回るときにはブルッシュクロスオーバーが発生し、MACDラインがシグナルラインを下回るときにはベアクロスオーバーが発生します。 ダイバージェンス:MACDが新しい高値をつけている間に基礎となるセキュリティがそうでない場合、ブルッシュダイバージェンスが発
FREE

SuperTrend Alert MT5で市場トレンドをマスターしましょう。この強力なインジケーターは、外国為替、株式、暗号通貨、商品取引向けに正確なトレンド追従シグナルを提供するために設計されています。Forex FactoryやRedditのr/Forexなどのトレーディングコミュニティで称賛され、InvestopediaやTradingViewの議論でもその堅牢なトレンド検出能力で高く評価されており、信頼性の高いエントリーとエグジットを求めるトレーダーにとって必須のツールです。ユーザーは、SuperTrendのシグナルをプライスアクションと組み合わせることで、トレンド方向を最大90%の精度で特定し、リアルタイムアラートを活用してトレンドの変化を捉えることで、取引タイミングが25-35%向上したと報告しています。主な利点には、高度なトレンド分析、カスタマイズ可能な設定によるパーソナライズされた戦略、チャートを常に監視せずに意思決定を向上させる軽量デザインが含まれ、スカルパー、デイトレーダー、スイングトレーダーに最適です。 SuperTrend Alert MT5は、独自のアルゴリズ
FREE

エキスパートアドバイザー (EA) バージョン
手動シグナルではなく自動売買を希望する場合は、こちらでこのインジケーターのエキスパートアドバイザー版をご利用いただけます:
https://www.mql5.com/en/market/product/148222
このインジケーターは、ローソク足が ボリンジャーバンド(Bollinger Bands) の外側に抜けた後に価格が再びバンド内に戻る リエントリ(再突入)タイミング を計算し、それを RSIによる確認 と組み合わせて誤検知を減らします。
価格が下側のバンドの下に出た後に再び内部に戻り、かつ(オプションで)RSIがちょうど**オーバーソールド(売られ過ぎ)**状態から抜けたときに、**Buy ReEntry(買い再突入) シグナルが検出されます。
価格が上側のバンドの上に出た後に再び内部に戻り、かつ(オプションで)RSIがちょうど オーバーボート(買われ過ぎ)**状態から抜けたときに、**Sell ReEntry(売り再突入)**シグナルが生成されます。
シグナルはチャート上に矢印で表示され、視認性を高めるために高値/安値
FREE
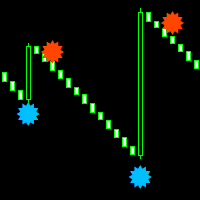
Boom and crash smasher free indicator that works on all timeframe from the one minute to the monthly timeframe. the indicator is 100% non-repaint. the indicator come with sound alerts and email push notification the indicator appears on the current candle stick for faster entries can be used on all charts and renko charts orange dot is your sell signal blue dot is your buy signal
FREE
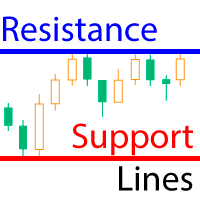
The indicator calculates fractal lines, which are technically psychological support/resistance lines. In fact, these are the highs and lows of the price over a period of time. The indicator works on all charts and timeframes. This free version of the Resistance Support Lines Pro indicator comes as is! Settings: These settings cannot be changed in this version Fractal Candels = 5 - number of candles from which a fractal is built. Calculates the maximum/minimum at which a psychological price can b
FREE

The "Power of Three" (PO3) is a concept developed by the Inner Circle Trader (ICT) to illustrate a three-stage approach used by smart money in the markets: Accumulation, Manipulation, and Distribution . ICT traders view this as a foundational pattern that can explain the formation of any candle on a price chart. In simple terms, this concept is effective for any time frame, as long as there's a defined start, highest point, lowest point, and end. MT4 - https://www.mql5.com/en/market/product/1
FREE

Gold Levels MTF - this is a fine stock technical indicator. The indicator algorithm analyzes the movement of the asset price, displays price levels of support and resistance from all time frames (TF) using the Murray method based on the Gann theory. The indicator indicates overbought and oversold fields, giving an idea of possible reversal points and at the same time giving some idea of the strength of the current trend.
Description of levels: (Extreme Overshoot) - these levels are the ultimate
FREE

「Haven Key Levels PDH PDL」 インジケーターは、トレーダーがチャート上の主要なレベルを視覚化するのに役立ちます。次のレベルを自動的にマークします: DO (Daily Open) — 日足の始値。 NYM (New York Midnight) — ニューヨーク時間の深夜0時のレベル。 PDH (Previous Day High) — 前日の高値。 PDL (Previous Day Low) — 前日の安値。 WO (Weekly Open) — 週足の始値。 MO (Monthly Open) — 月足の始値。 PWH (Previous Week High) — 前週の高値。 PWL (Previous Week Low) — 前週の安値。 CMH (Current Month High) — 当月の高値。 CML (Current Month Low) — 当月の安値。 PMH (Previous Month High) — 前月の高値。 PML (Previous Month Low) — 前月の
FREE
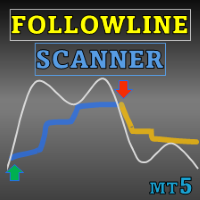
Special offer : ALL TOOLS , just $35 each! New tools will be $30 for the first week or the first 3 purchases ! Trading Tools Channel on MQL5 : Join my MQL5 channel to update the latest news from me Follow Line MT5 とスキャナーを使って、ボラティリティに基づいた高度なインジケーターでトレーディングエッジを最大限に活用しましょう。このツールは、カスタマイズ可能な設定とともに、ボリンジャーバンドの力を組み合わせ、価格の動きについて正確な洞察を提供します。 See more MT4 version at: Follow Line MT4 with Scanner See more products at: https://www.mql5.com/en/users/ndhsfy/seller Follow Line の鍵は、価格が 1 標準偏差に設
FREE

Crystal Volume Indicator — MT5向けボリューム分析ツール 概要
Crystal Volume Indicator は MetaTrader 5 用の高度で直感的なインジケーターです。価格の動きと出来高の関係を組み合わせ、市場の隠れた強さを視覚的に把握できます。買いクライマックス、売りクライマックス、弱いローソク足などを検出し、反転や継続の可能性を見極めやすくします。 主な機能 Tick Volume と Real Volume の両方に対応(ブローカー次第) 色分けされたヒストグラムで出来高イベントを分類 買い/売りクライマックス検出 出来高が低いローソク足を識別 出来高ベースの移動平均線(オプション) 任意の期間を指定可能(Lookback Window) ローソク方向に基づく着色モード 出来高イベントの分類 買いクライマックス — 非常に高い出来高で、高値付近で終値を形成 売りクライマックス — 非常に高い出来高で、安値付近で終値を形成 弱いローソク — 指定期間内で最も低い出来高 高相対出来高 — ローソクのレンジに比べて異常に大きな出来高 中立バ
FREE

MT4 version | Owl Smart Levels Indicator | Owl Smart Levels戦略 | FAQ
Fractals Indicator は、著者のビル ウィリアムズのトレーディング戦略の要素の 1 つです。 価格チャートで価格反転ポイントを検索し、その結果、サポートとレジスタンスのレベルを検索するために使用されます。 Full Fractals Indicator は改良された Fractals であり、ほぼすべての取引端末のツールキットで利用できます。 唯一の違いは、フラクタルを構築するために、メインのローソク足の左に 5 本、右に 2 本のローソク足を使用することです (図 1 を参照)。 基本的な構造に加えて、Full Fractals は価格がしばらく止まっているレベルを探します。 Telegram チャット: @it_trader_chat 新しい Expert Advisor Prop Master - 取引ターミナルでテストしてください https://www.mql5.com/ja/market/pr
FREE

Kendo Algo 概要 Kendo Algo は MetaTrader 5 向けの非リペイントトレンドインジケーターで、トレンドの方向転換を識別し、エントリー価格、ストップロス、および3つのテイクプロフィットレベルを算出した買いシグナルと売りシグナルを生成します。このインジケーターはATRベースのトレーリングストップロジックを使用してトレンド方向を追跡し、確定済みの確認された足にのみシグナルを生成することで、一度表示されたシグナルが再描画されたり消えたりすることがありません。 仕組み インジケーターは、ATRに設定可能な倍率を掛けた動的なトレーリングストップレベルを計算します。価格が上方トレーリングストップを上回って終値を付けると、強気トレンドが確認されます。価格が下方トレーリングストップを下回って終値を付けると、弱気トレンドが確認されます。方向が弱気から強気に転換すると買いシグナルが生成され、逆の転換で売りシグナルが生成されます。任意の時点でアクティブなシグナルは1つのみであり、新しいシグナルが出現すると、前のシグナルのチャートレベルは自動的に消去されて置き換えられます。各シグナ
FREE
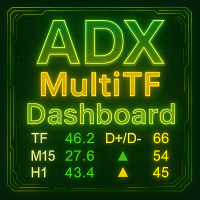
ADX MultiTF Dashboard 概要 ADX MultiTF Dashboardは、選択された3つの時間軸でトレンドの強さと方向に関する重要な情報を同時に表示するマルチタイムフレームインジケーターです。このインジケーターは、包括的な市場分析のためにADX値、方向性移動指標、RSI値を示すコンパクトなダッシュボード形式でデータを表示します。 ダッシュボードは、ADXによって測定されるトレンドの強さ、DIの比較によって決定されるトレンドの方向、買われ過ぎまたは売られ過ぎの可能性のある状態を示すRSIレベルなど、取引判断に重要な情報を提供します。これらの情報はすべて3つの時間軸で同時に表示され、トレーダーが異なる時間枠でシグナルを確認できるようにします。 主な機能 Multi-Timeframe Analysis このインジケーターは、ユーザーが選択した3つの時間軸で市場状況を同時に監視します。これにより、トレーダーは短期的な動きと長期的なトレンドの両方を観察できます。一般的な時間軸の組み合わせには、デイトレード用のM5-M15-H1、スイングトレード用のH1-H4-D1、または
FREE
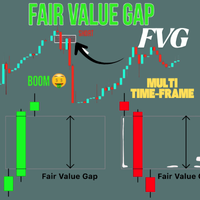
Crystal FVG Touch Detector – スマートマネーコンセプト対応高機能インジケーター Crystal FVG Touch Detector は、Smart Money Concepts (SMC) と ICT 手法を使用するトレーダー向けに設計されたプロ仕様の指標です。
あらゆる時間足で Fair Value Gap (FVG) を自動検出し、タッチをリアルタイムに認識して表示します。
リペイントしないアルゴリズムにより、機関トレーダーの不均衡ゾーンを正確に把握します。 主な特徴 FVG(強気・弱気)を自動で検出。 タッチ時に即時更新。 全時間足対応。 カラー自動調整。 高速・安定動作。 カスタマイズ可能な設定。 キーワード:
FVG, Fair Value Gap, Smart Money Concepts, SMC, ICT, Order Block, Imbalance, 流動性, サプライ・デマンド, Non Repaint, Volume Spread Analysis, Market Structure, CHoCH, BOS, Liquidity
FREE
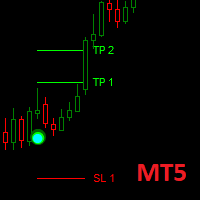
Dark Point is an Indicator for intraday trading. This Indicator is based on Trend Following strategy, also adopting the use of the atr to determine the right volatility. We can enter in good price with this Indicator, in order to follow the strong trend on the current instrument. If you love Dark Point, consider adding some power: Dark Power
Key benefits
Easily visible take profit/stop loss lines Intuitive directional points/arrows by colors Useful statistics , which indicate the wi
FREE
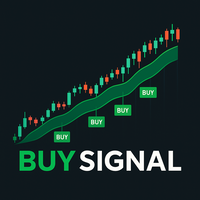
This indicator has been developed as an analytical tool based on exponential moving averages (EMA) . Its purpose is to provide additional insights into market dynamics using two exponential moving averages (EMA) and one smoothed exponential moving average (SMMA) . The indicator can be applied to different financial instruments and timeframes, depending on user preferences. Some traders use it on 30-second charts , complementing it with a 2-minute chart . How the Indicator Works The analysis is b
FREE
すべての無料商品を見るにはここをクリック
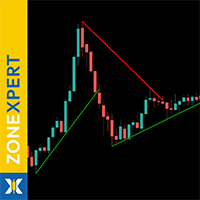
ZoneXpert は MetaTrader 5 のための視覚的マーケット分析ツールで、 サポートゾーンとレジスタンスゾーンを自動検出 し、色で強調し、リアルタイムで更新します。 このインジケーターは価格構造、高値、安値、ボリューム領域を分析し、市場が実際に反応する場所と、突破する場所を正確に示します。 ZoneXpert を使えば、市場の力がどこに集中しているかを即座に把握でき、ランダム性が支配する場所ではなく、実際に意思決定が行われる場所でトレードできます。 手動でラインを引いたり、古いレベルを比較したりする必要はなく、 ZoneXpert はグラフ上に直接、動的で分かりやすいゾーンシステムを提供します。 各ゾーンは市場の動きに合わせて自動的に調整され、エントリーやエグジットの計画、リスク管理、市場反応の理解に最適です。 Forex、Gold、Index など、どの市場でも ZoneXpert は市場が本当に意思決定を行う見えない価格領域を明らかにします。 構造、タイミング、視覚的な明瞭さ を重視するトレーダーに最適なツールです。
FREE

Volume Weighted Average Price (VWAP) The volume weighted average price (VWAP) is a trading benchmark used by traders that gives the average price a security has traded at throughout the day, based on both volume and price. It is important because it provides traders with insight into both the trend and value of a security. This indicator VWAP V2 is free and is the manual version of the extended Easy VWAP indicator (30 Euro), where the date and time properties are automatically entered. With
FREE

Quant Supply & Demand Pro: Institutional Structure Levels Quant Supply & Demand Pro is a high-performance MQL5 indicator designed for traders who prioritize Clean Charts and Institutional Logic. Instead of flooding your screen with noise, this algorithm scans market structure to identify high-probability "Smart Money" imbalances — Supply and Demand zones where price is likely to react. I built this for the trader who is tired of over-complicated "black box" tools. This isn't a signal bot; it is
FREE
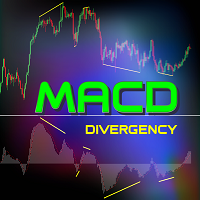
このインジケーターは、価格の動きとMACDヒストグラムの間の強気および弱気のダイバージェンスを正確に識別します。使用する指数移動平均(EMA)の期間は、5(速い)、34(遅い)、および信号線の期間は5です。このインジケーターは、モメンタムが弱まるポイントを強調表示し、トレンドの反転の可能性を示唆します。 正しいダイバージェンスの識別ルール: 強気のダイバージェンスは、価格がより低い安値を形成し、MACDヒストグラムがゼロラインの上で同時により高い安値を形成する場合に有効です。 弱気のダイバージェンスは、価格がより高い高値を形成し、MACDヒストグラムがゼロラインの下で同時により低い高値を形成する場合に有効です。 ヒストグラムの極値と価格の極値がゼロラインの同じ側に一致していない場合、ダイバージェンス信号は無効となります。これは誤った信号を引き起こす可能性があります。 このアプローチは、MACDダイバージェンス分析を適用するための最も正確で信頼性の高い方法です。 インジケーターの特徴: 確認された強気および弱気のダイバージェンスを明確にマークします。 MACDダイバージェンス検証ルール
FREE
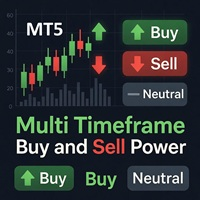
Multi Timeframe Buy and Sell Power
The "Multi Timeframe Buy and Sell Power" indicator for MetaTrader 5 is a versatile tool designed to provide traders with a clear visual representation of market pressure across nine standard timeframes, from M1 to MN1. By aggregating buy and sell strength percentages derived from recent price action and tick volume, it helps identify potential trends, reversals, and neutral market conditions in real-time. The indicator displays this information in a compact da
FREE
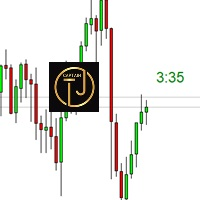
The CTJM Candle Timer Indicator is a robust tool developed for traders who use MetaTrader 5. Designed with precision, it displays the remaining time for the current candle on a trading chart, enabling traders to monitor the market more effectively and make timely decisions. With a customizable visual interface, users can adjust colors, font sizes, and positioning to suit their preferences. Some key features of this indicator include: Real-Time Candle Countdown: Keeps traders informed of the exa
FREE

Setup Tabajaraは、「ウォール街の鬼」として知られるブラジルのトレーダーによって作成されました。
この設定のアイデアは、トレーダーに価格の現在の傾向とグラフで探す必要のある操作のタイプを示すことです。
手術 これは、ろうそくの閉まりとVWAPを午前10時40分まで配置し、その後20期間の算術平均で、ろうそくを4つの可能な色でペイントすることによって行われます。 緑->上昇傾向の価格上昇(購入のエントリポイントを検索) 黒->強気トレンドでの価格修正(購入のためのエントリーポイントの検索) 赤->価格が下落傾向にある(販売用のエントリポイントを検索) 白->下降トレンドでの価格修正(販売のエントリポイントを検索) さらに、次のインジケーターもスクリプトに追加しました。 8期間の指数平均:短期的な価格変動を特定するため 50期間の算術平均:中期的な価格変動を特定する 80期間の指数平均:中期的な価格変動を特定する 200期間の算術平均:長期的な価格変動を特定する
それでも質問がある場合は、ダイレクトメッセージで私に連絡してください: https://www.mql5.c
FREE

This indicator shows the breakeven line level for the total number of open positions of the current symbol with P/L value and total volume. This indicator is helpful to decide the exit level when using a trading grid strategy. The style of the breakeven line is customizable to choose the color, line shape and font size of the positions description. Send mobile notification when crossing a positive P/L target
FREE
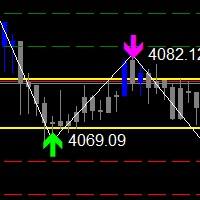
The Zigzag Price Arrow indicator is an enhanced version of the classic Zigzag indicator, combining the traditional zigzag pattern with advanced visual features. It not only identifies major market turning points but also provides clear trading signals through: • Directional arrows: Displays colored arrows (green for buy, magenta for sell) indicating potential trend directions.
• Price labels: Shows the exact price values at each pivot point directly on the chart.
• Improved visual clarity: Make
FREE
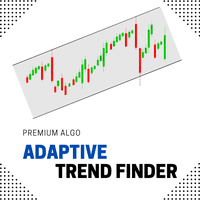
Introducing the Adaptive Trend Finder , a cutting-edge Forex indicator that automatically identifies and draws trend lines with pinpoint accuracy. Designed to adapt to changing market conditions, this powerful tool helps traders uncover the most significant trends, enabling them to capitalize on emerging opportunities and confirm the strength of ongoing market movements. The Adaptive Trend Finder uses advanced algorithms to scan the market for pivotal price points, dynamically adjusting trend li
FREE

Consolidation Zone Indicator is a powerful tool designed for traders to identify and capitalize on consolidation patterns in the market. This innovative indicator detects consolidation areas and provides timely alerts when the price breaks above or below these zones, enabling traders to make informed trading decisions. MT4 Version : https://www.mql5.com/en/market/product/118734 Join To Learn Market Depth - https://www.mql5.com/en/channels/suvashishfx
Key Features:
1. Consolidation Det
FREE

XAU POWER : The Gold Velocity Matrix XAU Power is an analytical suite specifically designed for Gold (XAUUSD) traders. This tool moves beyond traditional lagging indicators by utilizing a proprietary Velocity Decoupling Algorithm to measure the hidden energy balance between Gold and the US Dollar. Engineered for precision, XAU Power PRO synchronizes market momentum with a high-level Structural Trend Engine, giving you a definitive edge in identifying high-probability entry zones while avoiding
FREE
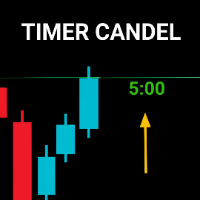
Timer Candle MT5 is a lightweight indicator that displays a countdown timer until the current candlestick closes. This indicator helps visual traders monitor the remaining time before the candle closes, especially on lower timeframes. Key Features: Countdown display in seconds or minute:second format. Text color changes automatically as it approaches the final seconds (warning color). Text is displayed in simulated bold style for better readability. Fully customizable: font type, size, color, a
FREE

Helios ICT Suite - MQL5 製品説明 Helios ICT Suite Helios ICT Suite は、Inner Circle Trader(ICT)手法の7つのコンセプトを、確定済みの確認足のみを使用して MetaTrader 5 の任意のチャートに表示します。形成後にシグナルが再描画・移動・消滅することは一切ありません。 すべてのモジュールはチャート上のダッシュボードから個別にオン・オフの切り替えが可能で、選択した設定は 時間足を変更しても自動的に保持されるため、インジケーターは設定をリセットすることなく切り替わります。 インジケーターはチャートが設定されている時間足で動作します。毎ティックではなく、新しい足が確定するたびに 1回再計算され、インジケーターバッファを使用しないため、同じウィンドウで動作する他のインジケーターに 干渉しません。 インジケーターの表示内容 デフォルトで有効になっているのはマーケットストラクチャーのみです。独立した高値・安値の配列ではなく、 検証済みの交互スイング シーケンスを使用してストラクチャーブレイク(BOS)とキャラクタ
FREE

[ マイチャンネル ] , [ マイプロダクト ]
このインジケーターは、全体的なトレンドが上昇または下降している間に、一時的な圧力によってローソク足のトレンドが変化するポイントを示します。 インジケーターに表示される矢印は、前のローソク足が特定の条件を満たすと描画されます。 戦略を構築する際、3〜4本連続の矢印を潜在的なブレイクアウトシグナルとして解釈できます。 例えば、4本目の矢印が表示された時に取引を開始することを検討できます。 これは、市場の重要な動きを予測し、取引判断を最適化するための信頼できるツールです。 簡単に言えば、このインジケーターはローソク足パターンに基づいてシグナルを生成します: ローソク足は bearish だが、上ヒゲが前のローソク足を超える。 ローソク足は bullish だが、下ヒゲが前のローソク足を下回る。 強いシグナル,
シグナルが強いことを確認できます。 取引に入る前に「Data Window」でこれを確認すると、勝率が向上します。 このインジケーターを VolumeHedger EA と一緒に使用すると、非常に良い結果が得られ、場合によっては
FREE

Order Flow Lite is a technical analysis utility designed to visualize synthetic Order Flow, Footprint Charts, and Tick Analysis using standard broker data. It assists traders in analyzing Delta logic and Volume Profiling based on recent price action. Key Features: Synthetic Footprint: Visualizes volume data for the most recent 3 closed candles, offering a clear view of immediate market sentiment. Tick Delta: Displays basic Buy/Sell delta visualization to identify potential reversals. Volume Pro
FREE

The indicator identifies when a divergence occurs between price and an indicator or oscillator. It identifies both regular and hidden divergences. Combined with your own rules and techniques, this indicator will allow you to create (or enhance) your own powerful system. For higher probability setups I can recommend you to use my Supply Demand indicator and trade only if the divergence occurs inside a zone. Supply zone for bearish div and demand zone for bullish div. The optimal scenario is if it
FREE

The indicator is intended for recognition and marking 1-2-3 buy and sell patterns on a chart. The indicator will help a trade to determine the starting and signal fractals, and to specify the possible entry points on all timeframes in МetaTrader 5. Fibonacci lines are drawn on the chart to indicate supposed targets of moving on the basis of the wave theory. The 1-2-3 formations appear to be especially important as divergences (convergences) are formed on price tops and bottoms. The indicator has
FREE

人気のある「スーパートレンド」インジケーターは、金融市場でのトレンドの方向と可能なエントリーポイントまたはエグジットポイントを特定するのに役立つテクニカル分析ツールです。このインジケーターは、価格の範囲に基づいて市場のボラティリティを測定する平均真のレンジ(ATR)に基づいています。他のプラットフォームでは無料で提供されており、ここでも同様です! 一般的に次の3つの方法で使用されます: 現在のトレンドの特定:価格がこのラインの上にある場合、上昇トレンドと見なされ、価格が下にある場合は下降トレンドと見なされます。 ストップロスレベルとして使用されます。 ダイナミックなサポート/レジスタンスとして:上昇トレンドでは、このラインは価格の下にあり、ダイナミックなサポートレベルとして機能します。下降トレンドでは、このラインは価格の上にあり、ダイナミックなレジスタンスレベルとして機能します。
FREE
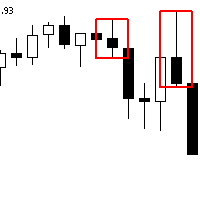
The Advanced Order Block Indicator for MetaTrader 5 is designed to enhance technical analysis by identifying significant order blocks that sweep liquidity and create Fair Value Gaps (FVG) when pushing away. This indicator is ideal for traders who focus on institutional trading concepts and wish to incorporate advanced order flow and price action strategies into their trading routine. Overview Order Block Identification : An order block represents a price area where a substantial number of orders
FREE

Haven Stop Loss Hunter Indicator
重要なレベルを分析するための正確なツールです。価格のダイナミクスをより深く理解し、取引の意思決定を改善しようと努めるトレーダーのために開発されました。
他の製品 -> はこちら 主な機能: 重要な価格の極値を迅速に見つけるのに役立ちます。
潜在的なブレイクアウト(スイープ)レベルの識別
価格がレベルを突破しようとするが、それを実行できない瞬間を検出し、潜在的な反転またはトレンドの継続を知らせます。 重要な価格ポイントの視覚的表示
市場構造の分析を簡素化し、目に見えるデータに基づいて意思決定を行うのに役立ちます。 このインジケーターは、価格が重要なレベルをテストしているが、それを突破しない状況を特定するのに理想的です。これはトレーダーにとって重要なシグナルです。 設定の柔軟性 により、個々の取引戦略に合わせてツールを調整し、選択した任意の金融商品で使用できます。
FREE

インディケータはチャート上にトレンドラインを描画します。このインジケーターには6つの入力があります。ユーザーは両方の行に代替ラベルを指定できます。インジケーターの複数のインスタンスが使用される場合、ラベルは異なっている必要があります。ユーザーは、線の幅と色、および使用する重要なピークを指定する深さを設定できます。たとえば、Depth = 10は、現在の山と谷を使用してトレンドラインを設定します。この山と谷は、左右に少なくとも10本のバーがあり、高/低がピークの高/低よりも小さい/大きいです。インジケーターは、以前の山と谷もペイントします。インジケーターには、価格がサポート/レジスタンスラインから事前に設定された距離にあるときにユーザーに通知するために使用できるアラート機能が追加されています。アラート距離はピップで設定されます。
FREE
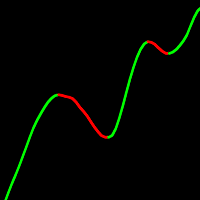
巨大なカスタマイズオプションを持つ移動平均。 スムージングの10種類。 構築するための12の価格オプション。 結果として生じる移動の離散化の可能性。 クイックコード。 制限なしに専門家で使用する能力。 UniversalMA指標は、現代の取引で使用される最も一般的な建設方法を組み合わせたものです。 したがって、多くの異なる指標を持つ必要はもはやありません。 指標ベースのエキスパートアドバイザー 移動平均は、設定された期間にわたる商品の平均価格を表示する価格ベースの遅れ指標です。 基本的に、移動平均は、チャートを解釈しようとすると、"ノイズ"を滑らかにします。 移動平均は、勢いを評価するだけでなく、傾向を確認し、サポートと抵抗の領域を特定するための良い方法です。 移動平均を使用する方法の巨大な様々ながあります。 以下は、最も一般的な使用方法の例です:移動平均の方向(この方法を使用する主なルールは、移動平均の一般的な方向を追跡することです:それは市場 この動きの方向にのみ取引を行う価値があります。 このような単純なルールは、移動平均法を短期予測のための便利なツールにします)、価格チャートで
FREE

Haven HTF Candle — あなたのチャートに上位足のパワーを Haven HTF Candle のご紹介 — 上位足(HTF)のローソク足をメインチャートに直接表示する強力なツールです。ウィンドウを常に切り替えるのをやめ、真の市場コンテキストを把握し始めましょう。これは、十分な情報に基づいた取引決定を下すための基盤となります。 その他の製品 -> こちら 。 主な機能と「Power of 3」コンセプト 「Power of 3」(AMD)コンセプトに基づく分析: インジケーターは HTFローソク足の始値 を明確に表示します。これはこの戦略の重要なレベルです。下位足にいながら、アキュムレーション(Accumulation)、マニピュレーション(Manipulation, Judas Swing)、ディストリビューション(Distribution)の各フェーズを簡単に特定できます。 トレンドの即時評価: 現在のタイムフレームでの動きが、より大きな全体像の中で推進波なのか調整波なのかを素早く理解できます。 視覚的な利便性: HTFローソク足の位置、色、数を完全にカスタマイズして
FREE

このオールインワントレーディングインジケーターは、ブレイクアウトシグナル、高値・安値水準、トレーリングストップとアラートを単一の強力なツールに集約したものです。チャートに多数のインジケーターを重ねて圧倒された経験がある方でも、このツールは全てを簡素化し、市場で鋭い優位性を提供します。3つの必須要素をクリーンで直感的な表示に統合し、エントリー機会の発見、リスク管理、市場の全体の流れを即座に把握するのに役立ちます。ブレイクアウトを取引するトレンドフォロワー、特に古典的なタートルズ取引手法のようなスタイルの方に特にお勧めです。
この伝統的なトレンドフォロー手法では、勝率は約30〜40%、シャープレシオは控えめですが、真の利益は稀に発生する5〜10%の異常値トレードからもたらされます。全ては日足チャート上で展開され、5分、15分、30分、1時間、4時間といった短い時間軸の駆け引きを避けます。これにより管理が容易になり、ストレスなく複数のポジションを監視できます。ストップロスには、日次ATR(平均トゥルーレンジ)の2倍または3倍の水準を考慮してください。また、手動での注文作業が煩わしい場合は、
FREE

The Oracleは、複数のインジケーターを管理することなく正確な市場分析を必要とするトレーダーに最適なパートナーです。
ほとんどのインジケーターが単一視点のシグナルを表示する中、The Oracleは科学的に実証された手法と独自の改良を一つのコンセンサスヒストグラムに統合します。 Ehlersスムージングアルゴリズムを搭載したUltimate Flow Index(UFI)を含む7つのモデルが、各バーで独立して投票します。
設定した閾値(4/7アグレッシブから7/7コンサバティブまで)に十分なモデルが一致すると、方向性が明確になります。
主な機能
7モデルコンセンサスシステム - 実績あるインジケーターと独自モデルの組み合わせ - 高度なスムージングを備えたUFI(Ultimate Flow Index)を搭載 - 事前最適化されたパラメーター(設定不要)
設定可能なアラート閾値 - 4/7モデル:アグレッシブ(早期シグナル、ノイズ多め) - 5/7モデル:スタンダード(バランス型) - 6/7モデル:推奨(最適なシグナル/ノイズ比) - 7/7モデル:コンサバティブ
FREE
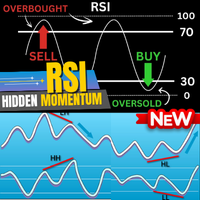
The Real RSI – プロフェッショナル・ダイバージェンス・ハンター 概要 The Real RSI は、RSI に基づく反転およびトレンド継続シグナルを高精度に検出するために設計された、プロフェッショナル向けのダイバージェンス検出インジケーターです。
価格と RSI の間に生じる 通常のダイバージェンス および 隠れたダイバージェンス を自動的に検出し、スマートなピボットロジックとリアルタイム構造検証によって各セットアップを確認します。
このインジケーターは、精度・安定性・実用性を重視して開発されており、実際の市場環境で 再描画せず遅延もない 動作を実現しています。 これらのダイバージェンスシグナルを自動取引で活用したい場合は、以下のEAを使用できます:
The Real RSI BOT – Auto Divergence Trading EA 主な機能 1. 自動ダイバージェンス検出 • 通常および隠れたダイバージェンスを自動検出(強気・弱気両対応)。
• Forex、Gold、Indices、Crypto など、すべての銘柄・時間足に対応。
• 反転型およびトレンド継続型
FREE
Indicator Description Range Filter Pro is a sophisticated trading tool for XAUUSD (Gold) that combines adaptive price filtering with volume analysis and real-time market monitoring. Designed for both novice and professional traders, this indicator helps identify trend direction, potential reversals, and significant market movements through its multi-layered approach.
Key Components 1.Dynamic Range Filter 2.Volatility-Adjusted Bands 3.Volume-Enhanced Candles 4.Professional Trading Dashboard 5.M
FREE

Crystal Quantum Flow
高度なマーケット・インテリジェンス・インジケーター Crystal Quantum Flow は、明確さ、精度、そして機関投資家レベルの市場洞察を求めるトレーダーのために設計された、次世代のプロフェッショナル・トレーディング・インジケーターです。
本インジケーターは、マルチ次元のマーケットフロー分析、時間足の同期インテリジェンス、高度なビジュアル解釈を一つの強力なチャート環境に統合した、完全な意思決定支援システムとして構築されています。 Crystal Quantum Flow の内部アーキテクチャは完全に独自設計であり、保護されています。
すべての分析モデルはクローズドシステムとして動作し、一般的なリテール向けインジケーターや公開された数式には基づいていません。 コアコンセプト Crystal Quantum Flow は、市場の動きを単なる個別の価格変動としてではなく、圧力、モメンタム、方向性の優位性が連続的に流れるプロセスとして解釈するよう設計されています。
市場ノイズに反応するのではなく、確定した市場状態とその転換に焦点を当て、トレー
FREE

機能
フィボナッチ・リトレースメント・トレーディングのためのインジケータ 1時間、4時間、1日、1週間の前のバーから選択されたバーに基づいてフィボナッチ・チャートが描かれます。 市場価格がフィボナッチ・レベルに触れると、色が変わり、タッチした時間が表示されます。 フィボナッチ・グラフは、-23.6、0、23.6、38.2、50、61.8、76.4、100、123.6のレベルに描かれ、バーが更新されるとチャートがリフレッシュされます。
変数
タイムフレーム:1時間、4時間、1日、1週間から選択されたタイムフレームでフィボナッチ・チャートが描かれます。 FiboWidth:レベルの太さを決定します。 FiboStyle:ピボット・レベルのスタイルを設定します。 TouchedColor:タッチしたときに変わる色です。
エラーがある場合や改善点がある場合はコメントしてください。 評価は開発者にとって大きな助けになります。満足していただける場合は5つ星をお願いいたします。
FREE
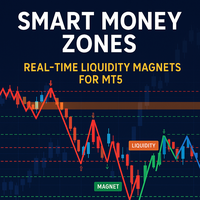
Developed according to the principles of smart money management strategies, the SM Zones indicator is a very convenient tool for traders on the MetaTrader 5 (MT5) platform. It graphically displays on the chart all the significant zones used in the SM strategy: market structure, price levels of increased liquidity, "price magnet" zones - imbalances, order blocks, fvg, breaker blocks and mitigation blocks - towards which the instrument's price moves. The zones influencing the bull market are high
FREE

The Supertrend indicator was originally created by a french fellow named Olivier Seban , and its goal is to identify the Primary Trend of prices . Its calculation is easy and based on the average of Highs and Lows and then we add the volatility of a custom period, plus a multiplier. This way we get the Supertrend Line. You can find in the web several approaches and trading strategies using this very useful indicator.
HOW TO "READ" THIS INDICATOR
If the closing prices are above Supertrend Line,
FREE

This indicator obeys the popular maxim that: "THE TREND IS YOUR FRIEND" It paints a GREEN line for BUY and also paints a RED line for SELL. (you can change the colors). It gives alarms and alerts of all kinds. IT DOES NOT REPAINT and can be used for all currency pairs and timeframes. Yes, as easy and simple as that. Even a newbie can use it to make great and reliable trades. NB: For best results, get my other premium indicators for more powerful and reliable signals. Get them here: https://www.m
FREE
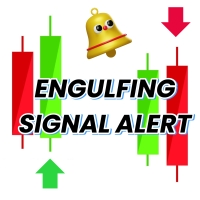
Engulfing Candle Signal Alert: Elevate Your Trading Strategy Unlock the full potential of your trading with the Engulfing Candle Signal Alert, the ultimate tool for identifying market reversals and enhancing your trading precision. Designed specifically for traders who value accuracy and timely alerts, this powerful indicator detects engulfing candle patterns, a key signal in technical analysis that often indicates a potential shift in market direction. What is an Engulfing Candle? An engu
FREE

このインジケーターは、チャート上に需要と供給のゾーンを描画します。独自のルールやテクニックと組み合わせることで、このインジケーターを使用して独自の強力なシステムを作成 (または強化) できます。さらに多くの機能を提供する 有料版 もぜひご確認ください。私の推奨は、少なくとも 25 バー後に最初のゾーン テストが発生する取引機会を探すことです。 特徴 ゾーンには 3 つの色があります (入力によって調整可能)。テストされていないゾーンは暗い色、テスト済みのゾーンは中くらいの色 、壊れたゾーンは明るい色です 。 各ゾーンにはゾーン外枠の価格とゾーンテストの金額が記載されています。 入力パラメータ 最初の極値を検索するための最大バックバー数 - デフォルトは 3000 です。最初の極値を xx バー分遡って検索します。値が大きいほど、より多くのシステム リソースが必要になります 。遅いコンピューターの場合は、500 ~ 1000 の値が適している場合があります。 ゾーンテスト間のキャンドルの最小数 未テストの需要色 テスト済みの需要色 壊れた需要の色 未テスト供給色 テスト済みの供給
FREE

TRUE ANTI SPIKES DERIV
Find the user manual here, as well as settings fro boom 1000, crash 500, crash 1000 https://t.me/automated_TLabs DM: https://t.me/gg4rex
Professional Reversal Detection Indicator Advanced Multi-Timeframe Reversal Detection System for Boom & Crash Indices
Download product user manual here:
WHAT IS TRUE ANTI-SPIKES? True Anti-Spikes is a precision-engineered reversal detection indicator specifically designed for Boom and Crash synthetic indices. Unlike trend-follo
FREE

SNR Sentinel — Adaptive Support & Resistance Engine for MT5
SNR Sentinel is an advanced, self-adjusting Support & Resistance indicator designed to track only the most relevant price levels in real time. Instead of cluttering the chart with outdated lines, SNR Sentinel continuously detects, validates, monitors, and replaces support and resistance levels based on confirmed price structure and breakout behavior. Built around strict left-right bar confirmation logic, the indicator identifies sta
FREE

短い説明 G3D Full Confluence は、**スマートマネーコンセプト(SMC)**と高度なテクニカル分析を融合させたエリート向けインジケーターです。強力なマルチタイムフレームの根拠に基づき、 オーダーブロック(OB) 、 フェアバリューギャップ(FVG) 、 RSIダイバージェンス を精密に特定します。 インジケーターの概要 プロフェッショナルな精度とチャートの明瞭さを求めるトレーダーのために設計された G3D Full Confluence は、相場のノイズを徹底的に排除します。機関投資家のロジックとボリュームの裏付けを組み合わせることで、複数の根拠が一致した高精度なシグナルのみを配信します。 主な機能: オーダーブロック(OB)の自動検知 : 大きな価格変動の起点となる機関投資家の供給・需要ゾーンを特定します。 フェアバリューギャップ(FVG)の識別 : 価格の不均衡(リクイディティゾーン)を検出し、市場が回帰しやすいターゲットを可視化します。 スマートRSIダイバージェンス : 価格とモメンタムの乖離から、トレンドの終焉や反転の兆しをいち早く捉えます。 マルチタイム
FREE
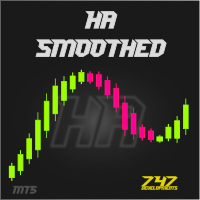
FREE Heiken Ashi Smoothed indicator is fully adjustable, easy to use and comes with possibility to access the indicator via iCustom function so you can use it in your own trading software. Indicator can also pop up alerts when signal changes or send push notifications. For Metatrader 4 version click here: https://www.mql5.com/en/market/product/70824 For detailed information click: >>HERE<< Features
Easy to use Accessible via iCustom Fully adjustable Alerts and Push notifications Possib
FREE

Do you know VWAP Bands? It is an indicator used to identify support and resistance points from the daily VWAP and you can use it to check the best entry and exit points. This indicator does not use the principle of bollinger bands. There is a difference in the calculation method. Use it according to your strategy. See the applications and what results you can get. The indicator is free and can be used on any account.
FREE

The indicator analyzes the volume scale and splits it into two components - seller volumes and buyer volumes, and also calculates the delta and cumulative delta. The indicator does not flicker or redraw, its calculation and plotting are performed fairly quickly, while using the data from the smaller (relative to the current) periods. The indicator operation modes can be switched using the Mode input variable: Buy - display only the buyer volumes. Sell - display only the seller volumes. BuySell -
FREE

DRX Smart Risk - Visual Trade Planner Utility DRX Smart Riskは、リスク管理とポジションサイズの計算を支援するために設計されたMetaTrader 5用のチャートオーバーレイツールです。標準的なラインとは異なり、このユーティリティはインタラクティブなインターフェースを作成し、ユーザーがエントリー、ストップロス、テイクプロフィットのレベルを視覚的に計画しながら、財務指標を自動的に計算できるようにします。 重要な注意点 この製品は、計画および計算を目的としたテクニカル指標/ユーティリティです。リスクとリワードを可視化しますが、直接取引を実行するものではありません。 主な機能 視覚的なリスクリワード計算: ツールはチャート上にリスクゾーン(ストップロス)とリワードゾーン(テイクプロフィット)を投影します。ラインを移動すると、現在のリスクリワード比(R:R)がリアルタイムで表示されます。 ポジションサイズ計算: 選択されたロットサイズに基づいて、ユーティリティは口座通貨での潜在的な利益と損失を計算します。 スマートドラッグロジック: エ
FREE

チャート上にフィボナッチレベルを手動で描画することにうんざりしていませんか?取引における主要なサポートとレジスタンスのレベルを特定する便利で効率的な方法をお探しですか?これ以上探さない! 自動 フィボナッチ レベル を実行する究極の MetaTrader 5 インジケーターである DrawFib Pro の紹介 チャート上に描画し、これらのレベルを突破したときにタイムリーにアラートを提供します。 DrawFib Pro を使用すると、取引戦略を強化し、時間を節約し、より多くの情報に基づいた意思決定を行うことができます。 私のフィボナッチベースのインジケーター: Advanced Gartley Pattern MT5 || Price Wave Pattern MT5 主な特徴:
自動 フィボナッチ描画. カスタマイズ可能な パラメータ . 正確 で 信頼性. リアルタイム アラート. ユーザー フレンドリーな インターフェイス . DrawFib Pro は、チャート上でフィボナッチを自動描画するための効率的で信頼性が高く、使いやすい方法を求めるトレーダーにとって必
FREE

Free automatic Fibonacci is an indicator that automatically plots a Fibonacci retracement based on the number of bars you select on the BarsToScan setting in the indicator. The Fibonacci is automatically updated in real time as new highest and lowest values appears amongst the selected bars. You can select which level values to be displayed in the indicator settings. You can also select the color of the levels thus enabling the trader to be able to attach the indicator several times with differe
FREE

フェアバリューギャップを手動で検索するのはやめましょう。Institutional Imbalance Scanner は、市場の不効率性(不均衡)を機関投資家の精度で特定する、高度に最適化された分析ツールです。MetaTrader の動作を遅くすることはありません。 なぜこの指標なのか? ほとんどの FVG 指標は、古いデータでチャートを過負荷にし、貴重な CPU パワーを消費します。当社のスキャナーは、実際の市場の変化があった場合にのみ計算を行うスマート更新アルゴリズムを使用しています。
ハイライト: SMC ロジック: スマートマネーの概念に基づいて、真の流動性ボイドを認識します。 充填率フィルター: 関連性のあるギャップ(例えば、50%未満しか埋まっていないギャップ)のみを表示します。 マルチタイムフレーム対応: 現在のチャート上で、より長い時間単位を直接分析します。 ラグフリーコード: 最適化された計算ロジックにより、プロのデイトレードやスキャルピングに最適です。 視覚的な明瞭性: 埋まったギャップを自動的に非表示にして、チャートをすっきりさせます。
技術データ: 入力対
FREE

Synthetic Trend AI - 人工知能を搭載したスマートなトレンドインジケーター
Synthetic Trend AIインジケーターは、定番のSuperTrendの公式に人工知能アルゴリズム(k近傍法、KNN)と出来高分析を組み合わせた強力なテクニカル分析ツールです。市場をより深く理解し、より自信を持って意思決定を行いたい方のために設計されています。
Synthetic Trend AIの特徴: AIトレンド予測:KNNアルゴリズムを用いて過去のデータを分析し、価格変動の方向を予測します。 出来高分析:VWMA(出来高加重移動平均)を搭載しており、動きの方向だけでなく、その強さも考慮できます。 柔軟な感度設定:近傍数(k)とデータ量(n)を調整することで、取引スタイルに正確に適応できます。 視覚的なトレンドシグナル:価格の下側に緑色の線が表示されている場合は強気トレンド、上側に赤色の線が表示されている場合は弱気トレンドを示します。 ダイナミックトレーリングストップ:このインジケーターは、価格と出来高に反応するスマートなストップロスとして使用できます。
このインジケー
FREE
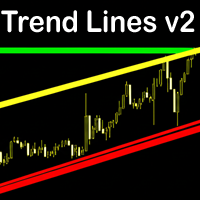
Trend Lines v2 MT5 is an intelligent auto trendline indicator that instantly detects key dynamic support and resistance zones. Built on pivot high/low structure, it delivers a clear and accurate view of market trends across all timeframes. Features Fully automatic trendline drawing based on precise pivot points. Filters out noise – only clean and reliable trendlines are shown. Control the number of lines to keep your chart neat and easy to read. Flexible customization: colors, line thickness, ra
FREE

This indicator shows Fractal Breakout Trendlines and Support and Resistance
The Fractal Ascending Trendline and Fractal Descending Trendline are drawn from the last valid fractals. Breakouts can be taken above or below these trendlines. Horizontal lines are drawn from the Last upper and Last lower fractal to show support and resistance levels. Horizontal Upper and Lower Intersection lines are drawn where a fractal trendline has been last intersected, to show where to place a buy or sell order
FREE

Also check my premium spikes bot: https://www.mql5.com/en/market/product/142350 Also check my premium spikes bot: https://www.mql5.com/en/market/product/142350 Also check my premium spikes bot: https://www.mql5.com/en/market/product/142350 MEGASPIKES BOOM AND CRASH v1.32 NB: source codes of this indicator are available: PM me: https://t.me/Machofx PLEASE JOIN THE CHANNEL BELOW TO HAVE ACCESS TO ALL PREVIOUS VERSIONS check out Spikes robot
BoomCrash Cheatcode EA : https://www.mql5.com/en/ma
FREE
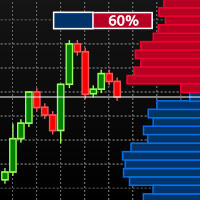
Visual Book on Chart is an indicator designed specially for stocks and futures market. To check if you can use the tool with your Broker open the MT5 Depth Of Market on your terminal and check if there are price and volume data available. Learn more about the MT5 Depth Of Market in the oficial page. The indicator shows the depth of market data on the chart window and use gradient based on the market data to colorize the histogram bars. The indicator is formed by two components: The panel, whic
FREE
MetaTraderプラットフォームのためのアプリのストアであるMetaTraderアプリストアで自動売買ロボットを購入する方法をご覧ください。
MQL5.community支払いシステムでは、PayPalや銀行カードおよび人気の支払いシステムを通してトランザクションをすることができます。ご満足いただけるように購入前に自動売買ロボットをテストすることを強くお勧めします。
取引の機会を逃しています。
- 無料取引アプリ
- 8千を超えるシグナルをコピー
- 金融ニュースで金融マーケットを探索
新規登録
ログイン