Neue technische Indikatoren für den MetaTrader 4 - 96

Was ist ein Währungsstärkeindikator ?
Ein Währungsstärkeindikator ist ein grafisches Instrument, das die Stärke einer Währung anzeigt. Gängige Indikatoren zeigen in der Regel die Stärke einer Währung im Verhältnis zu einer anderen Währung an, mit einigen Berechnungen ist es jedoch möglich, die absolute Stärke jeder einzelnen Währung zu ermitteln.
Daher ist ein Währungsstärkematrix-Indikator (oder -Zähler) ein Instrument, das versucht, die absolute Stärke einer Währung auszudrücken, so dass Sie
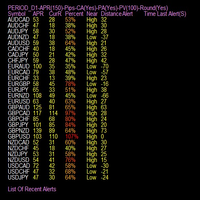
Der Indikator ist in der Lage, das Erreichen der durchschnittlichen Preisspanne der letzten Perioden durch Pop- und akustischen Alarm anzuzeigen, so dass wir unseren Betrieb einstellen können. Er ermöglicht verschiedene prozentuale Variablen erreicht und Perioden der Variation nach den eingegebenen Parametern. Wenden Sie Ihre Umkehrstrategien an, um diese Schwelle zu erreichen, damit Sie höhere Erfolgsquoten erzielen. Unverzichtbar für die Reverse-Intraday-Strategien.

Dieser Indikator XX Power indicator.indicator zeigt Trend Bewegung. Indikator hilft zu kaufen und zu verkaufen. Indikator zeigt Pfeil und Linie. Eigenschaften
FiltPer - zeigt den Zeitraum des Indikators an.
Wie der Status zu verstehen ist: Wenn die Trendfarbe grün ist, ist der Trend steigend. Wenn die Trendfarbe rot ist, ist der Trend rückläufig.
//////////////////////////////////////////////////////////////////////////////////////////////////////////////////////////////////////////////////

Currency RSI Scalper -ist ein professioneller Indikator, der auf dem beliebten RSI-Indikator (Relative Strength Index) basiert. Obwohl der stochastische Indikator für ein Intervall des Marktes gut funktioniert, erzeugt er keine profitablen Signale, wenn sich die Marktbedingungen ändern, und erzeugt daher falsche Signale, was zu großen Verlusten führt. Haben Sie jemals über einen adaptiven stochastischen Indikator nachgedacht, der sich an die Marktbedingungen anpasst? Der vorgestellte Indikator i

Balanced Entry von VArmadA
Ein einfacher, aber leistungsfähiger Fraktal-basierter Support/Resistance-Indikator
Funktioniert mit Timeframes 1H und höher und wurde auf allen wichtigen Paaren getestet. Achten Sie auf das Signal: Ein Pfeil, der einen Long- oder Short-Einstieg anzeigt.
Wie es funktioniert:
Pfeile zeigen umgekehrte Unterstützung/Widerstand an. Ein nach oben gerichteter Pfeil bedeutet Long - ein nach unten gerichteter Pfeil zeigt einen Short-Handel an.
Anweisungen:
- Indikator Lo
FREE

Beschreibung
Bitcoin Manager ist der beste Indikator für den Handel mit der Kryptowährung Bitcoin. Er wird auf der Grundlage der Preisabweichung vom gleitenden Durchschnittskanal berechnet. Aufsteigende und absteigende Pfeile zeigen mögliche Punkte und Niveaus für die Eröffnung von Kauf- und Verkaufspositionen an.
Wie wird er verwendet?
Wir empfehlen dringend, diesen Indikator auf dem H1-Zeitrahmen zu verwenden. Ein Aufwärtspfeil zeigt ein Kaufniveau an. Abwärtspfeil - Verkaufsniveau.
Param

Der TrueChannel-Indikator zeigt uns die wahren Kanäle der Preisbewegung an. Dieser Indikator ähnelt in seinem Erscheinungsbild dem Donchian-Kanal , basiert jedoch auf völlig anderen Prinzipien und liefert (im Vergleich zum Donchian-Kanal , der besser nur zur Einschätzung der Volatilität verwendet werden sollte) angemessenere Handelssignale. Wie im Artikel gezeigt, bewegt sich der Preis tatsächlich in Kanälen parallel zur Zeitachse und springt abrupt von den vorherigen Kanälen in die nachfolgende
FREE

Modifizierter Parabolic SAR: Ihr zuverlässiger Assistent am Markt Diese erweiterte Version des Parabolic SAR-Indikators zeigt effektiv die Trendrichtung an und kann eine wertvolle Ergänzung zu Ihrer Handelsstrategie sein. Vorteile: Reflexion der Trendrichtung: Der Indikator zeigt die Trendrichtung des Marktes deutlich an und hilft Ihnen so, fundierte Handelsentscheidungen zu treffen. Signal-Filterung: Der Indikator dient als hervorragender Filter zur Ergänzung Ihrer Strategie und hilft Ihnen, f
FREE
Hallo Trader, Ein sehr einfaches, aber nützliches Tool für automatische Trader. Ein Indikator, mit dem Sie die Geschwindigkeit des Strategietesters auf sehr einfache Weise anpassen können. Ziehen Sie den Indikator einfach in den Chart, bevor Sie den Strategietester starten, und stellen Sie die Geschwindigkeit manuell ein, und das ist alles! Die Schaltflächen können an jeder beliebigen Stelle des Charts platziert werden, geben Sie einfach die x- und y-Koordinaten ein -----------------------------
Indikator für binäre Optionen das Signal erscheint zusammen mit der Eröffnung einer neuen Kerze und signalisiert das völlige Fehlen von Redrawing-Empfehlungen Kaufsignal blauer Pfeil nach oben Verkaufssignal roter Pfeil nach unten Ablaufzeit und empfohlen 1 Kerze des verwendeten Zeitrahmens wenn sich der Handel als unrentabel erweist, können Sie den Betrag erhöhen und den Handel beim nächsten Signal wieder eröffnen das Instrument ist einfach einzurichten, nur zwei Perioden Optimale Einstellungen

Day Trades Resistance and Support (daytradesSR) ist ein Indikator, der aus folgenden Elementen besteht 1. der Hauptlinie (Unterstützungs-/Widerstandslinie), die anzeigt i. entweder einen Aufwärts- oder Abwärtstrend ii. dynamische Unterstützungs- oder Widerstandsebenen 2. einer spezifischen Spanne , die durch eine Linie für die obere Spanne und eine weitere Linie für die untere Spanne definiert ist. Diese Linien dienen als schwache sekundäre Unterstützung oder Widerstand . (3) Wenn die Hauptlinie

Nach dem Kauf, kontaktieren Sie bitte
t.me/hakimsann
Diese Indikatoren sind gemischt auf alle logischen Wert wie
Trend
Unterstützung und Widerstand
Kerzenmuster
Price Action
wir kombinieren
2 Bollinger Band
6 Zigzag Perioden
4 Relative Strength Index Periode
1 MACD Trend
Unterstützung und Widerstand
Preisaktion
Kerzenmuster
Vermeidung von Doji auf dem Markt Kann auf jedem Markt angewandt werden
24-7
Maksimum Martingale lv 5.
Erster Einsatz 0,4% Balance

Sind Sie mit der Größe des Hauptcharts bei der Verwendung von Oszillatoren unzufrieden? Sie können MACD-, RSI-, Stochastik-, ATR- und Momentum-Indikatoren über Main Chart Oscillators hinzufügen . Vertikale Größe : Vertikale Größe des Indikatorfensters Zeichnungsmodus : Fügen Sie Oszillatoren im selben Abschnitt hinzu oder erstellen Sie einen neuen Abschnitt für einen beliebigen Oszillator Draw Top Line : Zeichnet eine Linie am oberen Rand des Indikatorabschnitts, um ihn zu trennen. Top Line Styl

Dieser Zeiger wird von einer doppelten Glättung auf solche Weise geliefert, um zu gelingen, reaktiver eines stumpfen gleitenden Durchschnitts zu sein, aber ohne die Geräusche des Bodens des Marktes zu verfolgen. Sein Gebrauch muß ausschließlich zur Suche und zur Identifizierung des Trends in Aktion gedreht werden (selbst wenn graphisch es ein Indikator scheinen könnte, der eine Umkehrung der Preise anzeigt) , weil das erste nützliche Signal zur Öffnung des aufeinanderfolgenden Balkens zu jenem
FREE

Forex Trend Omega ist ein Trendfolgeindikator, der Marktgeräusche filtert, um perfekte Einstiege in den Trend zu ermöglichen oder Trendumkehrungen zu erkennen. Die Möglichkeiten für die Verwendung dieses Indikators sind endlos, Sie können es auf jedem Zeitrahmen verwenden, um Trends zu finden, die Ihrer Handelsstrategie entsprechen. Das BESTE an diesem Indikator ist, dass er sich NICHT WIEDERHOLT . Das macht ihn zu einem einzigartigen Indikator und zu einem MUST HAVE in Ihrem Indikatorenportfoli
FREE
Any Moving Average zeichnet einen gleitenden Durchschnitt eines *beliebigen Indikators in einem Unterfenster. Viele Indikatoren, die in MT4 enthalten sind, werden standardmäßig unterstützt. Sie können auch eigene Indikatoren hinzufügen. Einstellungen Name Beschreibung Zeitrahmen Zeitrahmen für die Berechnung auswählen Quelle Indikator Indikator auswählen Name des benutzerdefinierten Indikators Geben Sie den Namen des benutzerdefinierten Indikators ein (wenn der Quellindikator auf Benutzerdefinie
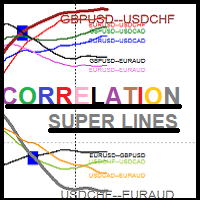
SUPER Korrelationslinien für Symbole Multi Timeframes Multi Currencies Indikator Jede Linie zeigt die Korrelation von 2 Symbolen an, basierend auf den Berechnungen der Symbolstärke bei Multi Timeframes
5 Symbole -> 10 Korrelationsindikatorlinien Strategie:1 basiert auf der Auswahl der NEUEN schwächeren/stärkeren Korrelationslinie: *****Neue schwächere Linie, die die alte schwächere Linie nach unten kreuzt: SYMBOL1 VERKAUFEN && SYMBOL2 KAUFEN *****Neue stärkere Linie, die die alte schwächere Lin
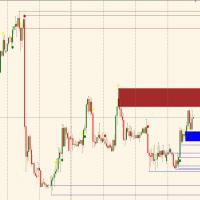
Es verfolgt automatisch die Angebots- und Nachfragezonen und zeigt den aktuellen Trend an. Sobald Sie den Trend auf dem Hauptzeitrahmen identifiziert haben, warten Sie einfach, bis der Preis auf dem operativen Zeitrahmen in der nahen Zukunft einer Nachfrage- (Kauf) oder Angebotszone (Verkauf) ankommt und führen Sie den Handel aus. Es wird empfohlen, darauf zu warten, dass der Trend auf dem höheren Zeitrahmen und der operative Zeitrahmen übereinstimmen, und ausschließlich in den Bereichen zu hand
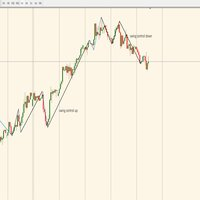
Der Indikator übersetzt automatisch Kontrollschwünge (trendbestimmter Markt) und Korrekturschwünge (rückläufiger Markt); Es handelt sich um einen einfachen Indikator, der mit Ihren Strategien kombiniert werden kann, um diese zu verbessern und nur dann in den Markt einzusteigen, wenn der Trend unter Kontrolle ist; Überprüfen Sie auf dem größten Zeitrahmen, wie sich der Markt bewegt (Swing schwarze Farbe Kontrolle oder Swing blaue Farbe Korrektur) von hier aus, gehen Sie von Zeitrahmen, um seinen

LineareRegressionZerlegung ( LRD ) Die lineare Regressionszerlegung wurde mit einer sehr komplexen Methode berechnet.
Grundsätzlich wird versucht, die Kursbewegungen der Instrumente auf der Metatrader-Plattform linear zu zerlegen.
Der Indikator wird in der Grafik mit zwei separaten Linien dargestellt.
Die rote Linie ist unser Hauptindikator und behandelt die Preisdivergenz.
Die blaue Linie filtert das rote Signal.
Damit ein Kaufsignal entsteht, muss zum Beispiel die rote Linie die Nulllinie nach

Der Perfect Entry Spotter Indikator mit Alarm basiert auf einer Kombination von Support-Resistance-, Fractal-, Alligator- und Moving-Average-Indikatoren, die auf einer intensiven Forschung basieren. Der Indikator verfügt über einen Alarm mit der Option, ihn zu aktivieren/deaktivieren. Sie können auf dieser Grundlage mit hoher Genauigkeit handeln. Empfohlene Handelsregeln: 1. Kaufen - Warten Sie auf das Erscheinen des Kalk-Pfeils und handeln Sie in Richtung des Trends (Trend nach oben). 2. Verkau

Dieser Indikator identifiziert die Hoch- und Tiefpunkte der Haupt- und Nebenschwünge auf einem Diagramm. Anschließend zeichnet er anhand des letzten Schwungs ein Fibonacci-Muster mit Rücksetzungs- und Verlängerungsniveaus, um Ihnen eine Vorstellung davon zu geben, wohin sich der Preis als nächstes bewegen könnte. Sie können ein Paar gleitende Durchschnitte festlegen, um die Richtung des Gesamttrends zu bestimmen. Es gibt Konfigurationsparameter für den Haupt- und Nebenschwung sowie für die gleit

Beschreibung Candle Power Color-Indikator, der anzeigt, wann sich der Markt im Trend befindet und wann er in einer Seitwärtsbewegung ist KEY LINKS: Installationsanleitung - Häufige Fragen - Alle Produkte Wie nützlich ist dieser Indikator? Er ermöglicht die Erkennung von Trend- und Seitwärtsbewegungen im Markt Er färbt sich NIEMALS neu. Er passt sich an jeden Markt und Vermögenswert an. Er kann jede andere Handelsstrategie unterstützen. Anmerkung 1: Dieser Indikator sollte nur als Teil einer Hand

Dashboard für Ma Speedometer: https: //www.mql5.com/en/market/product/116784
Nicht standardisierte Einstellung zum Standardindikator des gleitenden Durchschnitts. Das Wesen des Indikators besteht darin, die Stärke und Geschwindigkeit der Kursrichtung zu bestimmen, indem der Neigungswinkel des gleitenden Durchschnitts ermittelt wird. Ein Punkt wird auf der fünfzehnten MA-Kerze und ein Punkt auf der letzten geschlossenen MA-Kerze genommen, eine gerade Linie wird zwischen ihnen gezogen, sie ist be
Der Zig-Zag-basierte Level-Indikator ist ein hochpräzises Werkzeug für den Forex-Handel, das Ihnen helfen wird, Ihre Strategie zu verbessern und präzisere Entscheidungen zu treffen. Er verwendet den Zig-Zag-Algorithmus, um verschiedene Unterstützungs- und Widerstandsniveaus auf dem Markt zu identifizieren, anhand derer Sie bestimmen können, wann es am besten ist, in einen Handel einzusteigen oder ihn zu beenden.
Dieser Indikator zeichnet sich durch eine hohe Leistung und Genauigkeit bei der Be
FREE
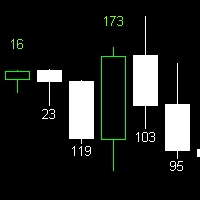
Indikator für Kerzengröße Erforschen Sie die Kerzengröße mit diesem praktischen Indikator. Er funktioniert in verschiedenen Zeitrahmen und liefert wertvolle Erkenntnisse für die technische Analyse. Hauptmerkmale: Zeigt die Größe der Kerze nach der Konfiguration des Indikators an. Kompatibel mit allen Timeframes. Die Kerzengröße ist eine wichtige Kennzahl in der technischen Analyse, die Aufschluss über die Marktstärke und die Volatilität gibt. Dieser Indikator ermöglicht eine klare und genaue Vis
FREE

Ein Indikator in Form eines Panels zum Sammeln von Statistiken über Spreads aus einer bestimmten Liste von Paaren. Es genügt, ein Diagramm zu öffnen und einen Indikator zu setzen, um Statistiken für alle angegebenen Paare zu sammeln.
Nach Beendigung der Arbeit schreibt das Panel die Werte in eine Datei, was es ermöglicht, die Statistik nach Beendigung der Arbeit nicht zu unterbrechen.
Eingabeparameter:
-Intervall zur Aktualisierung des Spreads für Paare (sec) Hier können Sie angeben, wie oft
FREE
Dieser Indikator kann Ihnen in Kombination mit seiner Slave-Version einen besseren Überblick im visuellen Backtesting-Modus verschaffen. https://www.mql5.com/en/market/product/61574 Sie helfen Ihnen bei der Entwicklung einer Handelsstrategie für mehrere Zeitrahmen. 1) Führen Sie einen Backtest im visuellen Modus durch 2) Fügen Sie den Master-Indikator in den Backtesting-Chart ein 3) Fügen Sie die Slave-Indikatoren zu anderen Charts desselben Symbols mit unterschiedlichen Zeitrahmen hinzu. Starte
FREE
Wenn Sie diesen Indikator mit der Master-Version kombinieren, erhalten Sie eine bessere Übersicht im visuellen Backtesting-Modus. https://www.mql5.com/en/market/product/61572 Sie helfen Ihnen bei der Entwicklung einer Handelsstrategie für mehrere Zeitrahmen.
1) Führen Sie einen Backtest im visuellen Modus durch
2) Fügen Sie den Master-Indikator in den Backtesting-Chart ein
3) Fügen Sie die Slave-Indikatoren zu anderen Charts desselben Symbols mit unterschiedlichen Zeitrahmen hinzu.
Starten
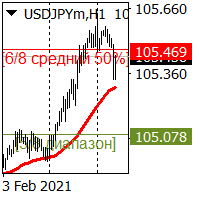
Der Indikator zeigt Unterstützungs- und Widerstandsniveaus genau an. Visualisiert wichtige starke Niveaus und durchschnittliche Stärke-Niveaus auf dem Diagramm.
Es ist wichtig, dass der Indikator nicht abhängig von der Änderung des Zeitrahmens neu gezeichnet wird.
Der Indikator kann für jede Form des Handels verwendet werden, Scalping, mittelfristiger Handel... für jedes Währungspaar.
Für den mittelfristigen Handel empfehlen wir die Verwendung der Standardparameter.
Alle Parameter des Indik
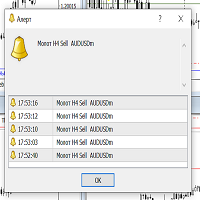
Der Indikator ist sowohl für erfahrene Trader als auch für Anfänger geeignet. Zeigt das HAMMER-Kerzenmuster an.
Scannt gleichzeitig H1, H4 und D1 und zeigt den entsprechenden Alarm auf dem Bildschirm an, begleitet von einem akustischen Signal.
Der Alarm zeigt Informationen über den Zeitrahmen des Musters und das Handelssymbol, auf dem das Muster erschienen ist.
Nur Sie können auf der Grundlage des Musters entscheiden, ob Sie in den Markt einsteigen. Da es besser ist, von den Unterstützungs-

Dieser Indikator berechnet die Korrelation zwischen Währungspaaren (vom Benutzer ausgewählt), um die am wenigsten und/oder am stärksten korrelierten Symbole in Echtzeit zu finden. Die Korrelation reicht von -100% bis +100%, wobei -100% für Währungen steht, die sich in entgegengesetzte Richtungen bewegen (negative Korrelation) und +100% für Währungen steht, die sich in dieselbe Richtung bewegen.
Hinweis Eine Korrelation von mehr als 80 (einstellbar) zwischen zwei Währungspaaren zeigt, dass sie i
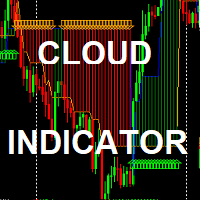
The Simple Cloud Indicator : (KOSTENLOS für begrenzte Zeit zum Testen) Strategie: Die Strategie basiert auf dem Indikator der gleitenden Durchschnitte zusätzlich zu den Unterstützungs- und Widerstandsniveaus. *Sie funktioniert auf jedem Zeitrahmen *funktioniert mit beliebigen Symbolen *erzeugt Warnungen *Sie zeichnet Aufwärts-/Abwärtstrendwolken und BUY/SELL-Pfeile Eingaben : *gezeichneter Startpunkt (in Balken): hat keine Auswirkung auf die Strategie - es gibt Ihnen nur die Tiefe der Indikatorg
Der Ergodic ist ein Oszillator, der auf dem True Strength Index von William Blau basiert, der auf dem Momentum basiert, auf den eine doppelte Glättung angewendet wurde. 100* EMA(EMA(Momentum) / EMA(EMA( |Momentum|)) Der Ergodic fügt dem TSI einen gleitenden Durchschnitt hinzu, der als Signallinie fungiert. Dieser Oszillator kann verwendet werden, um Trendumkehrzonen oder Phasen der Trendfortsetzung zu identifizieren.
ER IST SEHR NÜTZLICH, WENN ER IN VERBINDUNG MIT DEM WÄHRUNGSINDEX VERWENDET WI
FREE

Gleitender Indikator. Er ist so geschrieben, dass er keine Signale gibt, wenn sich zwei gleitende Durchschnitte kreuzen. Er ist einfach zu bedienen und hat sich bei europäischen und asiatischen Währungen bewährt. Er ist für den langfristigen und mittelfristigen Handel konzipiert. Indikator für gleitende Durchschnitte. Er ist so geschrieben, dass er ein Signal gibt, wenn sich zwei gleitende Durchschnitte kreuzen. Einfache Bedienung, gute Performance bei europäischen und asiatischen Währungen, für
FREE
Namiri Trade Engine ist ein ALLES IN EINEM Handelssystem, das die Preisstruktur, den Volumendruck, die Marktbedingungen und das Risikomanagement kombiniert, um Ihnen die BESTEN Chancen für A+ Handels-Setups mit automatischer Losgröße zu bieten
WARTEN SIE AUF IHR A+ SETUP || NUR IHREN A+ HANDEL NUTZEN || RINSE WIEDERHOLEN SIE IHREN A+ MOVE
Chart-Funktionen
Panel - Zeigt Informationen zu Vermögenswert, Markt, Preis, Pip, Konto, Handel und Gewinn/Verlust Struktur - Zeigt Bereiche von Unterstützun

Eine Top-Qualität von dem berühmten XSuper Trend Indikator. Er ist dem ursprünglichen Algorithmus vollständig treu und implementiert viele nützliche Funktionen, die Trendindikatoren wie Filter wie MACD, CCI und Alligator beinhalten. Der Chefs Super Trend Plus Indikator ist eine hervorragende Möglichkeit, den aktuellen Markttrend zu erkennen. Der Indikator zeigt eine klare Unterscheidung zwischen Auf- und Abwärtstrends. Der Indikator verfügt über optionale Filter für fundierte Signale. Geeignet
Binäre Optionen sind die Märkte, auf denen die ausgewählten Vermögenswerte entsprechend den Schätzungen gehandelt werden, in welche Richtung sie sich in einem bestimmten Zeitraum bewegen werden. Was aktiv genannt wird, sind Anlageinstrumente wie Aktien, Devisen und Gold.
Ein Beispiel: Sie glauben, dass sich eines dieser Instrumente in 10 Minuten nach oben bewegen wird. Sie haben eine der entsprechenden Optionen gekauft. Wenn sich Ihre Erwartung bei Ablauf der Frist erfüllt, verdienen Sie fast

Dies ist ein Indikator für MT4, der genaue Signale für den Einstieg in einen Handel ohne Repainting (Neuzeichnen) liefert. Er kann auf alle Finanzwerte angewendet werden: Forex, Kryptowährungen, Metalle, Aktien, Indizes. Er liefert ziemlich genaue Schätzungen und sagt Ihnen, wann es am besten ist, eine Position zu eröffnen und zu schließen. Sehen Sie sich das Video (6:22) mit einem Beispiel für die Verarbeitung nur eines Signals an, das sich für den Indikator gelohnt hat! Die meisten Händler ver
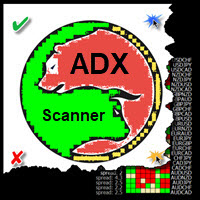
Der Handel in Richtung eines starken Trends reduziert das Risiko und erhöht das Gewinnpotenzial. Im Allgemeinen wird der durchschnittliche Richtungsindex (ADX) verwendet, um zu bestimmen, wann der Preis stark im Trend liegt. In vielen Fällen ist es der ultimative Trendindikator! Der Trend mag zwar Ihr Freund sein, aber es hilft sicher zu wissen, wer Ihre Freunde sind.
ADX wird verwendet, um die Trendstärke zu quantifizieren. ADX-Berechnungen basieren auf einem gleitenden Durchschnitt der Erwei

Signale werden nur zum Kauf gesendet Der Indikator ist für binäre Optionen konzipiert Das Signal wird gegeben, wenn eine neue Kerze erscheint; Signale für 1-2 Minuten wird empfohlen Verwenden Sie die Ablaufzeit und nicht mehr als eine Kerze des verwendeten Zeitrahmens und möglicherweise mehr je nach Markt und Sitzung Es wird empfohlen, während der amerikanischen Sitzung zu handeln Während der Testphase des Produkts wurde kein Redrawing gefunden, wenn überhaupt, kontaktieren Sie uns bitte, eine T

Der IndicateMe-Indikator wurde speziell entwickelt, um so viel Rauschen wie möglich aus den von ihm abgegebenen Signalen zu entfernen.
Der Indikator wurde mit mehreren anderen bekannten Indikatoren kombiniert. Verwendete Indikatoren: "Gleitender Durchschnitt, stokastischer Indikator, relativer Stärkeindex, gleitend".
Alle verwendeten Indikatoren können von Ihnen selbst angepasst werden. Die Standardeinstellungen sind auf die Werte eingestellt, die ich gerne verwende.
Stellen Sie einfach War

Der StatZigZag-Indikator sieht aus wie ein normaler ZigZag , basiert aber auf völlig anderen Algorithmen. Der StatZigZag-Indikator ist eine gestrichelte Linie, die sich aus unterschiedlich langen Regressionssegmenten zusammensetzt, wobei der Anfang jedes dieser Segmente vom Ende des vorherigen Segments ausgeht. Jedes Regressionssegment wird so lange gebildet, bis die Varianz oder Streuung des Preises um es herum einen bestimmten kritischen Wert zu überschreiten beginnt, woraufhin die Konstruktio
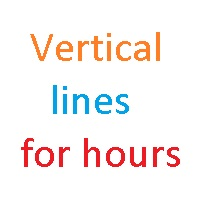
Vertikale Linien für die Stunde - Zeitbasierter Handelsindikator Mit dem Indikator Vertikale Linien für die Stunde können Sie bis zu 4 vertikale Linien zu bestimmten Zeiten in Ihrem Chart markieren. Geben Sie einfach die Stunde ein, ohne die Minuten zu berücksichtigen, und Sie können auch die Farbe für jede Linie wählen. Dieser Indikator ist nützlich für die Identifizierung von Sitzungsspannen oder die Umsetzung von individuellen Handelsstrategien. Er bietet eine unkomplizierte Lösung für Ihre H
FREE
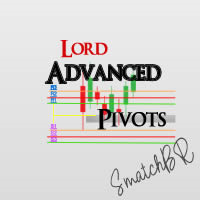
Der LordAdvancedPivot-Indikator ist ein Indikator für META TRADER 4, mit der Funktion der Analyse der wichtigsten täglichen Kanäle des Währungspaares, bekannt als RESISTANCE, SUPPORT und PIVOT (Mitte), um die Ebenen zu bestimmen, auf denen die Marktstimmung von "bullish" "zu" niedrig " ändern kann.
Pivot-Punkte können Punkte sein, die Trendlinien, Fibonacci-Levels, gleitenden Durchschnitten, früheren Hochs/Tiefs oder Abschlüssen und vielen weiteren Indikatoren entsprechen, je nach Philosophie
LordCandleSignal ist ein Indikator für META TRADER 4, der standardmäßig ENVELOPES, STOCHASTIC, RSI-Techniken mit Lord-Strategien in seinem Quellcode verwendet.
LordCandleSignal gibt ein neues Kauf-/Verkaufssignal durch seine Strategie vor der Aktion aus, das heißt, das Signal kommt, bevor es passiert.
Schwierig, Fehler zu machen, jedes Signal gesendet, ist es möglich, profitabel zu schließen, noch bevor das nächste Signal, oder mit dem Lord-Strategie, Schließen profitabel alle 20-50 Pips in e

Der Indikator zeigt Einstiegspunkte mit einem Risiko-Ertrags-Verhältnis von 1 bis 5. Hauptzeitrahmen H1. Funktioniert bei jedem Paar. Die Hauptlogik - ist es, ein Umkehrniveau zu finden und dann die Preisreaktion auf dieses Niveau zu verfolgen. Benötigt keine Einstellungen. Standardmäßig malt es 5 Ebenen des gleichen Take-Profit (rot / blau für Verkäufer und Käufer) und 1 Stop-Loss-Ebene - orange. ACHTUNG! Die Vollversion des Indikators. Sie können die volle Arbeit des Indikators kostenlos nur

Scanner und Dashboard für den Cycle Sniper ATR Fibo Channels Indikator
Wie die Benutzer wissen, zeichnet der Indikator Fibonacci-Kanäle und Pfeile nach den Einstellungen des Benutzers.
Mit CS ATR Fibo Channels Scanner haben Sie die Möglichkeit, den Markt zu beobachten.
- Multi Zeitrahmen - Mehrere Instrumente
Geben Sie die zu beobachtenden Parameter ein (wie in Cycle Sniper ATR Fibo Channels Indikator erklärt)
- Wenn Sie "Pfeile nach ATR-Levels" wählen, erhalten Sie die potenziellen Umkehrp
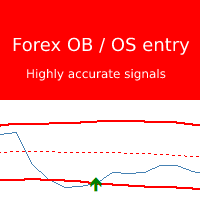
Der Forex Überkauft / Überverkauft Indikator basiert auf einer sehr leistungsfähigen Strategie, die sehr genaue Einstiegspfeile liefert. Der Indikator platziert Pfeile auf "neue Kerze" und malt NICHT neu! Dieser Indikator ist ein MUST HAVE , wenn Sie mit einer Umkehrstrategie handeln. Dieser Indikator kann leicht mit Ihren anderen Handelsindikatoren kombiniert werden, um Umkehrungen oder Tiefs zu bestätigen. Wenn Sie jemals Probleme hatten, korrekte Einstiege zu finden, ist dieser Indikator das
FREE

SONDERANGEBOT. DER NÄCHSTE PREIS WÄRE 125 USD.
HAWA freut sich, Ihnen den Price Action Setup Indikator für alle Symbole mit hoher Erfolgsquote vorstellen zu können. Sein fortschrittlicher Algorithmus findet für Sie die Stellen, an denen sich smartes Geld in den Markt hinein oder aus ihm heraus bewegt. Der Indikator erzeugt Signale mit vorberechneten Einstiegs- und Ausstiegslevels, so dass das Money Management an Ort und Stelle bleibt. Das System zielt darauf ab, kleine, stetige und beständige
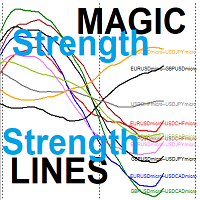
die MAGIC Smooth Strength-Linien für Devisenpaare Jede Linie stellt die relative Stärke von zwei Paaren aus 5 vom Benutzer eingegebenen Symbolen dar -> 10 Indikatorlinien Ihre Strategie basiert auf der Auswahl der schwächeren Stärke-Linie und dem Warten auf ein Umkehrsignal ODER Ihre Strategie basiert auf der Auswahl der stärkeren Stärke-Linie und dem Warten auf ein Umkehrsignal Wenn die Umkehrung eintritt, handeln Sie mit den beiden Symbolen, die durch diese Linie dargestellt werden. wie die r

Sie können z . B. den Croisement MA auf D1, die Grundtendenz, die Niveaus von Surachat und Survente des RSI auf H4 und der Stochastik auf H4 überwachen .
Cet indicateur surveille: den Anstieg der Mobilfunkfrequenzen das Niveau von Surachat / Survente du RSI das Niveau von Surachat / Survente du stochastique IL benachrichtigt Sie, wenn die drei Filter Ihren Parametern entsprechen (Push, Pop, Mail) Sie können wählen, ob Sie die Grafik für eine einzelne Einheit oder für mehrere Paare in derselben
KT Candlestick Patterns erkennt und markiert in Echtzeit die 24 zuverlässigsten japanischen Kerzenmuster. Bereits im 18. Jahrhundert nutzten japanische Händler diese Muster zur Vorhersage der Kursrichtung. Natürlich ist nicht jedes Kerzenmuster gleich zuverlässig. In Kombination mit anderen technischen Methoden wie Unterstützung und Widerstand liefern sie jedoch ein klares Bild der Marktlage.
Dieser Indikator enthält viele Muster, die ausführlich im Buch „Japanese Candlestick Charting Techniqu

Regressionsmodelle beschreiben die Beziehung zwischen Variablen, indem sie eine Linie an die beobachteten Daten anpassen. Lineare Regressionsmodelle verwenden eine gerade Linie, während logistische und nichtlineare Regressionsmodelle eine gekrümmte Linie verwenden. Mit der Regression können Sie abschätzen, wie sich eine abhängige Variable ändert, wenn sich die unabhängige(n) Variable(n) ändern.
Die einfache lineare Regression wird verwendet, um die Beziehung zwischen zwei quantitativen Variabl

Was ist ein Pivot?
Ein Pivot ist ein im Voraus bekanntes signifikantes Preisniveau, das Händler als wichtig erachten und möglicherweise Handelsentscheidungen um dieses Niveau treffen. Als technischer Indikator ähnelt ein Pivot-Preis einem Widerstands- oder Unterstützungsniveau. Wenn das Pivot-Level überschritten wird, wird erwartet, dass sich der Preis in diese Richtung fortsetzt. Oder der Preis könnte sich auf oder nahe diesem Niveau umkehren.
Was sagt Ihnen ein Pivot?
Es gibt Drehpunkte un
Der Handel in Richtung eines starken Trends reduziert das Risiko und erhöht das Gewinnpotenzial. Im Allgemeinen wird der durchschnittliche Richtungsindex (ADX) verwendet, um zu bestimmen, wann der Preis stark im Trend liegt. In vielen Fällen ist es der ultimative Trendindikator! Der Trend mag zwar Ihr Freund sein, aber es hilft sicher zu wissen, wer Ihre Freunde sind.
ADX wird verwendet, um die Trendstärke zu quantifizieren. ADX-Berechnungen basieren auf einem gleitenden Durchschnitt der Erwei

Zweck:
Die Funktion dieses Indikators besteht darin, 3 Linien mit gleitenden Durchschnitten (MAs) auf dem Haupt-MT4-Preisdiagramm zu zeichnen.
Die MAs stammen aus 3 verschiedenen Zeiträumen, die vom Benutzer unabhängig von dem aktuell angezeigten Diagramm festgelegt wurden.
Wenn Sie Ihre Diagrammansicht durch verschiedene Zeitrahmen schalten, zeigen die 3 MAs weiterhin die MA-Linien für die in den Eigenschaften angegebenen Zeitrahmen an.
Beispiel:
In den Standardeinstellungen sind drei MAs
FREE
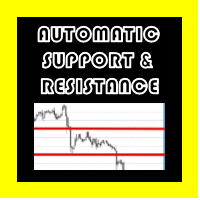
Automatische Unterstützung und Widerstand Osw MT4
Dieser Indikator zeigt grafisch Linien an den möglichen Unterstützungs- und Widerstandspunkten des ausgewählten Assets.
es funktioniert in mehreren Zeitlichkeiten.
ermöglicht Ihnen die Konfiguration von:
Farbe der Linien. Breite der Linien. Art der Linien. Wenn der Indikator seinen Betrieb aufnimmt, analysiert er die Stützen und Widerstände höherer Ebenen auf die Zeitlichkeit, in der er arbeitet.

#EasyWayTradePanel Indikator für #MetaTrader4 , ist Handel Assistenten für den manuellen Handel in jeder #Währung in #FOREX , #CRYPTOCURRENCY als #Bitcoin , #Ethereum , #Lightcoin und mehr. Auch ist EasyWay zu verwenden für #COMMODITY als #Gold , #Silber , #Öl , #Gas ...... und #CFDs . Wenn der Indikator auf dem Chart in dem von Ihnen gewählten Zeitrahmen und Handelsinstrument installiert ist, zeichnet er automatisch die folgenden benutzerdefinierten Indikatoren, die in der EasyWayTradePanel Ha

Signal-Trend-Indikator.
Erkennt die Richtung des Trends und ist entsprechend gefärbt.
Verfügt über eingebaute akustische und visuelle Warnungen bei Trendänderungen.
Kann Benachrichtigungen an Ihr Telefon oder Ihre E-Mail senden.
Ermöglicht Trend- und Gegentrend-Handel.
Funktioniert mit allen Zeitrahmen, allen Währungspaaren, Metallen, Indizes und Kryptowährungen.
Kann mit binären Optionen verwendet werden.
Unverwechselbare Merkmale Kein erneutes Zeichnen; Einfache und klare Einstellungen

Dieser Indikator verwendet den Center of Gravity (COG) Indikator, um die besten Trades zu finden.
Es handelt sich um einen reversal-basierten Swing-Indikator, der einen Arrows-Indikator enthält . Diesen können Sie hier im Metatrader Market kaufen.
In diesem Blogbeitrag finden Sie eine ausführliche Anleitung und Links zu kostenlosen Scannern: https://www.mql5.com/en/blogs/post/758262
Scanner needs this arrows indicator in same directory to run
Kopieren Sie den Scanner ex4 in denselben Ordner
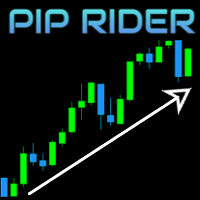
Haben Sie es satt, überladene Indikatorencharts zu betrachten? Sind Sie ein Trend-Trader? Ich habe genau die richtige Lösung für Sie. Trend Boss.
Mit diesem Indikator können Sie einige der populärsten Trendidentifikatoren wie CCI (Supertrend) oder Ichimoku auswählen und sie mit einigen der populärsten Eingaben wie Kijun/Tenkan-Kreuz oder MACD-Nullkreuz kombinieren. Sie können Ihre Charts jetzt sauber halten, indem Sie all diese Oszillatoren und gleitenden Durchschnitte ausblenden. Es werden nu

Fibonacci-Retracements können verwendet werden, um Unterstützungslinien zu zeichnen, Widerstandsniveaus zu identifizieren, Stop-Loss-Orders zu platzieren und Zielkurse festzulegen. Die erweiterten automatischen Fibonacci-Retracements zeichnen automatisch alle Niveaus ein. Sie haben eine Vielzahl von Optionen zur Auswahl. Zum Beispiel können Sie die Tracements eines anderen Zeitrahmens (MTF) im aktuellen Chart verwenden, Sie können auch zwischen dem nächstgelegenen Level oder einem weniger nahen
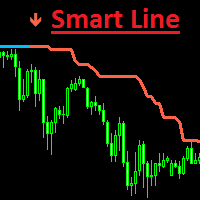
Smart Line ist ein Trendindikator. Er hilft Ihnen, Trendumkehrpunkte zu finden. Diese Handelsstrategie ist für den Trendhandel konzipiert. Der Algorithmus des Indikators bestimmt den Trend bei verschiedenen Handelsinstrumenten in unterschiedlichen Zeitintervallen genau.
Der Smart Line-Indikator kann als zusätzliches Instrument oder als Hauptinstrument verwendet werden.
Die Farbe der Indikatorlinien ändert sich je nach aktuellem Trend, ebenso wie die eingebauten Indikatoren für mögliche Einsti

KOMMERZIELLE SITZUNGEN Dieser Indikator zeigt in der ausgewählten Grafik nach Tabellen aufgeteilt jede der Sitzungen ASIEN, JAPAN, LONDON, NEW YORK an: Ermöglicht Ihnen die Konfiguration: Sitzungsfarbe ASIEN, JAPON, LONDON, NEW YORK Ausblenden und Anzeigen jeder Sitzung Es funktioniert in den niedrigsten Zeitrahmen des Marktes, von denen H4, H1, M15, M5 und M1 empfohlen werden. (Vergessen Sie nicht, sich unsere anderen Indikatoren anzusehen)

Der Trendbildungskanal besteht aus einer Reihe von Linien. Die beiden zentralen Linien des Indikators stellen gleitende Durchschnitte des angegebenen Typs und Zeitraums dar, sie bilden auch einen kleinen Kanal. Der große Kanal wird gebildet - die zentralen Linien des Indikators plus / minus die Standardabweichung Schätzung, multipliziert mit dem Koeffizienten durch den Benutzer ausgewählt. Die Grundregel für die Darstellung lautet, dass etwa 5 % der Kurse außerhalb dieser Linien liegen sollten,

FXC iMACD-DivergencE MT4 Indikator
Dies ist ein fortschrittlicher MACD-Indikator, der Trendwende-Divergenzen auf dem aktuellen Symbol findet. Der Indikator erkennt die Divergenz zwischen dem MACD und den Kursbewegungen als starkes Trendwende-Muster.
Hauptmerkmale: Erweiterte Divergenzeinstellungen
Preis basierend auf Schluss-, Eröffnungs- oder Höchst-/Tiefstkursen Geben Sie offene Kauf-/Verkaufssignale PUSH-Benachrichtigungen
E-Mail-Versand Pop-up-Warnung Anpassbare Informationstafel Eingabe-Par
Hinterlassen Sie eine Bewertung für dieses Produkt, und Sie erhalten ein weiteres "kostenloses" Produkt Ihrer Wahl. Sie können meine anderen Produkte hier sehen: https://www.mql5.com/en/users/zakri/seller
Der Indikator Harmonic Patterns Detector zeichnet harmonische Muster auf dem Chart. Harmonische Muster haben eine hohe Trefferquote von etwa 80 % und eignen sich hervorragend für den Einstieg in den Handel. Sie werden als Preisumkehrpunkte verwendet. Einige von ihnen haben eine lange Geschich

Die Verwendung von Indikatoren ist sehr einfach und enthält keine zukünftigen Funktionen.
Die Verwendung von Indikatoren gliedert sich in die folgenden einfachen Teile:
1. Der Indikator ist blau (Aufwärtstrend) -> nur Kaufaufträge
2. Der Indikator ist rosa (Abwärtstrend) -> nur Verkaufsaufträge
3. Der Indikator ist weiß (Konsolidierungstrend) -> nur abwarten und keine Aufträge senden
4. Der Kurs liegt über dem Indikator -> Nur Kaufaufträge können erteilt werden
5. Der Kurs ist unterhalb d

Dieser Indikator muss in Verbindung mit dem Indikator "Souline Honma Surf" verwendet werden, um eine höhere Gewinnquote zu erzielen.
Die Verwendung der Indikatoren ist äußerst einfach und enthält keine zukünftigen Funktionen.
Die Verwendung der Souline Honma Wave Indikatoren ist in die folgenden einfachen Teile unterteilt:
1. Der Indikator ist blau (Aufwärtstrend) -> nur Kaufaufträge
2. Der Indikator ist rosa (Abwärtstrend) -> nur Verkaufsaufträge
Die Verwendung des Souline Honma Surf In
Der MetaTrader Market ist die beste Plattform für den Verkauf von Handelsroboter und technischen Indikatoren.
Sie brauchen nur ein gefragtes Programm für die MetaTrader Plattform schreiben und schön gestalten sowie eine Beschreibung hinzufügen. Wir helfen Ihnen, das Produkt im Market Service zu veröffentlichen, wo Millionen von MetaTrader Benutzern es kaufen können. Konzentrieren Sie sich auf dem Wesentlichen - schreiben Sie Programme für Autotrading.
Sie verpassen Handelsmöglichkeiten:
- Freie Handelsapplikationen
- Über 8.000 Signale zum Kopieren
- Wirtschaftsnachrichten für die Lage an den Finanzmärkte
Registrierung
Einloggen
Wenn Sie kein Benutzerkonto haben, registrieren Sie sich
Erlauben Sie die Verwendung von Cookies, um sich auf der Website MQL5.com anzumelden.
Bitte aktivieren Sie die notwendige Einstellung in Ihrem Browser, da Sie sich sonst nicht einloggen können.