

Bloch's Relative Moving Average (RMA) Framework Implementation In MQL5
 1 725
1 725
 0
0

Introduction
Classical moving averages summarize recent price with a single smoothed value, but they do not describe where the current price sits relative to its own recent distribution. A high close can mean different things: it may be unusually far from everything around it, or it may be high and yet still common within the session, matched a dozen times already. A single smoothed number cannot tell these cases apart.
The Relative Moving Average (RMA), introduced by Daniel Alexandre Bloch in his work A Course on Systematic Trading with RMA, addresses that gap. Instead of reducing a window of prices to one average, it treats the window as a small distribution, ranks the current price inside it, and expresses that rank on a clean [0, 1] scale that means the same thing on any instrument. The result is not a smoother line but a positional reading: where price sits in the local structure of the market rather than what the average happens to be.
In this article, we faithfully port that framework into a working MetaTrader 5 system. It includes an indicator engine that computes the RMA curves and their fractiles, a regime detector that classifies the market as expanding, contracting, or in transition, and an Expert Advisor that implements all four of the paper's cross-strategies. We keep close to the source throughout, quoting the paper where its definitions are precise, and we finish with an honest look at how the completed system behaves in the Strategy Tester.
We will cover:
- The RMA Framework
- Architecture and the Buffer Contract
- The RMA Engine: Computing the Curves
- The Indicator Layer
- Reading the Regime
- The Four Strategies
- The Expert Advisor
- Results
- Conclusion
The RMA Framework
The paper is written by Dr. Daniel Bloch, a quantitative researcher, and the full text is available on SSRN as A Course on Systematic Trading with RMA. The RMA is not proposed as a better smoother but as a tool for a specific kind of market: one that is non-stationary and discontinuous, where the assumptions behind classical momentum and mean-reversion break down.
This distinction explains every design choice that follows. A classical moving average carries a hidden assumption: that a level or a crossover computed on yesterday's data still means the same thing today. Real markets are not stationary; volatility clusters and subsides, trends give way to ranges without warning, and prices jump on news, so a fixed level is a moving target and a smoothed average lags precisely when the market is doing something worth reacting to. The RMA's response is to describe rather than predict: to measure where price is right now, relative to a distribution recomputed on every bar, so the reading is always expressed in the market's current terms.
This is also why the fractile, not the raw deviation, is the quantity the strategy trades on. A deviation of a few pips means one thing in a quiet session and something else in a volatile one, whereas a fractile, being a rank inside the window's own distribution, is self-normalising: "in the top tenth of everything the window has seen" holds its meaning whether the window spans ten pips or a hundred.
The construction. Fix a window size W and slide it along the price series. On each bar, take the trailing window of W closes and compute their simple moving average (SMA). This SMA is the local equilibrium: the RMA framework fixes it at zero and measures everything as a deviation from it. The paper describes the strategy's aim in these terms:
The normalised price levels, denoted by (w, mid, 1), fluctuate between the minimum and maximum of the distribution [...] The strategy aims to 'ride' these oscillations: entering long positions when prices move from the minimum toward the maximum, and short positions when they reverse from the maximum toward the minimum.
To turn that intuition into numbers, the window is re-expressed as a distribution of normalised returns. Each close in the window is divided by the window's own SMA and shifted by one, so a value of zero means "equal to the local average" and the sign tells you which side of it you are on. The current close, the first, the middle, the minimum, and the maximum of the window each get a normalised value; these are the landmarks the strategy tracks. The current one, denoted w, is the one that moves bar to bar.
From values to fractiles. A normalised return of, say, 0.002 is not directly comparable across instruments or across volatility regimes. The framework solves this by mapping each landmark to its fractile, its rank inside the window's own distribution, on a [0, 1] scale. A fractile of 0.9 means "higher than ninety percent of the window"; a fractile near 0 means "near the bottom of everything the window has seen." Because the fractile is a rank, it is automatically comparable everywhere. The paper puts the purpose plainly:
We also map its curves [...] to corresponding fractile values [...] This transforms the RMA indicator into a representation on a [0, 1] scale, making it directly comparable across different assets.
So the RMA framework has three layers, and the code that follows mirrors them exactly: the SMA as a moving equilibrium; the RMA family of deviations of each landmark from that equilibrium; and the fractiles, which place the current price inside the window's distribution on a universal scale. Everything the strategy does is expressed on that last layer.

Fig. 1. The RMA construction: a sliding window of closes becomes an SMA, the closes are re-expressed as a distribution of normalised returns about that SMA, and the current price's rank inside that distribution becomes its fractile on the [0, 1] scale
Architecture and the Buffer Contract
Before the mathematics, the shape of the system. The RMA port is deliberately split into three running programs and a set of shared header files, so that each piece does one job and can be reasoned about on its own. The indicator RMA_Engine.mq5 computes every RMA series and publishes it. A pair of sub-window indicators, RMA_Panel.mq5 and the on-chart status panel in RmaDisplay.mqh, present those series. The Expert Advisor RMA.mq5 reads them and places trades. The strategy logic itself lives in header-only classes, RmaCore, RegimeDetector, AdverseMonitor, SignalEngine and TradeManager, none of which knows anything about charts or orders beyond what it is handed.
RmaTypes.mqh defines the vocabulary every other file speaks. Two enumerations carry most of the meaning. The first names the market regimes; the second names the leg of the cross a position belongs to, and it is worth showing in full because the four trading strategies are exactly the four middle entries:
enum ENUM_RMA_CROSS_STATE
  {
   RMA_STATE_NONE,
   RMA_STATE_LONG_CROSS_REVERSE,
   RMA_STATE_SHORT_CROSS_REVERSE,
   RMA_STATE_LONG_CROSS_REVERT,
   RMA_STATE_SHORT_CROSS_REVERT,
   RMA_STATE_TREND_FOLLOW_LONG,        // entered long after a short was blocked
   RMA_STATE_TREND_FOLLOW_SHORT        // entered short after a long was blocked
  };
The TREND_FOLLOW states at the end are a safety branch we will meet in the strategy section; the four cross states are the heart of the system. Keeping them in a shared enum, rather than as loose integers, is what lets the signal engine, the trade manager, and the display all agree on which trade is open without ever comparing magic numbers.
The buffer contract. The engine and the programs that read it are coupled by a single, fragile thing: the order of the indicator buffers. MQL5 identifies a buffer by its index, so if the engine publishes the fractile at index 2 and the Expert Advisor reads index 2, they must both mean the same series by it, forever. That agreement is written down once, as an enum, and both sides include it:
enum ENUM_RMA_BUFFER
  {
//--- plotted by the engine (keep first, in plot order)
   RMA_BUF_REGIME_BG       = 0,        // full-height bar, drawn as the backdrop
   RMA_BUF_REGIME_COLOR    = 1,        // colour index into the regime palette
   RMA_BUF_FW              = 2,        // fractile of the window's last normalised return
   RMA_BUF_FMIN            = 3,        // fractile of the window minimum
   RMA_BUF_FMAX            = 4,        // fractile of the window maximum
   RMA_BUF_ALPHA_LO_MEAN   = 5,        // EMA of the lower alpha bound
   RMA_BUF_ALPHA_HI_MEAN   = 6,        // EMA of the upper alpha bound
//--- calculation only, read via CopyBuffer
   RMA_BUF_SMA             = 7,
   RMA_BUF_RMA_W           = 8,        // sma/last  - 1
   RMA_BUF_RMA_1           = 9,        // sma/first - 1
   RMA_BUF_RMA_MID         = 10,       // sma/mid   - 1
   RMA_BUF_RMA_MIN         = 11,       // sma/min   - 1
   RMA_BUF_RMA_MAX         = 12,       // sma/max   - 1
   RMA_BUF_RANGE           = 13,       // spread of normalised returns
   RMA_BUF_ALPHA_LO        = 14,       // raw lower alpha bound
   RMA_BUF_ALPHA_HI        = 15,       // raw upper alpha bound
   RMA_BUF_REGIME          = 16,       // ENUM_RMA_REGIME as a double
   RMA_BUF_D_K             = 17,       // directional consistency of d_med_w
   RMA_BUF_D_MED_W         = 18,       // f_w - 0.5
//--- sentinel
   RMA_BUF_TOTAL           = 19
  };
The ordering is not cosmetic. MQL5 assigns plots to buffer indices in declaration order, and later plots are drawn over earlier ones. That is why every plotted series has to sit ahead of every calculation-only one, and why the full-height regime backdrop occupies index 0: it must not paint over the fractile lines. Adding a plotted series therefore means inserting it before RMA_BUF_SMA and bumping the plot count, never appending at the end. Getting this wrong does not fail to compile; it silently draws the wrong number in the wrong place, which is why the contract is written down once in a file both sides include.
The RMA Engine: Computing the Curves
The numerical heart of the system is RmaCore.mqh. It owns one method, ComputeBar, which is handed a chronological price array and an index, and fills in every series for that bar from the trailing W closes. It is deliberately self-contained: it reads prices and writes numbers, nothing else, which is what lets the indicator, the panel, and the Expert Advisor all rely on identical arithmetic.
The method begins by lifting the window out once and forming the SMA, and then guards against a degenerate mean:
   double sma=sum/W;
   m_sma[i]=sma;

//--- a non-positive mean means the ratios below are meaningless, and
//--- for any real price series it cannot happen. Leave the bar zero.
   if(sma<=0.0)
      return;
Next it locates the window's landmarks (first, last, middle, minimum, maximum) and forms the RMA family: the deviation of the SMA from each landmark, as a ratio. This is the layer that says where the average sits relative to each notable price in the window.
//--- the RMA family: where the mean sits relative to each landmark.
   if(last_elem>0.0)
      m_rma_w[i]=(sma/last_elem)-1.0;
   if(first_elem>0.0)
      m_rma_1[i]=(sma/first_elem)-1.0;
   if(mid_elem>0.0)
      m_rma_mid[i]=(sma/mid_elem)-1.0;
   if(min_elem>0.0)
      m_rma_min[i]=(sma/min_elem)-1.0;
   if(max_elem>0.0)
      m_rma_max[i]=(sma/max_elem)-1.0;
Each is a ratio with a plain reading. rma_w is where the average sits relative to the current price: positive when the average is above the latest close (a candidate low), negative when the close has pushed above the mean. rma_min and rma_max anchor the extremes of the same window, and it is the span between them, together with where rma_w falls inside it, that tells the strategy whether the current price is stretched to an edge of its recent range or sitting in the middle.
Then it re-expresses the whole window as normalised returns about the SMA, tracking the smallest and largest as it goes, and computes the fractiles of the three landmarks that the strategy actually reacts to: the current price w, the window minimum, and the window maximum.
//--- re-express the window as returns about its own mean, then rank
//--- the current, minimum and maximum members within that spread.
   double norm_min=0.0;
   double norm_max=0.0;
   for(int j=0;j<W;j++)
     {
      double nr=(m_window_buf[j]/sma)-1.0;
      m_norm_buf[j]=nr;
      if(j==0 || nr<norm_min)
         norm_min=nr;
      if(j==0 || nr>norm_max)
         norm_max=nr;
     }

   m_f_w[i]  =Fractile(m_norm_buf,W,(last_elem/sma)-1.0);
   m_f_min[i]=Fractile(m_norm_buf,W,(min_elem/sma)-1.0);
   m_f_max[i]=Fractile(m_norm_buf,W,(max_elem/sma)-1.0);

   m_range[i]=norm_max-norm_min;
These buffers feed the regime detector and the EA; the plotted oscillator is only a visual projection of the same values. The range computed on the last line, the spread between the largest and smallest normalised return, is the raw material for regime detection in the next section. But first, the fractile itself.
The fractile function. The paper defines compute_fractile in its appendix on useful functions. It is the plain empirical cumulative distribution: the fraction of the window that lies at or below the queried value.
f_i = (1 / |W_i|) * sum_j I( W_ij <= v_i ) Here I(...) is the indicator function, so the sum counts how many window members are at or below v_i and divides by the window size. The implementation follows that definition exactly. The header records three points worth noting: first, it is compute_fractile verbatim from the paper's appendix; second, at the window minimum f_w floors at 1/n rather than reaching 0 as section 9.3's prose claims, because the minimum is at or below only itself, a prose-vs-appendix inconsistency we leave as the appendix has it; and third, the scan is linear rather than sorted, since the caller already walks the window once per bar.
//+------------------------------------------------------------------+
//| Where 'value' ranks inside 'dist': the share of the window that  |
//| is at or below it. This is compute_fractile verbatim from the    |
//| paper's Appendix 14.1.1.2,                                       |
//|     f_i = (1/|W_i|) * sum_j I( W_ij <= v_i ),                    |
//|  the plain empirical CDF. Fidelity to the paper is the spine of  |
//|  the port, so the listing wins over any inferred convention.     |
//|                                                                  |
//|  9.3 claims f_w reaches 0 at the window minimum, but this ECDF   |
//|  floors at 1/n there (the minimum is <= only itself); f_max      |
//|  still hits 1. That 1/n gap is the paper's own prose-vs-appendix |
//|  inconsistency, left as the appendix has it rather than patched. |
//|                                                                  |
//|  Linear rather than sorted-and-bisected: the caller already      |
//|  walks the window once per bar, so a second pass beats a sort.   |
//+------------------------------------------------------------------+
double CRmaCore::Fractile(const double &dist[],const int n,const double value) const
  {
   if(n<=1)
      return 0.5;

   int at_or_below=0;
   for(int i=0;i<n;i++)
     {
      if(dist[i]<=value)
         at_or_below++;
     }

   return (double)at_or_below/(double)n;
  }
Because w, the minimum, and the maximum are all members of the same window they are ranked against, f_max is always one and f_min is the smallest achievable fraction, so "near the top of the distribution" is simply "fractile near 1" on any symbol.

Fig. 2. The fractile of a value is the share of the window at or below it: sliding the query value from the window minimum to its maximum sweeps the fractile from its floor up to 1
The engine publishes all of this through RMA_Engine.mq5, a multi-buffer indicator that runs CRmaCore and exposes the fractile curves as plotted lines and the rest as calculation buffers. In its own sub-window, it doubles as an oscillator: the fractile of the current price tracks between its floor and 1 as price cycles around the local average, and behind those lines the engine shades the window by regime, so the expansion and contraction phases we build in the next section are visible at a glance against price.
Six elements are drawn in that sub-window: three fractile lines, two alpha-band lines, and the regime backdrop behind them. The three fractiles are the ones just built: f_w (the solid line) with the dotted f_min and f_max marking the floor and ceiling of the window's distribution. The two alpha-band lines are a smoothed alpha band: alpha_lo is EMA(f_w) and alpha_hi is EMA(1 - f_w). The band is visual context only, opening when price has sat persistently to one side of its window and pinching when it has oscillated through the middle; nothing downstream trades on it, as the signal engine reads f_w, the regime, and the adverse pair alone. The indicator figures in this section and the next two sections use EURUSD M30, where the oscillation is easy to read by eye; the Strategy Tester run later is on the same symbol at H2, the timeframe the parameters were settled on.
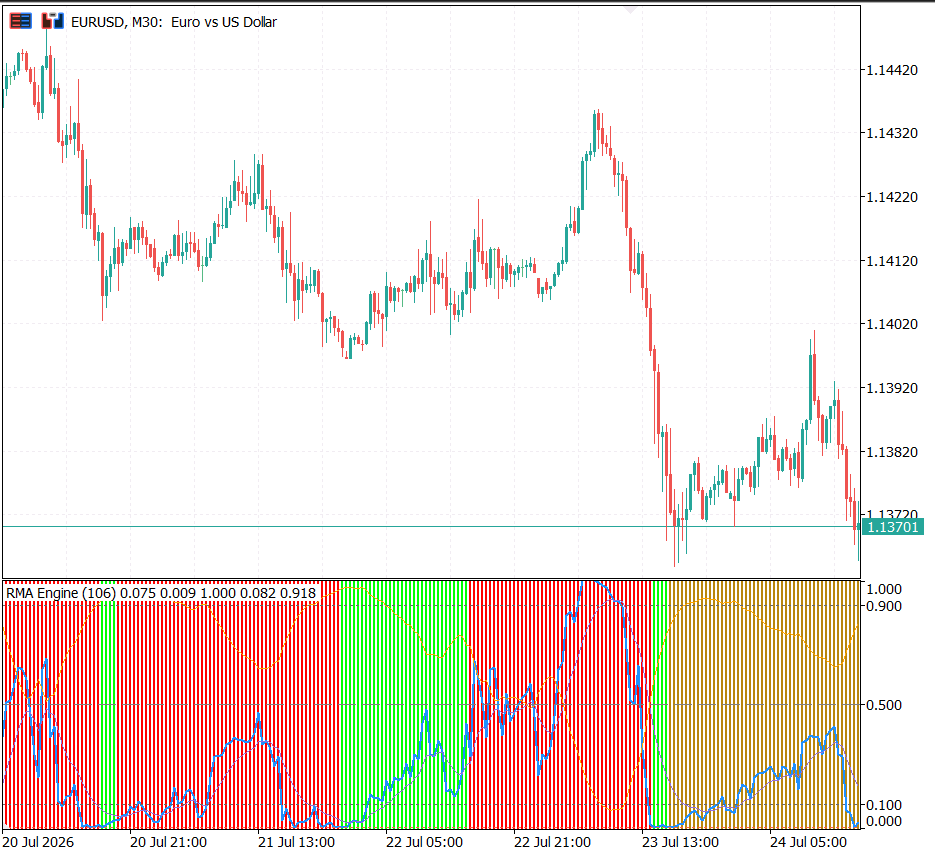
Fig. 3. The RMA engine on EURUSD, M30: f_w oscillating on the [0, 1] scale between the dotted f_min and f_max, the smoothed alpha band (alpha_lo, alpha_hi) as slow context, and the regime backdrop shading expansion, contraction, and transition phases behind them
The Indicator Layer
The engine class does the arithmetic; RMA_Engine.mq5 is the indicator shell that runs it on live bars and exposes the results. It declares itself a separate-window indicator with its vertical axis pinned to the [0, 1] range the fractiles live in, draws the regime as a colour histogram behind six plotted lines, and binds every series to the buffer index the contract assigns it. The interesting part is its OnCalculate, because it has to solve a problem every incremental MQL5 indicator faces: the most recent bar is still forming, and its values will change before it closes.
   int from=(prev_calculated>0)?prev_calculated-1:0;

   for(int i=(prev_calculated>0)?from:0;i<rates_total;i++)
      ClearBar(i);

   if(!g_core.Calculate(close,rates_total,from))
      return 0;
   EmitCore(rates_total,from);

//--- the modules read the buffers the core has just filled, not the
//--- core itself, so a panel or a test harness can drive them from
//--- CopyBuffer output with no change to the classes.
   if(g_regime.Calculate(BufRange,rates_total,from))
      EmitRegime(rates_total,from);

   if(g_adverse.Calculate(BufFw,rates_total,from))
      EmitAdverse(rates_total,from);
The line that matters sets from to prev_calculated-1 rather than prev_calculated, recomputing the bar that was still forming on the previous call: leaving it untouched would freeze a half-formed value into every series that depends on it, so the bar-to-bar fractile difference the strategy reads would be taken between two unfinished numbers. The regime and adverse modules are handed the engine's own output buffers, not the core object, so the same classes can be driven from anywhere that produces those arrays.
Borrowing a second axis. Some series do not belong on a 0-to-1 axis: the rma family is measured in fractions of a percent and d_med_w is centred on zero, so plotting them in the engine's window would flatten them against the fractiles. A companion indicator, RMA_Panel.mq5, opens its own sub-window and mirrors selected engine buffers into it, computing nothing of its own. It first finds the engine already attached to the chart, by name:
//+------------------------------------------------------------------+
//| Find the engine already attached to this chart.                  |
//|  Matching on the short name's prefix rather than the whole       |
//|  string is deliberate: the engine appends its window length, so  |
//|  the panel keeps working when that is retuned - which is exactly |
//|  when a hand-built iCustom handle would quietly fork into a      |
//|  second calculation.                                             |
//+------------------------------------------------------------------+
int ResolveEngine(void)
  {
   long chart=ChartID();
   int  windows=(int)ChartGetInteger(chart,CHART_WINDOWS_TOTAL);

   for(int w=0;w<windows;w++)
     {
      int total=ChartIndicatorsTotal(chart,w);
      for(int k=0;k<total;k++)
        {
         string name=ChartIndicatorName(chart,w,k);
         if(StringFind(name,"RMA Engine")==0)
            return ChartIndicatorGet(chart,w,name);
        }
     }
   return INVALID_HANDLE;
Having located the engine, the panel copies the buffers it was configured to show, handling one pitfall deliberately:
//+------------------------------------------------------------------+
//| Copy one engine buffer into one panel buffer.                    |
//|  The temporary is not redundant. CopyBuffer counts its start     |
//|  position back from the newest bar, so it fills element zero     |
//|  with the oldest bar it was asked for - which is bar 'from',     |
//|  not bar zero. Landing it straight in the plot would shift the   |
//|  whole series left by the length of the history.                 |
//+------------------------------------------------------------------+
bool Pull(const int source,double &dest[],const int total,const int from)
  {
   if(source<0)
     {
      for(int i=from;i<total;i++)
         dest[i]=EMPTY_VALUE;
      return true;
     }

   int count=total-from;
   double tmp[];
   ArraySetAsSeries(tmp,false);
   if(CopyBuffer(g_engine,source,0,count,tmp)!=count)
      return false;

   for(int j=0;j<count;j++)
      dest[from+j]=tmp[j];
   return true;
  }
The panel copies via a temporary array because CopyBuffer returns values oldest-first within the slice requested; writing directly into the destination buffer would misalign the series. In its RMA family mode the panel mirrors rma_w with the window minimum and maximum, so the current price's deviation and the envelope it sits inside can be read on their own scale, below the fractiles.
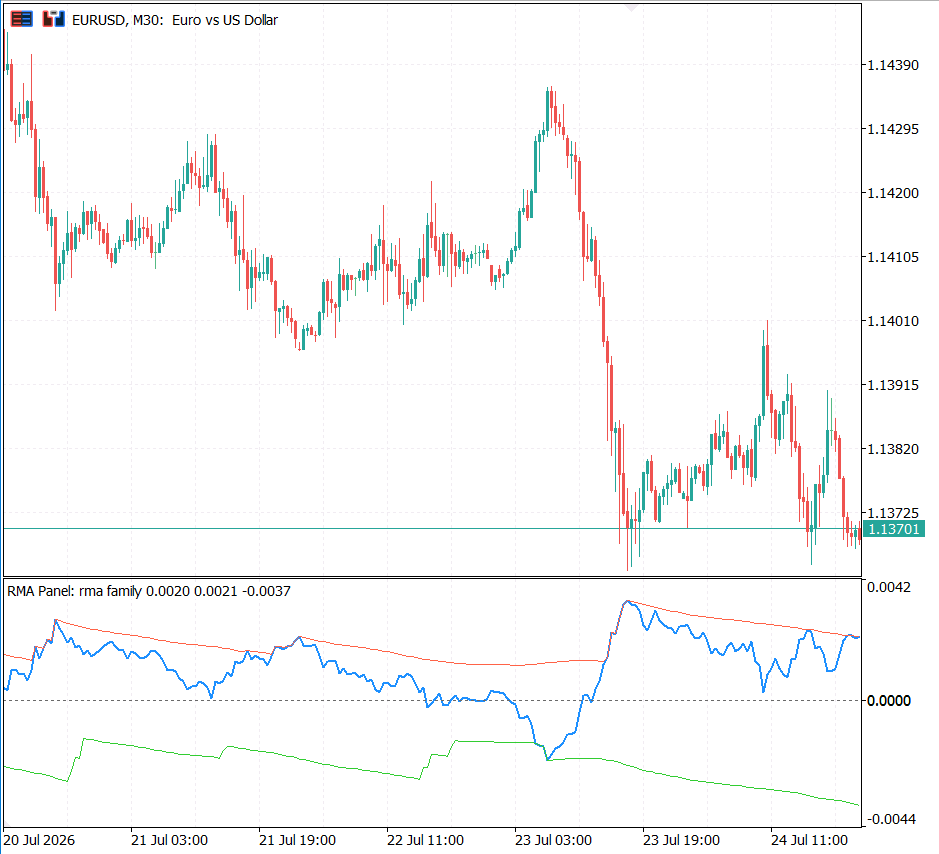
Fig. 4. The RMA family panel on EURUSD, M30: a passthrough sub-window mirroring rma_w with the window minimum and maximum on a second axis, the envelope the current price traverses
The on-chart status panel in RmaDisplay.mqh serves the same read-only purpose from the Expert Advisor side: it writes the current fractile, regime, and leg as text labels, so the state can be read at a glance without opening a data window. Its one reusable idea is how it draws a label:
//+------------------------------------------------------------------+
//| Create or move one text label in the status block.               |
//+------------------------------------------------------------------+
void CRmaDisplay::Label(const string tag,const int row,const int dx,
                        const string text,const color clr)
  {
   string name=m_prefix+"hud_"+tag+"_"+IntegerToString(row);

   if(ObjectFind(0,name)<0)
     {
      ObjectCreate(0,name,OBJ_LABEL,0,0,0);
      ObjectSetInteger(0,name,OBJPROP_SELECTABLE,false);
      ObjectSetInteger(0,name,OBJPROP_HIDDEN,true);
      ObjectSetInteger(0,name,OBJPROP_BACK,false);
     }

   ObjectSetInteger(0,name,OBJPROP_CORNER,m_corner);
   ObjectSetInteger(0,name,OBJPROP_XDISTANCE,m_x+dx);
   ObjectSetInteger(0,name,OBJPROP_YDISTANCE,m_y+row*m_line_height);
   ObjectSetInteger(0,name,OBJPROP_FONTSIZE,m_font_size);
   ObjectSetInteger(0,name,OBJPROP_COLOR,clr);
   ObjectSetString(0,name,OBJPROP_FONT,m_font);
   ObjectSetString(0,name,OBJPROP_TEXT,text);
  }
Labels are created once and updated in place, avoiding duplicate chart objects and redraw flicker: the first call builds the label, every later call just moves and re-texts it.
Reading the Regime
The strategy also needs to know what the distribution itself is doing: whether it is expanding (the range of normalised returns widening, volatility building) or contracting (the range collapsing, the market coiling). These phases alternate, and trades behave differently in each. The paper states the trading rhythm directly:
Trades are typically initiated at the onset of an expansion phase and closed during contraction.
Relative Extremum Ratios. The paper reads the regime geometrically, comparing the current range to its own historical minimum and maximum. Writing R_k for the current range, m_k for its historical minimum and M_k for its historical maximum, it defines two ratios, the Minimum Extremes Ratio R_k / m_k and the Maximum Extremes Ratio R_k / M_k. A range sitting near its historical floor is contraction; a range breaking out toward its historical ceiling is expansion.
This is what RegimeDetector.mqh implements. Its Classify method takes the two extremum ratios along with a least-squares slope of the range and a z-score, and resolves them into one of five states: expansion, contraction, transition-to-expansion, transition-to-contraction, or unknown. Contraction is tested first because it is the strictest, requiring the range to be near its floor and corroborated by either a steady coefficient of variation or a flat slope:
//--- contraction needs the envelope test AND corroboration from
//--- either steadiness or flatness. One reading alone is noise.
   bool contraction_extremum=(r_min_ratio<1.5 && r_max_ratio<m_eps_low);
   bool contraction_steady  =(var_ratio<m_var_ratio_low);
   bool contraction_flat    =(MathAbs(slope)<m_slope_thresh);
   if(contraction_extremum && (contraction_steady || contraction_flat))
      return RMA_REGIME_CONTRACTION;
Expansion is deliberately easier to reach, since a range breaking out of its envelope is itself sufficient evidence:
//--- expansion is deliberately easier to reach: a range breaking out
//--- of its envelope is enough on its own, and so is a strong z-score
//--- once the spread is already twice its recent floor.
   bool expansion_extremum=(r_max_ratio>0.7 && r_min_ratio>m_eps_high);
   bool expansion_zscore  =(z>m_z_expansion);
   if(expansion_extremum || (expansion_zscore && r_min_ratio>2.0))
      return RMA_REGIME_EXPANSION;
Between the two extremes lies a transition band, where neither call is safe. Here the detector uses the slope and z-score to decide which way the market is heading, and if neither commits it holds the previous regime rather than flip-flopping on noise:
//--- the middle band: wide enough to matter, not wide enough to call.
   bool in_transition=(r_max_ratio>m_eps_low && r_max_ratio<1.0 &&
                       r_min_ratio>1.0 && r_min_ratio<m_eps_high);
   if(in_transition)
     {
      if(slope<-m_slope_thresh || z<0.0)
         return RMA_REGIME_TO_CONTRACTION;
      if(slope>m_slope_thresh || z>0.0)
         return RMA_REGIME_TO_EXPANSION;
      return prev;
     }
Directional consistency. Alongside the regime, the system tracks a second, cheaper reading of what the fractile is actually doing bar to bar. This lives in AdverseMonitor.mqh and produces two series. The first, d_med_w, is simply the fractile re-centred on the median, so its sign says which side of the window's middle the current price sits on. The second, D_k, is the share of the last few bar-to-bar moves in d_med_w that were upward, a directional-consistency measure in the spirit of the imbalance ratios the paper uses to characterise a series. Near 1 the fractile has been climbing without pause; near 0 it has been sliding; 0.5 is the coin-flip of a directionless stretch. The computation is a plain count over the lookback:
   for(int i=k_start;i<total;i++)
     {
      int increases=0;
      int decreases=0;
      for(int j=0;j<m_lookback;j++)
        {
         double diff=m_d_med_w[i-j]-m_d_med_w[i-j-1];
         if(diff>0.0)
            increases++;
         if(diff<0.0)
            decreases++;
        }

      int changes=increases+decreases;
      m_dk[i]=(changes>0)?(double)increases/(double)changes:0.5;
     }
The value of this pair is that it makes "the trade is going wrong" precise. A mean-reversion position is offside by construction for a while, so being offside cannot be the exit test. The real warning sign is being offside and watching the fractile keep stepping further offside, which is exactly what a low D_k on the wrong side of the median describes. We will use it directly as a safety exit in the next section.
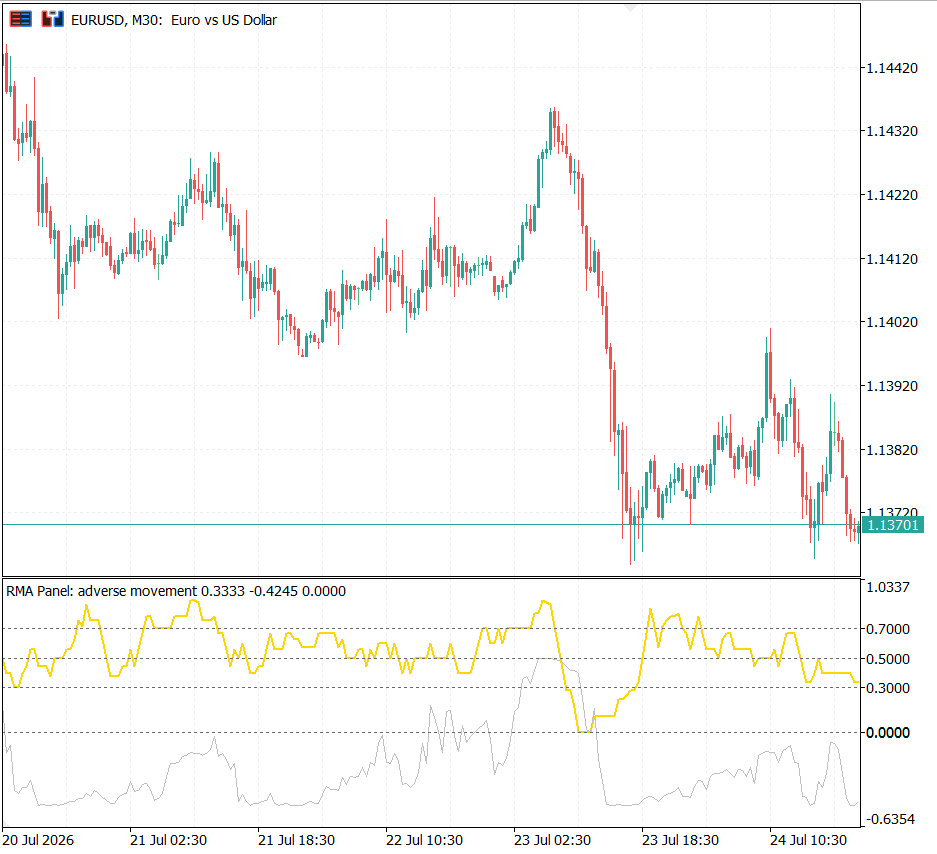
Fig. 5. The adverse panel on EURUSD, M30: d_med_w centred on zero with D_k above it, the directional-consistency reading that gates the safety exit
Together these readings control the exits: the regime uses range geometry to select the exit rule, and the adverse monitor uses fractile-consistency direction to flag a trade going wrong. The regime selects the exit rule, the paper's central contribution and the subject of the next section, and the engine publishes it as the coloured band behind the fractile curves in Fig. 3.
The Four Strategies
The strategy rides traversals of the window's own distribution through four related components, all entered and exited in fractile space and all implemented in SignalEngine.mqh. The two reverse legs bet that a traversal, once started, continues toward the far extreme; the two revert legs bet that a stalled traversal snaps back to where it came from. The vocabulary carries the logic:
- Long-cross-reverse. The fractile leaves the maximum and heads down toward the minimum. We ride that descent by going short. The name describes the price movement, not the position: a downward cross that we trade in reverse.
- Short-cross-reverse. The mirror image. The fractile leaves the minimum and climbs toward the maximum, and we ride the climb by going long.
- Long-cross-revert. A descent that began at the maximum turns back up before reaching the minimum. We follow it back toward the maximum by going long.
- Short-cross-revert. A climb that began at the minimum turns back down before reaching the maximum, and we follow it back toward the minimum by going short.
Between them the four cover both ways a partial move can resolve, and the exit rules decide, bar by bar, which bet the market is currently honouring.
The reverse legs. The paper defines them by where the current price w originates and which way it travels:
We define a long-cross-reverse as a downward movement of the price, originating near the maximum of the distribution and traversing toward the minimum. Conversely, a short-cross-reverse refers to an upward movement starting near the minimum and rising toward the maximum.
The engine handles this in two steps. First, reaching an extreme arms a side: a bar whose fractile is at the top of its range arms a downward traversal, and a bar at the bottom arms an upward one. This arming is the paper's origination test, remembered until it is either consumed by an entry or claimed by the opposite extreme. It happens once per bar, before any decision:
//--- Init refuses thresholds that cross over, so at most one of
//--- these can be true on any bar.
   if(AtMax(b))
     {
      m_armed_max=true;
      m_armed_min=false;
     }
   if(AtMin(b))
     {
      m_armed_min=true;
      m_armed_max=false;
Second, once a side is armed, the entry fires when the fractile crosses a quantile bin in the traversal's direction. A downward crossing from an armed maximum is a long-cross-reverse, entered short; an upward crossing from an armed minimum is a short-cross-reverse, entered long. The extreme itself is not the trigger; the crossing is, which is why an entry can fire anywhere along the traversal:
   int crossing=BinCrossing(b.f_w,b.f_w_prev);
   bool want_short=(m_armed_max && crossing<0);
   bool want_long =(m_armed_min && crossing>0);
The revert legs. Not every traversal completes. Price can leave the maximum, head down, and then turn back before it ever reaches the minimum. The paper handles this with a second pair of components:
The price may begin to move across the distribution from maximum to minimum (or the reverse), but then revert back toward the originating extremum [...] the strategy exits the short-cross or long-cross-reverse position when the normalised price, w, is detected to revert direction and return toward the distribution's extremum.
In the engine, a revert entry is taken from a flat account when an armed traversal turns back toward its origin before reaching the opposite extreme. If the maximum is armed, price has descended past the median, and the fractile now steps back up, that is a long-cross-revert, entered long to ride back toward the maximum; the short-cross-revert is its mirror:
//--- revert: armed, but crossing back past the median toward the origin.
   bool want_revert_long =(m_armed_max && crossing>0 && b.d_med_w<0.0);
   bool want_revert_short=(m_armed_min && crossing<0 && b.d_med_w>0.0);
The adaptive exit. This is where the regime detector earns its place. The paper defines two base exits, and then a third that chooses between them by regime. A Full Distribution Crossover assumes the price fully traverses to the opposite extreme, so the exit of one side coincides with the entry of the other. An Extremum Revert Trigger allows the partial traversals just described. The paper's adaptive rule blends them:
We employ the Extremum Revert Trigger during expansion or transition phases, where partial traversals and reversals are likely. However, once a contraction regime is identified, we switch to the Full Distribution Crossover Exit [...] This combined approach, called Adaptive Crossover Exit, allows the strategy to adapt dynamically to prevailing market conditions.
The engine's Exit method implements exactly that switch. In contraction, and only for the reverse legs that traverse the whole distribution, it uses the crossover exit; otherwise it uses the revert trigger. The revert legs always use the revert trigger, in every regime:
   bool reverse_leg=(m_state==RMA_STATE_LONG_CROSS_REVERSE ||
                     m_state==RMA_STATE_SHORT_CROSS_REVERSE);
   if(reverse_leg && b.regime==RMA_REGIME_CONTRACTION)
     {
      if(CrossoverExit(b,type,pips,o))
         o.action=RMA_ACT_CLOSE_REVERSE;
      return;
     }

   if(RevertExit(b,type,pips,o))
      o.action=RMA_ACT_CLOSE_REVERSE;
The two base exits in code. The Full Distribution Crossover is the exit for a position the market is carrying all the way across the distribution. A short taken as a long-cross-reverse is closed only when the fractile actually reaches the minimum and turns up, and because that turn is itself the origination of a fresh trade the other way, the exit reverses directly into it:
   if(m_state==RMA_STATE_LONG_CROSS_REVERSE && type==1 && AtMin(b) && diff>0.0)
     {
      o.reason="full-width crossover: short carried to the minimum";
      return true;
     }
   if(m_state==RMA_STATE_SHORT_CROSS_REVERSE && type==0 && AtMax(b) && diff<0.0)
     {
      o.reason="full-width crossover: long carried to the maximum";
      return true;
     }
   return false;
The Extremum Revert Trigger is the opposite temperament. Outside a contraction there is no reason to expect the far extreme to be reached, so the position is closed on the first solid evidence that the move it was riding has stopped: a run of quantile-bin steps the wrong way, a crossing back through the median zone, or a single step large enough to speak for itself. For a short carried down from the maximum, those three conditions read as follows:
   if(m_state==RMA_STATE_LONG_CROSS_REVERSE && type==1)
     {
      if(bin<5 && crossing>0 && m_bin_direction>=2)
        {
         o.reason="revert: short, two bins back up";
         return true;
        }
      if(median==1)
        {
         o.reason="revert: short, median zone crossed upward";
         return true;
        }
      if(b.f_w<0.5 && crossing>0 && bin>=3)
        {
         o.reason="revert: short, upward step out of the low bins";
         return true;
        }
      return false;
     }
The signed run length m_bin_direction is what lets the first condition require a genuine reversal rather than a single stray tick: it accumulates while the fractile keeps stepping the same way and resets when the direction changes, so "two bins back up" means the move really has turned, not merely paused.
The safety exit. Above and before either strategy exit sits the adverse-movement check from the previous section. It does not wait for the fractile geometry to resolve; it leaves a position the moment the D_k reading says the market is walking away from it, a long that is below the median while the fractile keeps making lower steps, or the mirror for a short:
   if(type==0 && b.d_med_w<0.0 && b.d_k<m_adverse_down)
     {
      o.reason=StringFormat("adverse: long below median, D_k=%.2f",b.d_k);
      return true;
     }
   if(type==1 && b.d_med_w>0.0 && b.d_k>m_adverse_up)
     {
      o.reason=StringFormat("adverse: short above median, D_k=%.2f",b.d_k);
      return true;
     }
This is the one exit that ignores the minimum-profit setting entirely, because it is not trying to book a target: it is trying to stop feeding a trend that has already turned against the trade. When it fires on a loss, it also blocks re-entry on that same side until the fractile crosses back over the median, so the strategy cannot immediately hand the market the same losing trade again.
A CLOSE_REVERSE action closes the current leg and immediately opens the opposite one, flipping directly from a short to a long or the reverse. Together, the four legs and the adaptive exit answer every way a traversal can play out: complete it, reverse into the opposite trade, or turn back and ride the revert.

Fig. 6. The four legs on one distribution: reverse legs ride a full traversal from one extreme toward the other, revert legs are taken when a traversal turns back before reaching the far extreme
The Expert Advisor
The Expert Advisor, RMA.mq5, is the thin layer that turns the engine's numbers into orders. It does not recompute anything: it loads RMA_Engine through iCustom, reads the published buffers on each closed bar into a single bar structure, and hands that structure to the signal engine, which answers with an instruction. The Expert Advisor then acts on the instruction through TradeManager.mqh, which owns all order placement and bookkeeping.
The iCustom call couples the layers by position rather than by name. An input group divider occupies a real slot in the parameter list even though it is only a visual heading, so the Expert Advisor passes an empty string at each group position to keep every value lined up with the input it feeds:
   g_engine=iCustom(_Symbol,_Period,"RMA\\RMA_Engine",
                    "",                       // group: Window
                    InpWindowSize,InpSmoothingPeriod,
                    "",                       // group: Regime detection
                    InpEpsilonLow,InpEpsilonHigh,InpSlopeThreshold,
                    InpRegimeLookback,InpVariationRatioLow,InpZScoreExpansion,
                    InpRangeHistoryLookback,
                    "",                       // group: Adverse movement
                    InpAdverseLookback,
                    "",                       // group: Reference lines
                    InpEntryUpperThreshold,InpEntryLowerThreshold,
                    "",                       // group: Panels
                    InpShowPanels,InpPanelAdverse,InpPanelRmaValues,
                    InpAdverseThresholdDown,InpAdverseThresholdUp,
                    "",                       // group: Regime backdrop
                    InpShowRegimeBand);

   if(g_engine==INVALID_HANDLE)
     {
      Print("[RMA] RMA_Engine would not load - compile Indicators\\RMA\\RMA_Engine.mq5");
The list stops at InpShowRegimeBand on purpose: the engine's remaining inputs are the regime backdrop colours, display-only values the Expert Advisor never reads, and an omitted trailing iCustom argument simply takes the indicator's own default.
On each closed bar the Expert Advisor frames its decision by whether the account is flat or in a position: a flat account is offered an entry, an open one an exit and, if the exit reverses, a reversal into the opposite leg. That whole orchestration is OnTick, and the order of its steps is the design:
//+------------------------------------------------------------------+
//| Expert tick.                                                     |
//|  Two clocks run here. A refused close is retried on every tick,  |
//|  because the thing being waited for is the market opening and    |
//|  that does not happen on a bar boundary. Everything else waits   |
//|  for a bar to close, because every number it reads is only       |
//|  final then.                                                     |
//+------------------------------------------------------------------+
void OnTick(void)
  {
   g_trades.RetryPendingClose();
   AfterClose();

   datetime bar_time=iTime(_Symbol,_Period,0);
   if(bar_time==g_last_bar || bar_time==0)
      return;
   g_last_bar=bar_time;

   if(!g_engine_shown)
     {
      g_engine_shown=true;
      ShowEngine();
     }

   g_trades.Sync();
   AfterClose();

   if(g_trades.AtSessionEnd() && g_trades.IsOpen())
     {
      g_trades.Close("session end");
      AfterClose();
     }

   if(!g_trades.SessionAllows())
      return;

   SRmaBar bar;
   if(!ReadBar(bar))
      return;

   g_signals.OnBar(bar);

//--- whether the account was open is settled before anything acts on
//--- it, so that a close and an entry cannot both land on one bar.
   bool was_open=g_trades.IsOpen();
   if(was_open)
      HandleOpen(bar);
   if(!was_open)
      HandleFlat(bar);

   g_display.Update(bar,g_signals,g_trades,g_note);
The order is intentional. The pending close is retried first, on every tick, so a close the broker refused is not left hanging while a new decision is made. The new-bar gate then makes the strategy decide only once per closed bar. Session end is checked before the session window, so an open position is flattened at the close even on a bar the strategy would otherwise sit out. Finally, capturing the open-or-flat state into was_open before either handler runs guarantees a bar is either an exit bar or an entry bar, never both.
Order placement and risk. Everything that touches an order lives in TradeManager.mqh, kept apart from the rules so that the signal engine can be reasoned about, and tested, without a broker anywhere in sight. The trade manager owns the position bookkeeping, the fixed stop-loss and optional take-profit, and the session controls. The session logic is deliberately written to handle a trading window that runs through midnight, the usual case when the window is anchored to a non-local exchange rather than to the broker's clock:
//+------------------------------------------------------------------+
//| Is the clock inside the trading window?                          |
//|  A start hour later than the end hour describes a session that   |
//|  runs through midnight, which is the usual case for anything     |
//|  anchored to a non-local exchange.                               |
//+------------------------------------------------------------------+
bool CTradeManager::SessionAllows(void) const
  {
   if(!m_use_hours)
      return true;

   MqlDateTime dt;
   TimeCurrent(dt);
   if(m_start_hour<m_end_hour)
      return (dt.hour>=m_start_hour && dt.hour<m_end_hour);
   return (dt.hour>=m_start_hour || dt.hour<m_end_hour);
  }
A companion check flattens any open position at the configured end-of-session hour. These are deployment-level controls, not part of the RMA framework: the paper is concerned with the signal and leaves the operator to wrap it in whatever risk envelope suits their account and instrument.
Opening a position. The Open method is where an instruction becomes an order, and it does the unglamorous work that separates a toy from something you can run: it clamps the lot size to the symbol's min, max, and step, places the stop and target at pip distances from the current quote, and records the trade against the price it actually got rather than the price it asked for:
//+------------------------------------------------------------------+
//| Open a position and adopt it.                                    |
//+------------------------------------------------------------------+
bool CTradeManager::Open(const ENUM_ORDER_TYPE type,const string reason)
  {
   if(m_open)
     {
      Print("[RMA] open refused: a position is already running");
      return false;
     }

   int    digits=(int)SymbolInfoInteger(_Symbol,SYMBOL_DIGITS);
   double min_lot=SymbolInfoDouble(_Symbol,SYMBOL_VOLUME_MIN);
   double max_lot=SymbolInfoDouble(_Symbol,SYMBOL_VOLUME_MAX);
   double step   =SymbolInfoDouble(_Symbol,SYMBOL_VOLUME_STEP);

   double lots=MathMin(MathMax(m_lots,min_lot),max_lot);
   if(step>0.0)
      lots=MathFloor(lots/step)*step;
   lots=NormalizeDouble(lots,2);

   bool   buy=(type==ORDER_TYPE_BUY);
   double price=buy?SymbolInfoDouble(_Symbol,SYMBOL_ASK):SymbolInfoDouble(_Symbol,SYMBOL_BID);
   double sl=0.0;
   double tp=0.0;

   if(m_sl_pips>0.0)
     {
      double away=m_sl_pips*m_pip;
      sl=NormalizeDouble(buy?(price-away):(price+away),digits);
     }
   if(m_tp_pips>0.0)
     {
      double away=m_tp_pips*m_pip;
      tp=NormalizeDouble(buy?(price+away):(price-away),digits);
     }

   bool sent=buy?m_trade.Buy(lots,_Symbol,price,sl,tp,m_comment)
             :m_trade.Sell(lots,_Symbol,price,sl,tp,m_comment);

   if(!sent)
     {
      PrintFormat("[RMA] open failed: %d - %s",
                  m_trade.ResultRetcode(),m_trade.ResultRetcodeDescription());
      return false;
     }

//--- the requested price is what the order asked for; the result
//--- price is what it got, and a trade recorded against the request
//--- would carry the slippage into every pip figure that follows.
   double filled=m_trade.ResultPrice();
   m_open        =true;
   m_type        =buy?0:1;
   m_entry_price =(filled>0.0)?filled:price;
   m_entry_time  =TimeCurrent();

   PrintFormat("[RMA] opened %s at %s | %.2f lots | %s",
               buy?"long":"short",DoubleToString(m_entry_price,digits),lots,reason);
   return true;
  }
Recording m_entry_price from the fill rather than the request matters more than it looks: booking against the requested price would fold every tick of slippage into the pip figures that feed the exit rules and the optimisation score. Recording the fill keeps the accounting honest.
When the close is refused. A close-and-reverse asks the broker to flatten a position at the moment the opposite trade is due, and the broker does not always oblige on the first attempt (a closed market, a requote, a momentary rejection). Rather than drop the exit, the trade manager latches it and retries on every tick until it fills:
//+------------------------------------------------------------------+
//| Try again, on every tick, until the market takes the close.      |
//|  Quietly: a market that is shut will refuse thousands of times   |
//|  before it opens, and a journal full of that is a journal nobody |
//|  reads. One line every ten attempts is enough to show it is      |
//|  still trying.                                                   |
//+------------------------------------------------------------------+
void CTradeManager::RetryPendingClose(void)
  {
   if(!m_pending)
      return;
   if(!m_open)
     {
      m_pending=false;
      return;
     }

   ulong ticket=FindTicket();
   if(ticket==0)
      return;

   double quote=(m_type==0)?SymbolInfoDouble(_Symbol,SYMBOL_BID)
                :SymbolInfoDouble(_Symbol,SYMBOL_ASK);

   if(!m_trade.PositionClose(ticket))
     {
      m_pending_tries++;
      if((m_pending_tries%10)==0)
         PrintFormat("[RMA] still trying to close (%d attempts) | %s",
                     m_pending_tries,m_pending_reason);
      return;
     }

   double filled=m_trade.ResultPrice();
   RecordClose((filled>0.0)?filled:quote,m_pending_reason,m_pending_tries);
  }
When the close finally goes through, the trade is booked with the number of retries it took, so the record shows what happened without the operator having to reconstruct it.
Results
The Expert Advisor was run in the Strategy Tester on EURUSD, H2, over roughly fourteen months of history on real ticks. Before reading any number, one caveat has to be stated plainly, and it comes from the paper itself: its Results section is, in the version in hand, left as future work. The paper offers a framework and its mechanics, not an empirical track record. Any performance figure here is therefore ours, a starting point for the reader's own testing, not a validated edge inherited from the source.
With that said, the completed system trades. The headline figures from the run were:
| Metric | Value |
|---|---|
| Total net profit | 362.51 (on a 10,000 deposit) |
| Total trades | 138 |
| Profit factor | 1.15 |
| Sharpe ratio | 0.82 |
| Maximal equity drawdown | 4.52% |
| Profit trades | 46.38% |
| Long / short win rate | 46.58% / 46.15% |
The win rate sits just under half, and the system stays profitable because its average win is larger than its average loss, the payoff profile typical of a mean-reversion strategy that lets its reversals run. Longs and shorts perform almost identically, as expected from a symmetric framework.
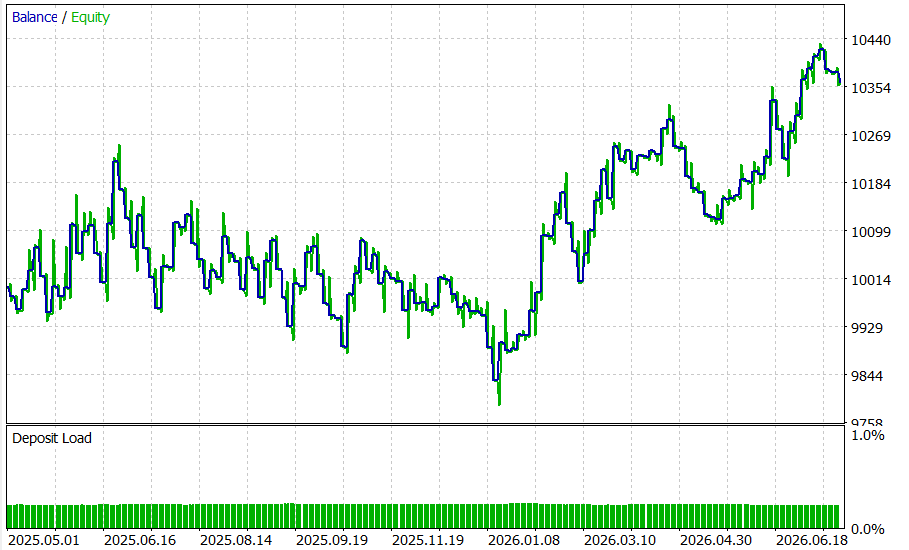
Fig. 7. The equity curve over the test period: steady participation with shallow drawdowns rather than a single lucky run
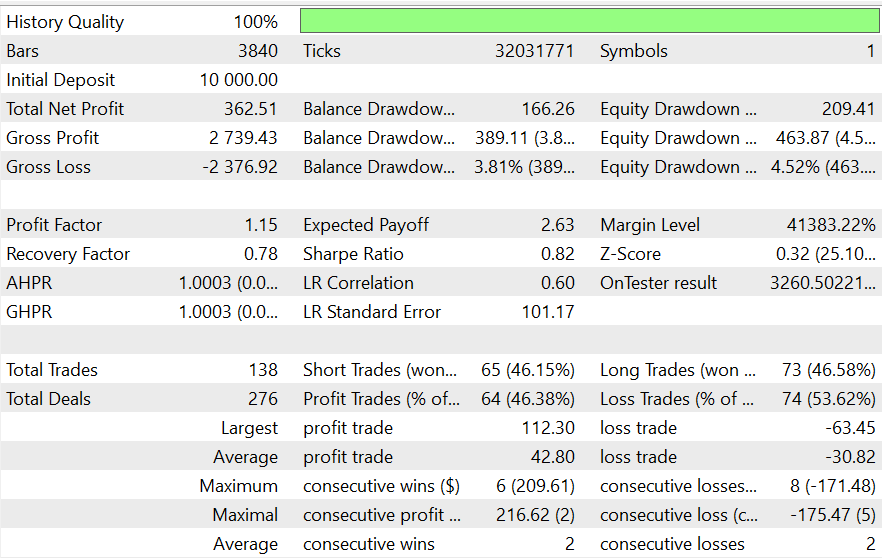
Fig. 8. The full Strategy Tester report for the run, showing the settings, the trade statistics, and the balance and equity curves
Conclusion
We set out to port Bloch's RMA framework, faithfully, into a working MetaTrader 5 system. The result is a three-layer implementation:
- An engine that computes the SMA, the RMA family, and the fractiles, with the fractile taken directly from the paper's appendix definition, the empirical cumulative distribution of the window.
- A regime detector that classifies expansion, contraction, and transition from the Relative Extremum Ratios, giving the strategy the context that selects its exit rule.
- An Expert Advisor that implements all four cross-strategies, the reverse legs and the revert legs, driven by the paper's Adaptive Crossover Exit.
The value of the RMA is not that it predicts but that it describes: on a scale that means the same thing everywhere, it says where price sits inside its own recent structure and what that structure is doing. That is a different primitive to build on than a smoothed average, and a foundation for the reader's own experiments, testing other instruments and timeframes or calibrating the window per asset as the paper intends.
Getting the Source Code via MQL5 Algo Forge
All source files are attached to this article below, but the full repository is also available on MQL5 Algo Forge, the community's Git-based platform for sharing and collaborating on trading projects.
| File name | Description |
|---|---|
| MQL5\Include\RMA\RmaTypes.mqh | Shared enums, the per-bar structure, and buffer index definitions for the RMA system |
| MQL5\Include\RMA\RmaCore.mqh | The numerical core: SMA, the RMA family, normalised returns, and the fractile function |
| MQL5\Include\RMA\RegimeDetector.mqh | Expansion, contraction, and transition classification from the Relative Extremum Ratios |
| MQL5\Include\RMA\AdverseMonitor.mqh | Directional-consistency measure of the fractile's position relative to the median |
| MQL5\Include\RMA\SignalEngine.mqh | The four cross-strategies: reverse and revert entries, exits, and the adaptive crossover switch |
| MQL5\Include\RMA\TradeManager.mqh | Order placement, position bookkeeping, and the session and risk controls |
| MQL5\Include\RMA\RmaDisplay.mqh | On-chart status panel rendering the live RMA state |
| MQL5\Indicators\RMA\RMA_Engine.mq5 | The indicator that runs the core and publishes every RMA series as a buffer |
| MQL5\Indicators\RMA\RMA_Panel.mq5 | Passthrough sub-window panel that borrows a second axis to plot the engine's buffers |
| MQL5\Experts\RMA\RMA.mq5 | The Expert Advisor: loads the engine, reads its buffers, and trades the four strategies |
Warning: All rights to these materials are reserved by MetaQuotes Ltd. Copying or reprinting of these materials in whole or in part is prohibited.
This article was written by a user of the site and reflects their personal views. MetaQuotes Ltd is not responsible for the accuracy of the information presented, nor for any consequences resulting from the use of the solutions, strategies or recommendations described.

 Learnable Curves, Not Weights: A Kolmogorov-Arnold Network from Scratch
 Trends and Traditions: Using Rademacher Functions in Trading
 Trading Options Without Options (Part 4): More Complex Option Strategies
 Neural Networks in Trading: Adaptive Periodic Segmentation (LightGTS)

- Free trading apps
- Over 8,000 signals for copying
- Economic news for exploring financial markets
You agree to website policy and terms of use