Order Block Finder
- 指标
- 版本: 3.8
- 更新: 17 三月 2026

Multiple indicators in one:
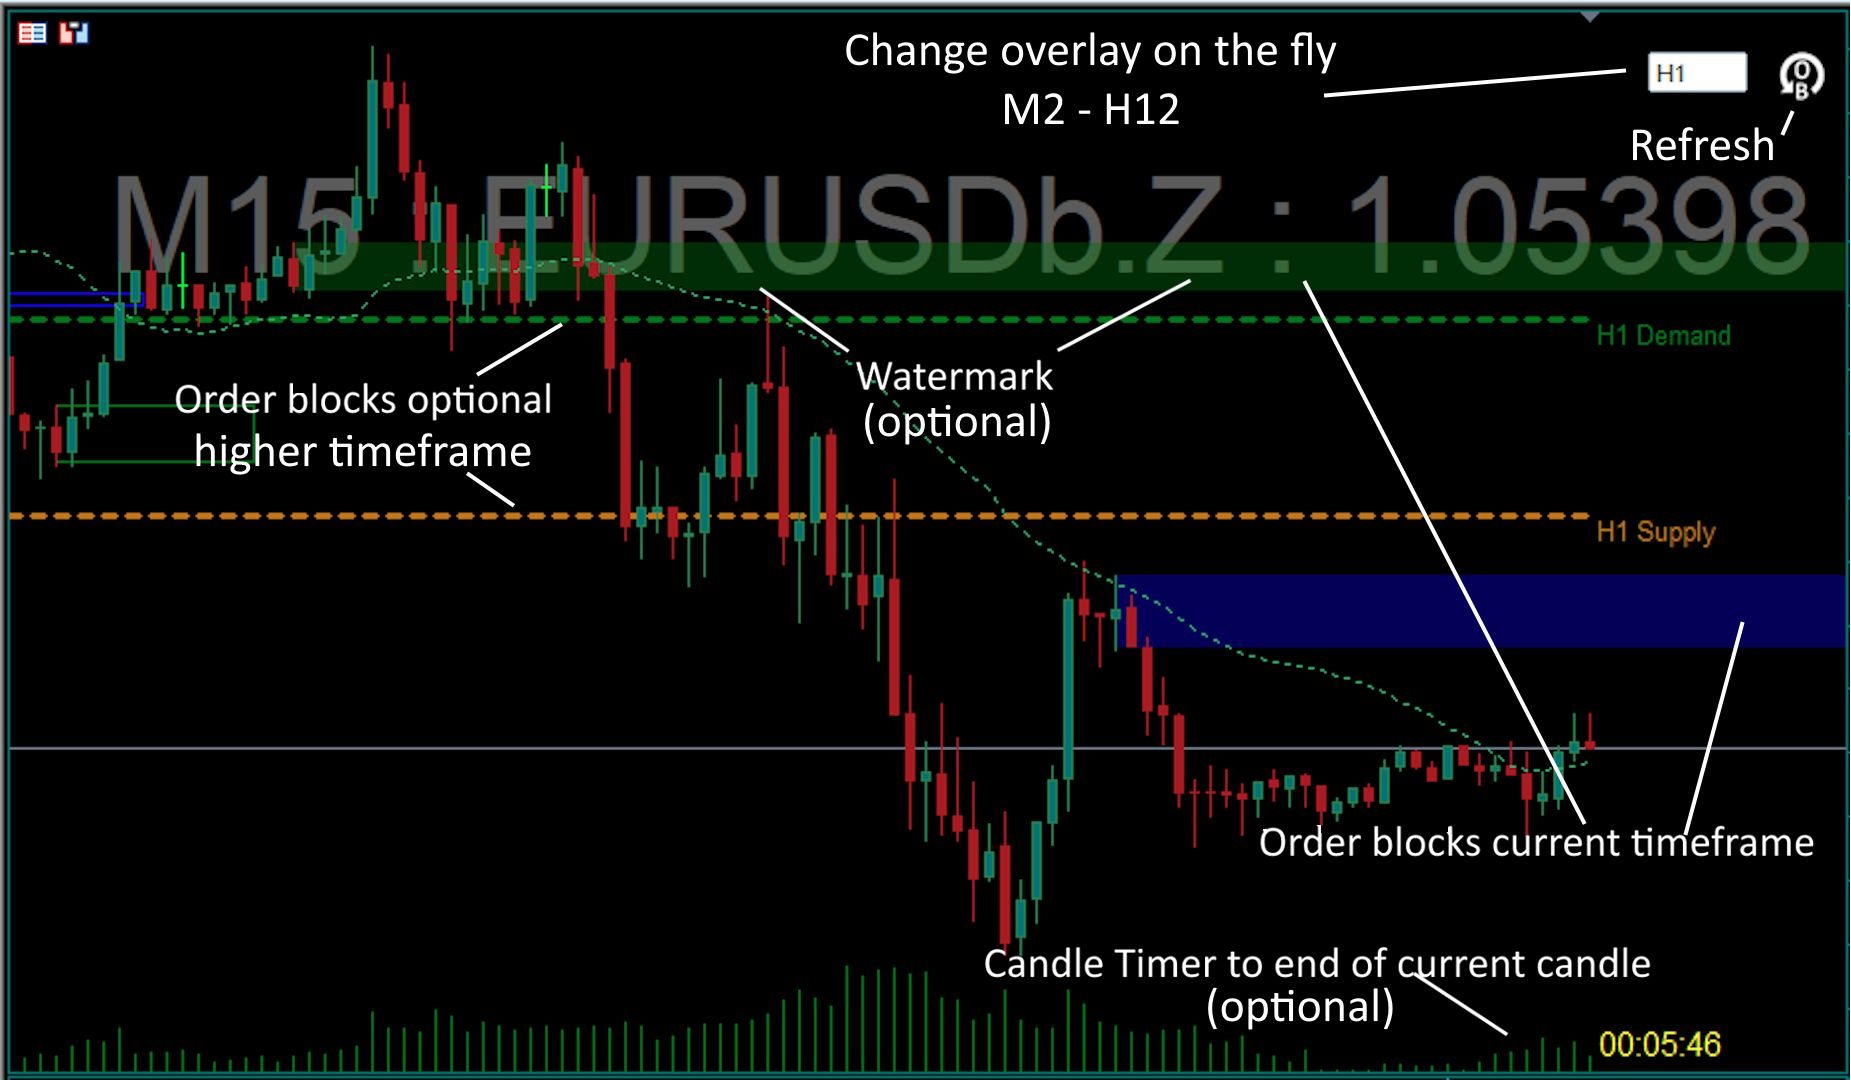
- Order Blocks with optional higher timeframe overlay
- Watermark
- Count down timer
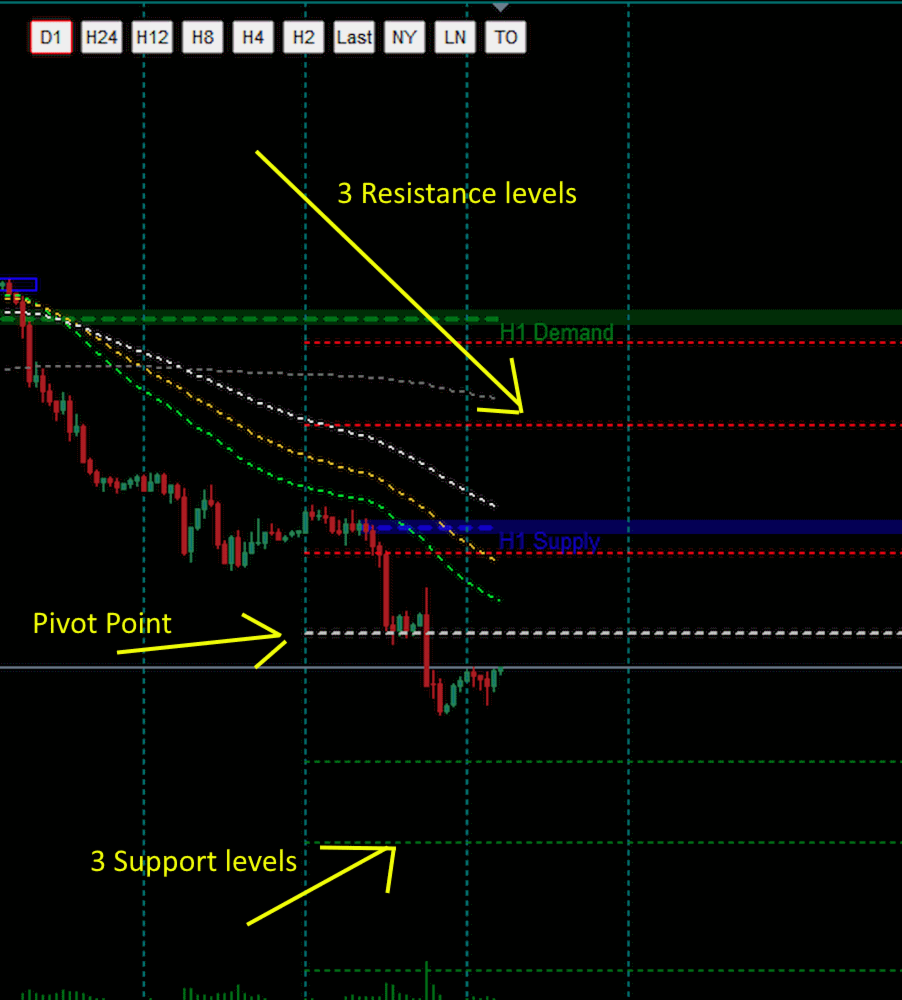
- Pivot points
No fancy algorithms but tends to be quite accurate for some symbols to predict bounce, return-to and break-through channels.
It is a retrospective indicator (as they all are) and there to help you with better guesses as to where a movement is going towards.
The last two order blocks are shaded and extends past the current time. Prior order blocks (within your selected timeframe - default 5 days back) just marked as empty rectangles as they may be less important in analysis.
Overlay higher timeframe order blocks will only show last Bullish and last Bearish blocks with a dashed line centred in the initiating move.
Rather look in different timeframes than try going far back in one.
Basic Settings
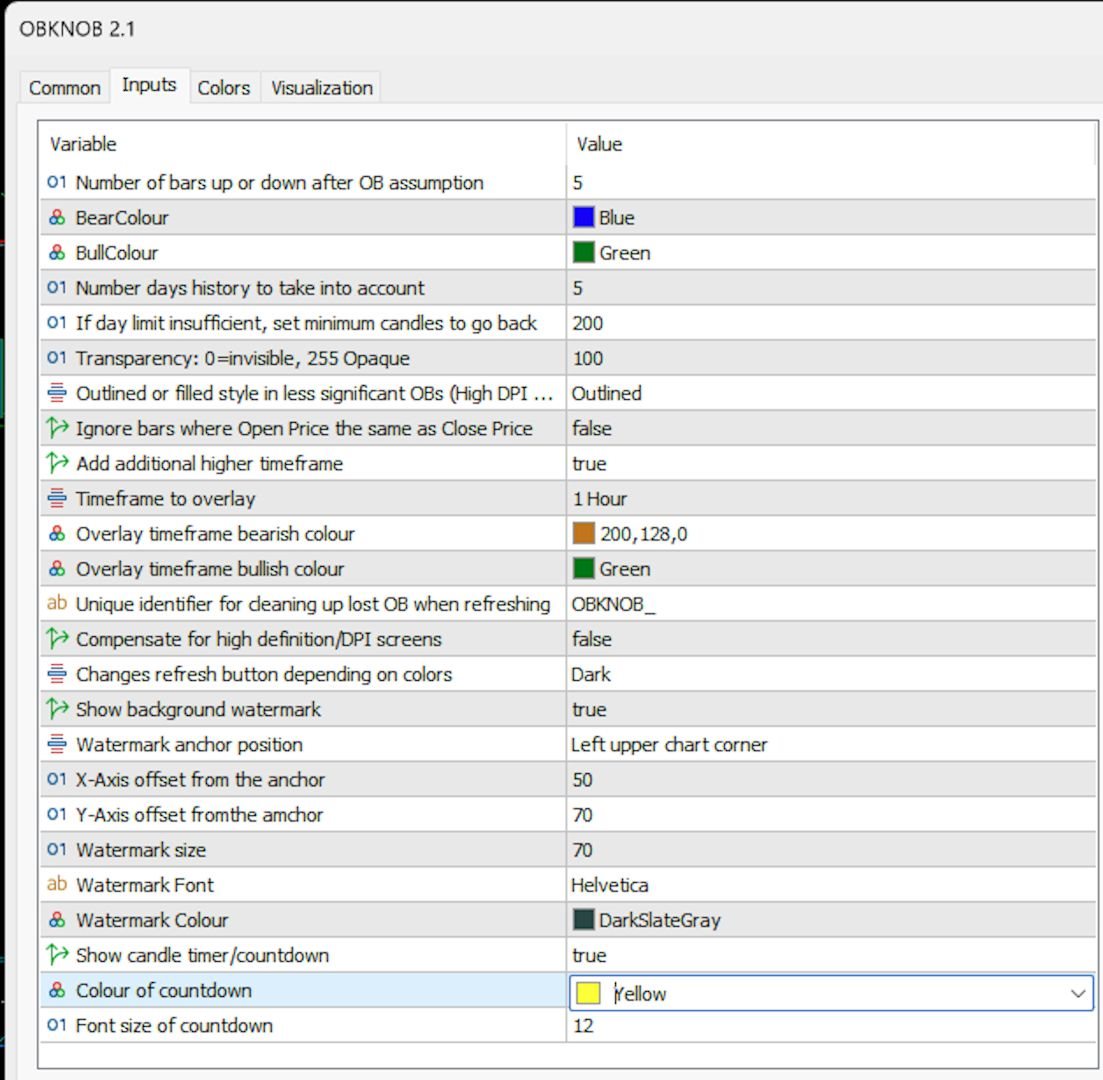
Number of bars up or down after OB assumption - default of 5 works best
BearColour- Bearish order block colour
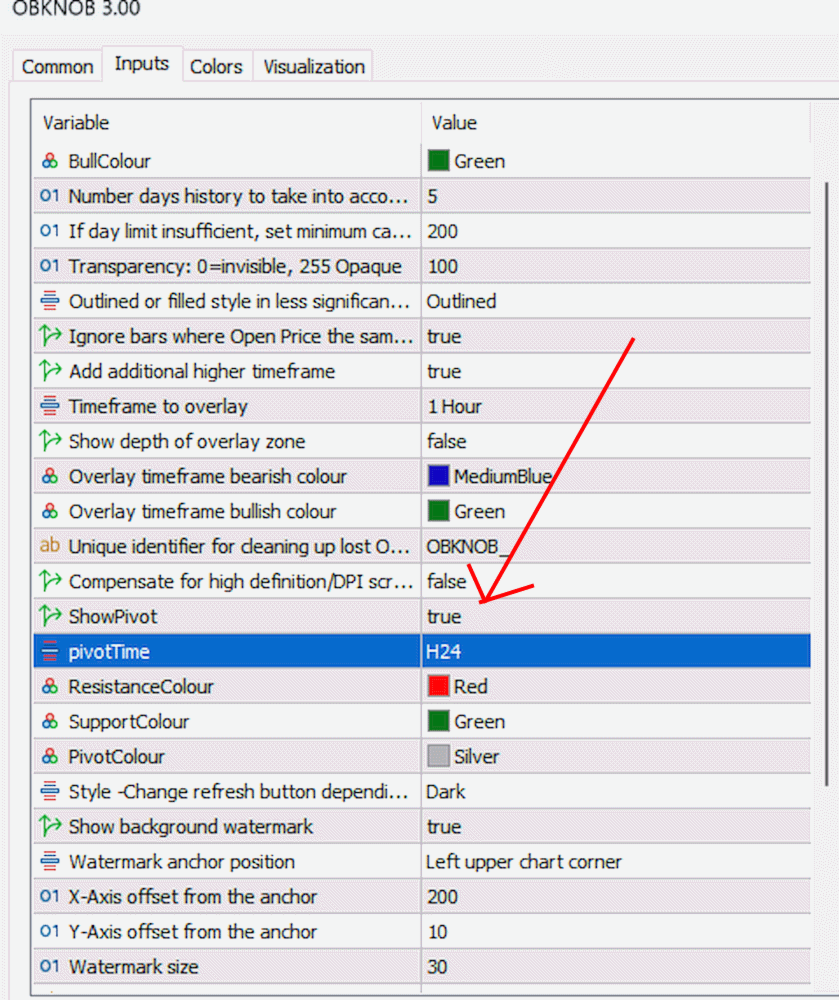
BullColour- Bullish order block colour
Number days history to take into account- Default of 5 works fine for lower timeframes
If day limit insufficient, set minimum candles to go back - Switching to a higher timeframe can the override day value with this one
Transparency: 0=invisible, 255 Opaque- Make the shaded order block less obvious
Outlined or filled style in less significant OBs (High DPI screens outlines get lost))
Ignore bars where Open Price the same as Close Price
Overlay
Add additional higher timeframe
Timeframe to overlay
Show depth of overlay zone - Extends vertical bar to show OB zone. Click on overlay text (Supply/Demand) to switch it on or off
Overlay timeframe bearish colour
Overlay timeframe bullish colour
Utility
Unique identifier for cleaning up lost OB when refreshing
Compensate for high definition/DPI screens
Style - Changes refresh button depending on colours
Watermark
Show background watermark
Watermark anchor position
X-Axis offset from the anchor
Y-Axis offset from the amchor
Watermark size
Watermark Font
Watermark Colour
Countdown
Show candle timer/countdown
Colour of countdown
Font size of countdown
Pivot
Pivot, resistance and support line colours
Default timeframe
D1=Last trading dayH24=Past 24 hours
H12-H2=Past n number of hours
Last=based on last completed trading session (Tokyo, London or New York)
NY=based on last completed New York Session
LN=based on last completed New London Session
NY=based on last completed New Tokyo Session


This is the best ORDER BLOCK INDICATOR I KNOW....your last recent update on the Order Block Finder made it impossible to use the indicator with order analysis tool like trend line or fibonacci, the moment you change the time frame they all disappear PLEASE CHECK AND FIX THIS IT WILL BE HIGHLY APPRECIATED The previous version before version 3.7 that was updated 2026.02.02 work PERFECTLY pls i don't mind a copy of that I have sent you multiple PRIVATE MESSAGES WITH NO REPLY