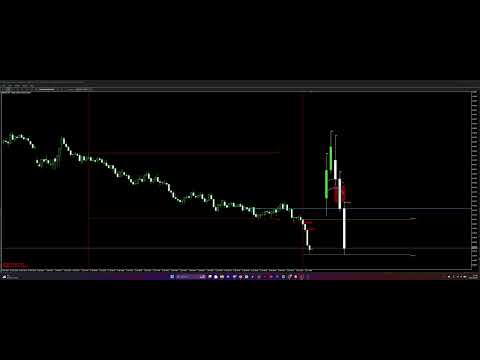
HTF PO3 3 with FVG and Open Price Line
- 指标
- 版本: 2.95
- 更新: 26 七月 2026

My other indicators:
https://www.mql5.com/en/market/product/156702 (FREE)
https://www.mql5.com/en/market/product/153968 (FREE)
https://www.mql5.com/en/market/product/153960 (FREE)
This indicator displays higher timeframe candles directly on your lower timeframe chart, allowing you to monitor higher timeframe price action without switching between charts. It also plots session highs and lows for the Asia, London, and New York kill zones, giving you key liquidity levels directly on your chart.
What This Indicator Does: The indicator places up to 6 candles from a selected higher timeframe (such as H4, Daily, or Weekly) onto your current chart. It also identifies and marks the high and low of each trading session, helping you track where liquidity sits and where price has been active during each session.
Sessions are set in GMT and automatically aligned to your broker's server time, so the zones land on the correct hours no matter which broker you use — no manual offset required. Default session windows (GMT): Asia 00:00–07:59, London 08:00–11:59, New York 12:00–21:00.
Features:
- Displays 1 to 6 higher timeframe candles on your chart, from any selected higher timeframe
- Session highs and lows for Asia, London, and New York — each independently toggleable
- Session times are set in GMT and automatically shifted to your broker's server time — no manual offset needed, and it self-corrects across broker daylight-saving changes
- Session start vertical lines with customisable colour and style
- Configurable to show up to 5 trading days back, weekends automatically skipped
- Detects Fair Value Gaps on both the current timeframe and the higher timeframe overlay
- Draws a horizontal line at the higher timeframe opening price
- Identifies liquidity grabs and failed breaks with optional alerts
- Dual EMA system (25 and 50 period) plotted across the higher timeframe overlay for trend direction
- EMA trend alignment filter — long alerts only fire when the 25 EMA is above the 50 EMA, short alerts only when below
- Dual countdown timers showing bar close countdowns for both the current timeframe and the higher timeframe
- Full customisation of colours, line styles, candle width, positioning, and alert preferences
Intended Use: Designed for traders who incorporate higher timeframe analysis and session structure into their decisions. Provides a visual reference for higher timeframe candle structure, Fair Value Gaps, opening prices, EMA trend direction, and session high/low levels — all without leaving your current chart.