KT Heiken Ashi Smoothed MT5
- 指标
- 版本: 1.5
- 更新: 11 五月 2022
- 激活: 10

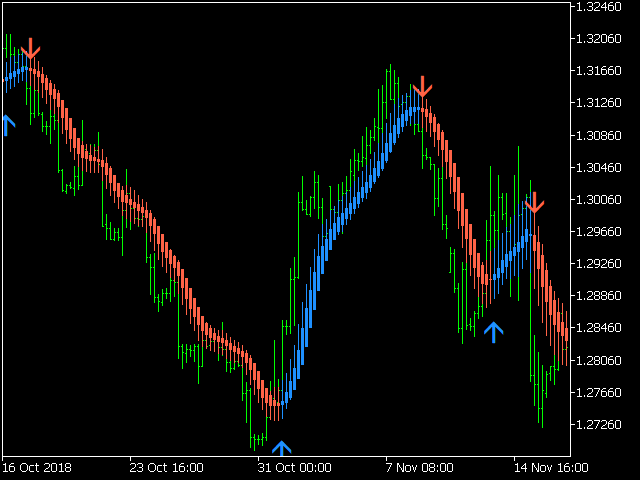
KT Heiken Ashi Smoothed 是标准 Heiken Ashi 的平滑版本,同时在趋势反转处绘制买卖箭头,方便即时捕捉信号。凭借这种直观而即时的可视化,交易者能在快节奏的市场中快速做出判断。
- 当状态由空头转为多头时绘制买入箭头。
- 当状态由多头转为空头时绘制卖出箭头。
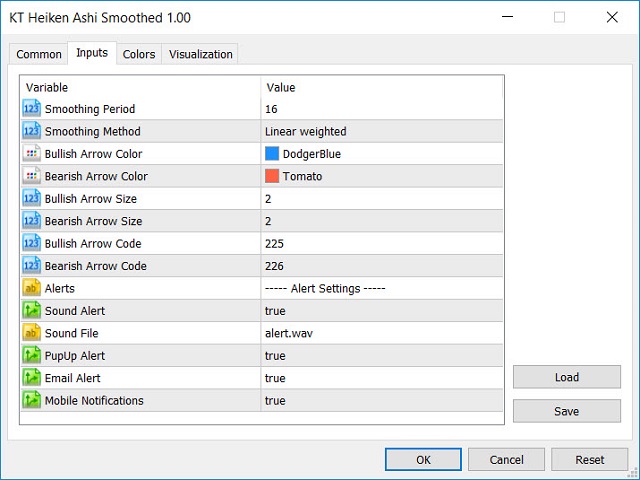
- 支持手机推送、邮件、声音与弹窗等多通道提醒,确保第一时间获知变动。
Heiken Ashi Smoothed 究竟是什么?
它通过双移动平均对标准 Heiken Ashi 进行二次平滑,过滤虚假信号与噪声。尽管会带来些许滞后,但能清晰揭示摆动点与新兴趋势,让原本肉眼难以分辨的价格动态变得一目了然。利用这些信息,交易者可相应地优化进出场、调整仓位、完善风控,以在外汇、商品乃至指数市场中把握先机。
应用场景
该指标适用于外汇、商品和股票等多种市场。以下五种核心用法可以帮助寻找交易机会和确认行情:
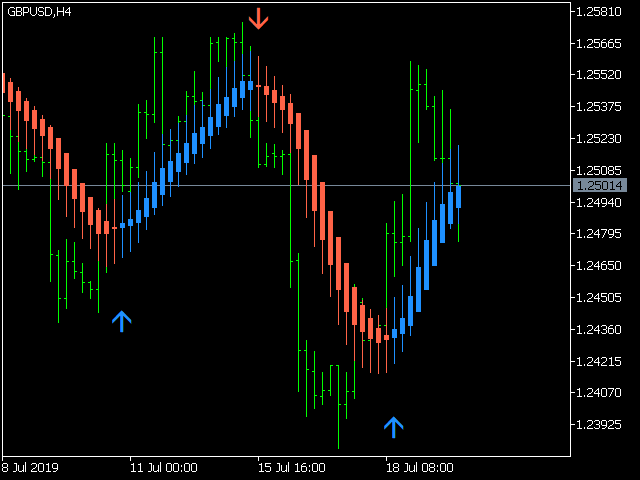
- 纯蓝色蜡烛且无下影线:显示强劲上升趋势。
- 纯红色蜡烛且无上影线:显示强劲下降趋势。
- 趋势拐点常伴随实体极小、上下影线较长的蜡烛,可视为转势信号。


用户没有留下任何评级信息