KT Heiken Ashi Smoothed MT5
- Indicatori
-
KEENBASE SOFTWARE SOLUTIONS
 Keenbase Trading sviluppa indicatori professionali ed Expert Advisor per MetaTrader 4 e MetaTrader 5, progettati per aiutare i trader a prendere decisioni di trading più consapevoli.
 - Versione: 1.5
- Aggiornato: 11 maggio 2022
- Attivazioni: 10
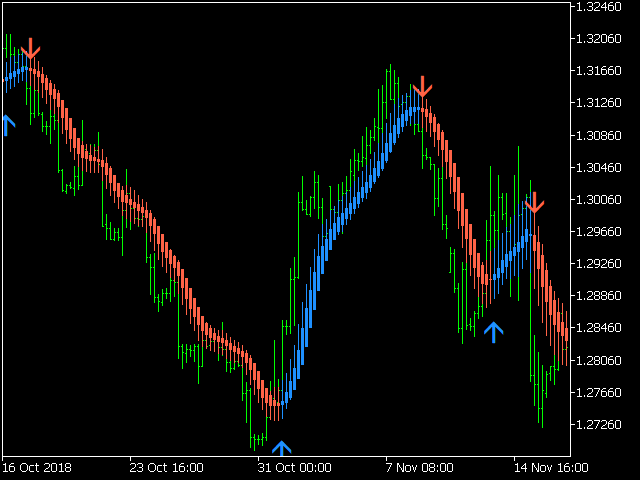
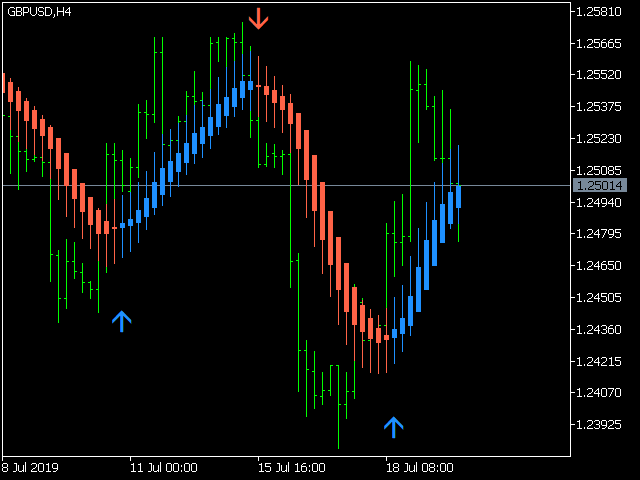
KT Heiken Ashi Smoothed è una versione smussata dello Heiken Ashi standard e disegna frecce di acquisto/vendita quando la tendenza cambia.
- Viene tracciata una freccia di acquisto quando si passa da stato ribassista a rialzista.
- Viene tracciata una freccia di vendita quando si passa da rialzista a ribassista.
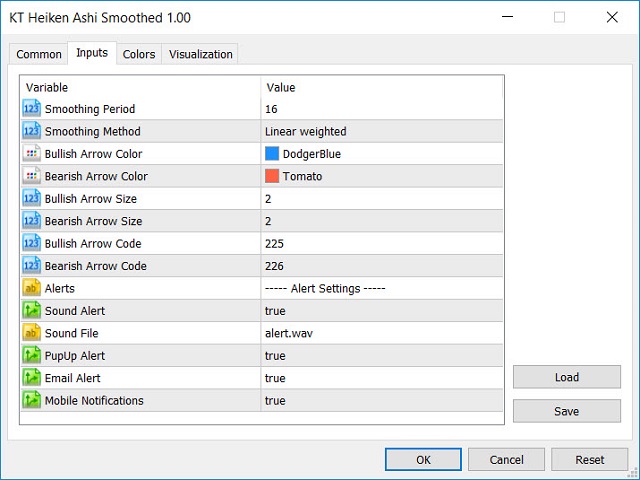
- Notifiche mobile, email, audio e pop-up incluse.
Cosa è esattamente Heiken Ashi Smoothed?
Filtra i falsi segnali e il rumore del Heiken Ashi standard applicando due medie mobili per rendere il prezzo più fluido. Pur introducendo un lieve ritardo, aiuta a individuare swing point e nuove tendenze, mostrando dinamiche di prezzo altrimenti invisibili. I trader possono così adattare le proprie strategie.
Applicazioni
L’indicatore si adatta a Forex, materie prime e azioni. Di seguito cinque utilizzi principali per scovare opportunità.
- Candele blu senza ombra inferiore indicano un forte trend rialzista.
- Candele rosse senza ombra superiore indicano un forte trend ribassista.
- Il cambio di trend spesso compare con una candela dal corpo piccolo e ombre lunghe.


L'utente non ha lasciato alcun commento sulla valutazione.