KT Auto Fibo
- 指标
- 版本: 1.1
- 更新: 25 三月 2022

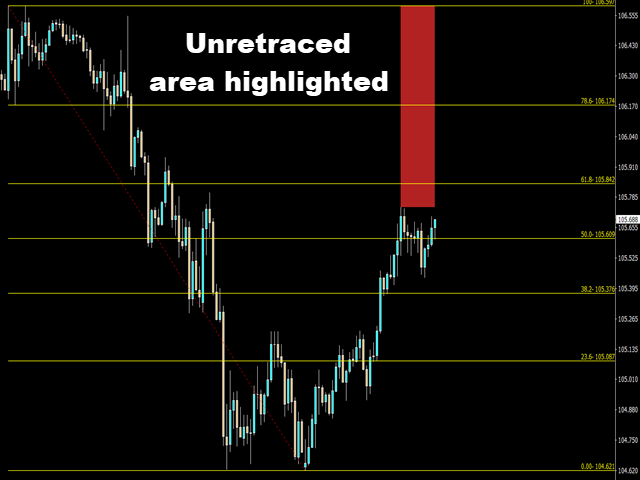
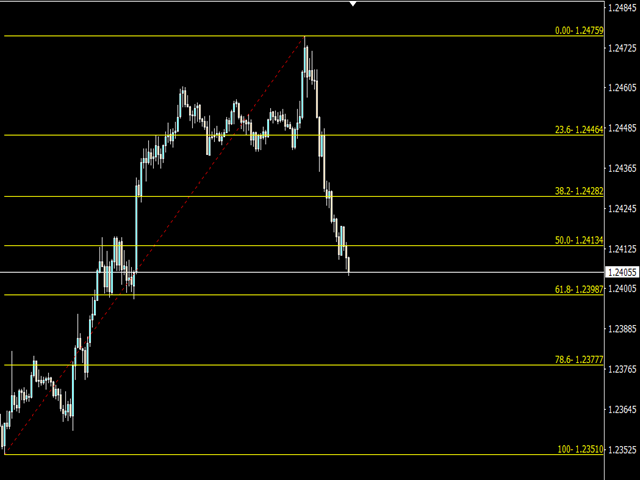
KT Auto Fibo根据当前的趋势方向自动绘制斐波那契回撤水平。最高点和最低点是根据图表上可用的最大值和最小值自动选择的。您可以通过缩放和滚动图表来相应地调整斐波那契水平。
模式
- 自动: 根据图表区域自动绘制斐波那契水平。
- 手动: 仅绘制一次斐波那契水平,之后您可以手动调整锚点。
使用方法:
- 帮助您合理预测未来的获利目标。
- 结合支撑/阻力位或趋势线使用时,具有较强的反转可能性。
- 在趋势市场中提供低风险的入场机会。
输入参数
- 自动: 无需人为干预即可绘制斐波那契回撤水平。
- 手动: 仅绘制一次斐波那契回撤水平,之后可以手动拉伸锚点。
- 显示未回撤区域: 在图表上显示或隐藏尚未被价格回撤触及的区域。
- 其余输入项为直观设置,无需额外解释。