Netsrac ADR Dashboard

4.92
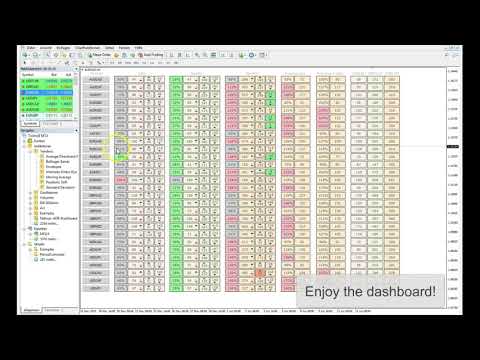
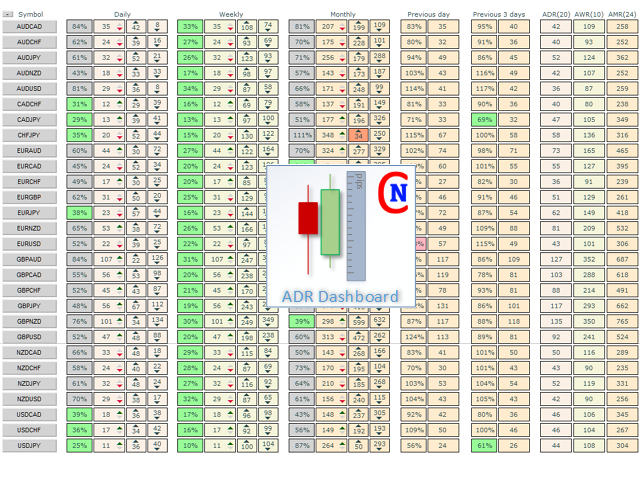
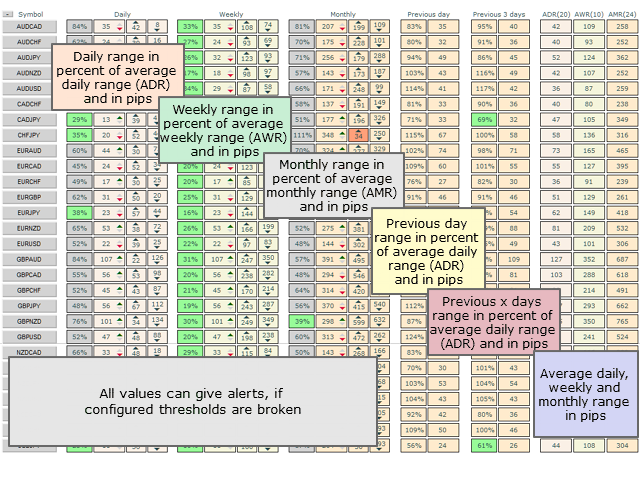
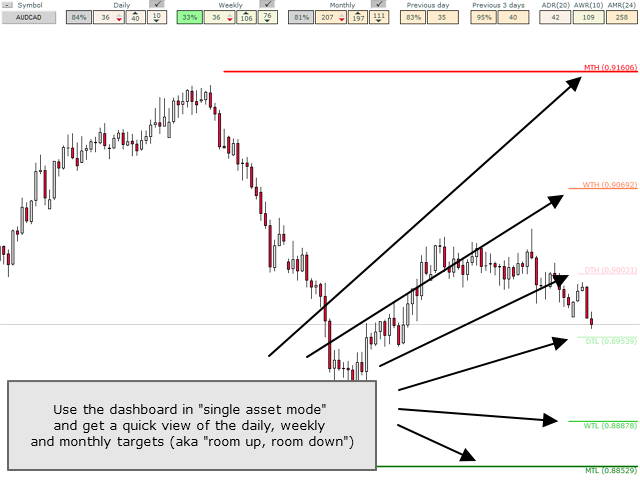
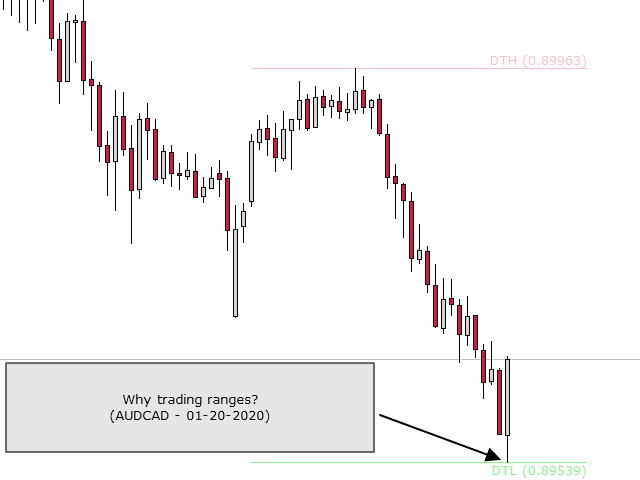
仪表盘的意图是提供配置资产的日、周、月范围的快速概览。在 "单一资产模式 "下,仪表板会在图表中直接显示可能的反转点,从而使统计数据可以直接交易。如果超过了配置的阈值,仪表盘可以发送屏幕警报,通知(到手机MT4)或电子邮件。

使用这些信息的方式有多种。一种方法是,已经完成近100%日均运动的资产显示出逆转的趋势。另一种方法是观察资产,它的波动率与平均水平相比非常低。现在的挑战是如何从这个低波动性中交易突破。

这只是两种可能的策略,对于这些策略,仪表盘可以成为一个重要的辅助工具。发现各种可能性!

关于控件的完整描述,请观看我的博客文章(https://www.mql5.com/en/blogs/post/732999)。

注意:这个指标不能在策略测试器中使用。所以这里来自市场的演示版本不能使用。请使用该指标的免费版本进行测试:https://www.mql5.com/de/market/product/33913

这是ADR-Dashboard的MT4版本。如果你想在MT5上使用,请到https://www.mql5.com/en/market/product/52708
评分 14
En Shahdi
294
En Shahdi 2025.10.07 15:18 
 

Netsrac ADR Dashboard by Carsten Pflug is truly one of the best indicators I’ve ever used. It’s extremely helpful for reading market range, identifying continuation or exhaustion zones, and aligns perfectly with my own trading system. Carsten Pflug is an outstanding developer — very fast to respond, professional, and always willing to share useful tips whenever I ask questions. Thank you so much for this powerful indicator — it has really helped me make clearer and more confident trading decisions every single day!

MP_mpap
633
MP_mpap 2025.06.29 19:52 
 

The most complete dashboard available. Anyone working with ADR will be 100% satisfied! Highly recommended!

lauro1956
5752
lauro1956 2022.01.06 12:41 
 

Very good board mr Pflug ... complete and clear

推荐产品
Buy Sell Magic
Sergey Bocharov
Trend reversal indicator, no repainting. Clean and light rendering There is no alternative buy-sell signal without taking into account the trend. Noise filtering capability. Works with all pairs. Ideal for beginners and experienced traders It is best used on timeframes above the M30, from the beginning of the London session to America. It should be remembered that there are no indicators that are not wrong. Any strategy requires confirmation of its signals. When building your own system, it i
Dynamic Forex28 Navigator
Bernhard Schweigert
4.43 (7)
Dynamic Forex28 Navigator - 下一代外汇交易工具。 当前 49% 折扣。 Dynamic Forex28 Navigator 是我们长期流行的指标的演变,将三种功能合二为一: 高级货币强度 28 指标 (695 条评论)+ 高级货币 IMPULSE 带警报 (520 条评论)+ CS28 组合信号(奖励)。 有关指标的详细信息 https://www.mql5.com/en/blogs/post/758844 下一代强度指标提供什么? 您喜欢的原始指标的一切,现在通过新功能和更高的精度进行了增强。 主要特点: 专有货币强度公式。  所有时间范围内的平滑和准确的强度线。 非常适合识别趋势和精确进入。 动态市场斐波那契水平(市场斐波那契)。  此指标独有的独特功能。 斐波那契应用于货币强度,而不是价格图表。 适应实时市场活动以获得准确的反转区域。 实时市场动量。  第 9 行显示市场是活跃还是被动。 对于定时交易至关重要。 全面的警报和显示。  每种货币最强的买入和卖出动量。 ​​28 对的双重动量买入和卖出。 超买/超卖警告外部范围和止损。 反转
该指标旨在与艾略特波浪理论相结合,提供了两种不同的工作方式: 自动工作: 在此模式下,指标会自动检测图表上的所有五个动机波浪,并为您提供预测和潜在的逆转区域。它还可以提供警报和推送消息。这种自动功能简化了识别和分析艾略特波浪模式的过程。 手动工作: 此选项适用于喜欢手动方法的交易员,用于手动绘制九个不同等级的波浪。每个等级都可以在它们出现后通过调整图表上的绘制线条来单独定义。此功能简化了手动绘制波浪的过程,使其更加高效。需要注意的是,所有绘图数据将保存在平台的数据文件夹中,以备将来参考。 参数: Name: 指标名称。 Use_System_Visuals: 启用或禁用指标主题,以匹配交易平台的整体外观。 Explain_Comment: 允许启用或禁用波浪编号的解释性注释,有助于理解已识别的波浪。 Show_Last_Candle_Counter: 启用或禁用蜡烛计时器,提供有关当前蜡烛收盘的剩余时间的信息。 Candle_Counter_Color: 蜡烛计时器文本的颜色。 Basic_Wave_Color: 用于表示波浪的主要颜色。 Bullish_Wave_Color: 当检测
Hit Rate Top Bottom Signal
Martin Alejandro Bamonte
命中率顶部底部信号 命中率顶部底部信号 命中率顶部底部信号 提供了一种完全创新的方法。 它非常适合那些希望预先评估信号在特定 TP-SL 下的表现以及在哪些货币对/时间框架(TF)中效果最佳的人。 命中率顶部底部信号 策略是 任何交易员和任何交易类型 的重要工具,因为它不仅发出 精确且不重绘的信号 ,明确指示何时交易以及交易方向,而且还 详细记录每个货币对和时间框架的命中率 ,并预设止盈(TP)和止损(SL)。 这使得能够提前知道信号的有效性比率 ,对于良好的风险管理和精确的交易至关重要。 该策略的独特之处在于它专注于在波动的反转点进行检测,而不是在整个行情中,这使得信号的发出频率比传统的顶部底部信号更高,专注于 市场每一个重要波动的关键时刻。 这种以百分比显示 信号历史效果与SL/TP比率结合的能力 使得这项策略成为安全交易的最佳选择,让交易员能够基于数据做出决策。 依靠一个不仅清晰直接而且历史记录良好的信号,我们正在使用市场上最好的策略之一。 如何使用该系统进行交易? 打开多个货币对并在每个货币对上加载指标。现在,分析每个货币对,以确定哪些货币对和时间框架(TF)信号效果
MACD Divergence
Sergey Deev
2.5 (2)
The indicator detects divergence signals - the divergences between the price peaks and the MACD oscillator values. The signals are displayed as arrows in the additional window and are maintained by the messages in a pop-up window, e-mails and push-notifications. The conditions which formed the signal are displayed by lines on the chart and in the indicator window. Indicator Parameters MacdFast - fast MACD line period MacdSlow - slow MACD line period MacdSignal - MACD signal line period MacdPric
Gold Buster M1 System - 是 XAUUSD 货币对 M1 图表的专业交易系统。但是,尽管该系统最初是专门为交易黄金而开发的,但该系统也可以与其他一些货币对一起使用。购买后,我会给你一个除了XAUUSD之外,可以和系统一起使用的交易对列表,这将扩大你使用这个系统的可能性 系统中的所有指标都不会重复! 该系统是一组三个指标。它是一个趋势指标、箭头指标和成交量指标,直观地显示了市场的强弱。 购买后,您可以立即下载趋势指标。我将免费为您提供剩余的两个指标,因为它们是整个系统的一部分。我还将为您提供一个模板,您可以使用该模板在图表上加载指标。此外,我将教你如何使用我的系统进行交易并分享我的建议。还有丰厚的红利等着你! 购买后请务必立即写信给我!
Pips Average Range
Francesco Petralla
This indicator compares the pips of the current day with the average of pips made in the previous three days. The "Percentage today range" is red if today's figure is less than the range of the previous three days, but turns green when the percentage exceeds 100%. When the range exceeds 100% there are good trading opportunities because we are in the presence of increased volatility of the past three days. Best use with Banks Day Levels indicator. Parameters settings corner (indicator display po
Nas100 Killer V2
Lesedi Oliver Seilane
4 (1)
Nas100 killer V2 (See video of how we test the indicator live) 1000% non-repaint indicator appears on current candlestick. Timeframes: M5, M15, M30, H1, H4. Works on pairs such as (NAS100, US30, SPX500, and Gold) The indicator is strictly for scalping do not hold trades for too long. Orange arrows look for selling opportunities. Light Blue arrows look for buying opportunities. 
CYov_KijunLine_MTF (Kijun Ribbon / Multi-Timeframe Kijun) This indicator is designed to visualize Ichimoku Kijun-sen together with a higher-timeframe Kijun-sen , helping you keep your trading bias consistent and avoid low-quality conditions. It is not a “magic signal generator”. The goal is to provide a clearer perspective so you can reduce mistakes and avoid bad trades . 1. What is Kijun-sen? Kijun-sen is a core line of the Ichimoku system calculated from the highest high and lowest low over a
Rainbow Price Visualizer
Vincent Jose Proenca
Rainbow Price Visualizer v1.21 See where the market really breathes. Turns your MT4 chart into an ultra-precise heatmap that highlights price zones favored by big players. Why it matters 300 price levels at 0.2‑pip resolution — microscopic detail. 8 visual themes (Rainbow, Fire, Ocean…) for instant readibility. Smart opacity: low noise fades, real zones pop. Lightweight rendering with automatic cleanup. Fully customizable: saturation, opacity, resolution, history depth. Bands project into the f
Asynchronous Trend
Vitalii Zakharuk
Asynchronous Trend - this will be the final signal that an uptrend or downtrend has begun or has exhausted itself. This is a great addition to any strategy. Trading based on trend indicators is the simplest and often the most effective. The tool does not take up much space on the chart and does not overload the terminal. You can find many different versions of this tool on the internet, but one of the most effective is the no-redraw version, which you can buy here. The indicator allows you to t
Turtle fast movement
Abdallah Moustafa Hamdy Ahm Abdelrazek
This trend following system was designed by   Dennis Gartman   and   Bill Eckhart , and relies on breakouts of historical highs and lows to take and close trades: it is the complete opposite to the "buy low and sell high" approach. This trend following system was taught to a group of average and normal individuals, and almost everyone turned into a profitable trader. The main rule is   "Trade an N-day breakout and take profits when an M-day high or low is breached (N must me above M)" . Example
PanBandsRegime for Market Regime Switching Author :   Heping Pan Swingtum Prediction Pty Ltd, Australia panhepingism@gmail.com 02/01/2026 Des cription Move beyond conventional indicators. PanBandsRegime.ex4 is a new innovative indicator for market regime switching. It is designed based the theory and design of Pan Bands of Asymmetric Volatility. The primary indicator for Pan Bands is provided separately as PanBands.ex4. Each of the two indicators PanBands.ex4 and PanBandsRegime.ex4 is self-cont
Awesome Oscillator 扫描器 MT4 是一款功能强大的交易工具,旨在使用 Awesome Oscillator 进行无缝分析和实时洞察。它使交易者能够监控多个货币对和时间框架,提供即时警报和全面的市场更新,以领先于市场动态。该工具通过动态仪表板组织信号,确保高效且明智的交易决策。 主要功能: 轻松的 Awesome Oscillator 扫描:轻松扫描多个货币对,并在满足特定 Awesome Oscillator 条件时接收即时警报,确保您领先于市场动态。 全面的仪表板洞察:实时获取各个货币对的 Awesome Oscillator 反转和趋势更新,支持自信且明智的交易决策。 扩展的货币对支持:访问广泛的货币对,扩大您的交易机会和市场覆盖范围。 历史信号变化跟踪:通过跟踪历史信号变化评估交易信号的相关性和准确性,利用宝贵洞察增强决策过程。 多时间框架扫描:分析多个时间框架以获得市场趋势的全面视图,提升您的交易策略。 轻松的图表导航:通过点击图表上的符号名称,从单一图表无缝导航到任何货币对,简化您的分析过程。 可定制的仪表板设置:根据您的偏好定制仪表板设置的显示,享受完全
Alpha Trend sign Alpha Trend sign 是我么长期以来非常受欢迎的交易工具,它可以验证我们的交易系统,并且明确的提示交易信号,并且信号不会漂移。 主要功能: •  根据市场显示活跃区域,根据指标可以很直观的判断当前行情是属于趋势行情,还是震荡行情。    并根据指标的指示箭头切入市场,绿色箭头提示买入,红色箭头提示卖出。 •  建议使用5分钟以上的时间周期进行交易,避免因为小周期波动出现频繁的交易信号。 •  您也可以开启信号提示,以免错过最佳的交易时机。 •  本指标不但可以很好的预测趋势行情,也可以在宽幅震荡行情中获利。 •  本指标本着大道至简的原则,适合不同阶段的交易者使用。 注意事项: •  Alpha Trend sign 有明确的进出场信号,不建议逆势操作,以免造成损失。 •  Alpha Trend sign 是特别成熟的指标,我们团队人手一个,使用它可以实现稳定盈利。     
SimpleProb
Augusto Martins Lopes
SimpleProb:您的金融市场新盟友! 描述 您是否厌倦了复杂的指标,让交易变得更加混乱?SimpleProb 是专为 MetaTrader 4 设计的技术分析指标,它以简单高效的方式帮助您做出买卖决策。 SimpleProb 通过分析最近 14 个周期的价格走势,计算上涨 ( CALL ) 和下跌 ( PUT ) 的概率,并在您的图表上提供清晰的视觉信号,让交易决策更加直观。 如何运作? 简单概率计算 :分析最近 14 个价格周期,计算上涨和下跌的概率。 视觉信号 : 绿色箭头 :表示高概率买入机会,箭头出现在价格下方。 红色箭头 :表示高概率卖出机会,箭头出现在价格上方。 统计信息框 :图表上的统计框实时显示当前的上涨和下跌概率,并可自由移动,方便您的分析。 为什么选择 SimpleProb? 简单易用 :即使是初学者也能轻松理解和使用。 精准分析 :基于可靠的统计计算,帮助识别市场机会。 可定制 :调整概率阈值,使指标符合您的交易风格。 互动性强 :统计信息框可自由移动,完全适配您的图表布局。 如何获取? 不要再浪费时间在复杂且低效的指标上。立即获取 SimpleProb,让
平均方向指数(ADX) 多货币扫描仪 MT4 是一种先进的交易指标,旨在同时分析多个货币对。它为希望通过提供基于平均方向指数的实时信号来增强决策过程的交易者带来了好处,从而实现高效的市场趋势分析。 该工具通过简化趋势强度和方向移动的识别来优化交易体验,使其成为采用 ADX 基础策略的交易者的重要资产。借助实时警报和用户友好的仪表板,交易者可以快速评估市场状况并做出明智的交易选择。 MQL产品安装指南 | 在 MT4/MT5 上更新已购买的MQL产品 | 常见故障排除指南 | 指标设置 / 指南 主要特点 缓冲区集成:将指标值暴露为可访问的缓冲区,允许 Expert Advisor 使用信号数据进行自动交易。 可视化箭头信号:在信号蜡烛上直接在图表上显示清晰的买入/卖出箭头,便于快速视觉分析。 快速且可回测:基于 MetaTrader 的本地 OnCalculate() 引擎构建,确保快速计算并与历史回测兼容。 弹出警报:在信号事件期间触发 MetaTrader 警报弹出窗口,确保交易者不会错过潜在的交易设置。 推送通知:向移动设备发送即时推送通知,使交易者能够在移动中监控信号。 电子邮
Upgrade your charts instantly. Smart Round Levels draws powerful .00 and .50 round-number zones automatically on  any forex pair — including  JPY pairs  like USDJPY — and features a dynamic  live price tracker  that follows price in real time. Features: • Automatic round-number detection (.00 & .50) • Auto-adjusts for JPY and non-JPY pairs • Perfect precision with customizable spacing & scale • Fully customizable colors, line widths, font sizes • Real-time yellow price label tha
供求区关键价指标 背景 系统自动搜索 K 线中的供求区域,并画出实时的关键价格线,交易者可以根据价格交易线进行交易。 主要特点 系统是自动搜索 K 线中的供求区域的,系统同时会画出实时的关键价格线,交易者可以根据价格交易线进行交易。所以使用供求区策略的交易员无需再耗费时间去寻找标识供求区域,而可以关注在价格对供求区域以及关键价格的反应,制定适合自己的交易策略。 然而供求区策略本身就是一个在震荡时期更加有效的策略,所以当市场呈现强大趋势的时候,应当小心使用,或者按顺应趋势的方向使用指标提供的建议。   范围 ShowZones :是否显示供求区域 DrawLines: 是否显示关键价格 SupplyZoneLineColor: 供给区价格线颜色 DemandZoneLineColor: 需求区价格线颜色 PenatratedLineColor: 被击穿价格线颜色   执行 只需将指标附加到图表上即可。 请给我您宝贵的意见,让我改进指标。 如有问题,联系微信 imlizard
Preface: First of all, let me introduce myself. I am a programmer and have been working for over 20 years. 2023 has passed, and our studio has achieved a record of 500 times with 7 manual transmissions. Below, we will show you how to do it through a series of operations. The first step is to model. Modeling is to find a fixed trading pattern. I think everyone has heard of a 2/8 probability, and through this probability, we can further refine it, which means that 1 to 4 is the optimal state. We h
ICT Silver Bullet – Time Window Indicator The ICT Silver Bullet indicator automatically marks the ICT Silver Bullet time windows on your chart, helping you stay focused on the highest-probability setups defined by the ICT methodology. This tool is especially powerful when combined with a Fair Value Gap (FVG) indicator – simply wait for an FVG setup to form inside the Silver Bullet window, and you’ll have a precise time-based confirmation for your entries. Key Features: Automatic Silver Bullet Wi
Renegades
Ivan Simonika
Renegade The indicator generates arrows (red and blue by default). The indicator is installed in the usual way on any trading symbol with any time interval. It is an auxiliary tool that is used for technical analysis of the price movement chart in the Forex market. Novice traders have difficulties both with finding an indicator and with its application. Their reason is the lack of technical awareness of ordinary users and the lack of basic knowledge about good trading programs. In Forex transa
Multi Indicators Screener is a compact multi-timeframe + multi-indicator dashboard for MetaTrader 4 that helps you instantly see the current market direction, confidence level, and volatility across selected timeframes. What you get on the chart NOW: BUY / SELL / WAIT with confidence % (updates in real time) Best Entry TF (timeframe with the strongest confidence for the current direction) Matrix screener : up to 10 indicators × multiple timeframes (signals per cell) TF Verdict row: aggregated di
REX complete 3in1
Christophe Godart
This is the complete REX package. It consists of the lite, pro and ULTRA version.  Perfect for beginners and intermediates. REX complete is 100% non repaint. The strategy is based on a mix of different strategies, statistics, including pivot points, oscillators and patterns.  As the trading idea consists of a variety of some classic indicators like Momentum, Williams Percent Range, CCI, Force Index, WPR, DeMarker, CCI, RSI and Stochastic, it is clear that the fundamental indicators have being u
Rira Renko
Vitor Palmeira Abbehusen
RENKO on Time Chart This indicator is an enhanced Renko, so you can watch the Renko bricks on the chart to understand price movement more clearly the other improvement is automated box size according to ATR (Average True Range) period you can set the ATR number as you want and the box size of Renko changes automatically based on price movement Inputs Mode: Box size is the input to specify the size of the Renko box you want to print on the chart. This input lets you choose the fixed box siz
GoldTrend MT4
Sopany Zemmy
5 (1)
GoldTrend MT4 - is  a leading indicator for Gold on MetaTrader 4 - In Update version has been added new ability on USD pairs     ( AUDUSD, EURUSD, GBPUSD, NZDUSD, USDCAD, USDCHF, USDJPY ) - very easy to use , even for beginners - Stoploss and Take Profit provided - no repaint, no redraw and no lagging  When you decide to enter the global market ,  then there is a technical skill you absolutely must have, - which is all about trends . Why - GoldTrend is different from others : Not only uptre
Breakout FX
David Leander Tschacher
5 (1)
Breakout FX draws arrows and emits alarms if the price exceeds or falls below the previous n candles. ️ Breakout FX can be used in expert advisors. ️ Breakout FX can improve already existing trading strategies. ️ Breakout FX is very fast and is not repainting. Inputs Breakout Range [Candles] Breakout Price Type Arrow Size Enable Alerts Enable Push Notifications Enable Emails
Pokilopers
Andrey Kozak
Pokilopers - the finished trading system is presented as an indicator for the Metatrader4 platform. When added to a chart, Pokilopers automatically analyzes the situation on the market, determines the direction of the trend, resistance points, the price movement channel and other market factors that affect the current and future price movements. After that, Pokilopers automatically determines the most effective point for opening a trade and gives the trader a signal in the form of an arrow. Afte
Nasdaq Savages
Lesedi Oliver Seilane
Nasdaq Savages Non-repaint indicator  works on all timeframes 1 minute to 15 minutes timeframe for scalpers. 30 Minutes to Monthly timeframe for swing traders The Nasdaq Savages indicator comes with a top right info tab which tells you about the current buy or sell signal, Profit in pips, Stop loss and Target Red arrow is your sell entry signal the white right tick is your exit signal and take profit hit signal Light blue arrow is your buy entry signal the white right tick is your exit signal an
Gets
Andrey Kozak
Gets is a smart trading system with complex market analysis mechanism. The operation principle of Gets is based on neural networks and diversified collection of information from various market analyzers. Then the system analyzes the statistical databases to create a general idea of the current market situation and the further price movement. The information is displayed on the screen in a simple and intuitive way - in the form of buy and sell arrows. Also, the information on the current trend st
该产品的买家也购买
Gann Made Easy
Oleg Rodin
4.83 (162)
Gann Made Easy 是一个专业且易于使用的外汇交易系统,它基于使用先生理论的最佳交易原则。 W.D.江恩。该指标提供准确的买入和卖出信号,包括止损和获利水平。您甚至可以使用推送通知在旅途中进行交易。 购买后请联系我,即可免费获得交易指导和超棒的额外指标! 您可能已经多次听说过江恩交易方法。通常 Gann 的理论不仅对于新手交易者而且对于那些已经有一定交易经验的人来说都是非常复杂的东西。这是因为江恩的交易方法在理论上并不那么容易应用。我花了几年时间来完善这些知识,并将最好的原则应用到我的外汇指标中。 该指标非常易于应用。您所需要的只是将其附加到您的图表并遵循简单的交易建议。该指标不断进行市场分析工作并寻找交易机会。当它检测到一个好的入口点时,它会为您提供一个箭头信号。该指标还显示止损和获利水平。 换句话说,当您像先生一样进行交易时,该指标会为您提供最佳江恩建议。江恩亲自告诉你此时此刻该做什么。但最好的部分是您不需要了解任何有关江恩交易原则的知识,因为该指标会为您完成整个市场分析工作。
Scalper Inside PRO
Alexey Minkov
4.74 (69)
Scalper Inside PRO – Since 2020. An exclusive indicator that utilizes an innovative algorithm to swiftly and accurately determine the market trend. The indicator automatically calculates opening, closing, and profit levels, providing detailed trading statistics. With these features, you can choose the most appropriate trading instrument for the current market conditions. Additionally, you can easily integrate your own arrow indicators into Scalper Inside Pro to quickly evaluate their statistics
PRO Renko System
Oleg Rodin
5 (30)
PRO Renko Arrow Based System for trading renko charts.  准确的信号交易任何外汇工具. 另外,我将免费提供系统的附加模块! PRO Renko系统是RENKO图表上高度准确的交易系统。该系统是通用的。 该交易系统可应用于各种交易工具。 该系统有效地中和了所谓的市场噪音,打开了获得准确反转信号的通道。 该指标易于使用,只有一个参数负责产生信号。 您可以很容易地使算法适应您感兴趣的交易工具和renko酒吧的大小。 我很乐意通过提供任何咨询支持来帮助所有客户有效地使用该指标。 祝您交易成功!购买后,立即写信给我! 我将与您分享我的建议和我的renko发电机。 另外,我将免费提供系统的附加模块!
Auto Optimized Parabolic RSI: 高级 3D 动量引擎 大多数零售指标之所以失效,是因为它们依赖于静态输入,一旦市场波动率发生变化,这些输入就会崩溃。Auto Optimized Parabolic RSI 通过不断重新计算自身的数学优势,解决了“指标衰退”的问题,将机构级别的量化自适应能力直接引入您的 MT5 终端。 核心优势:定制的内存 3D 优化   标准的自动优化器通常会导致 MT5 平台卡顿,因为它们通过标准的指标调用使终端超载。该工具完全绕过了这些性能瓶颈。内部引擎采用定制的原生基于 RAM 的计算器构建,每次加载图表或更改时间周期时,它都会执行极速的 3D 网格搜索。它同时扫描 RSI 周期(频率)、SAR 步长(加速度)和 SAR 最大值(速度限制),在绝对的毫秒级时间内测试数以万计的参数组合,且完全不会拖慢您的平台。它不是仅仅寻找一个“不错”的设置,而是映射整个参数空间,以寻找资产当前动量结构的绝对全局最大值。 严格的财务评分与逼真的交易模拟   与基于抽象“指标点数”进行优化评分的业余工具不同,该引擎的 3.10 版本严格与资金数学挂钩。每
Quantum Breakout Indicator PRO
Bogdan Ion Puscasu
4.96 (26)
介绍     Quantum Breakout PRO   ,突破性的 MQL5 指标,正在改变您交易突破区域的方式!   Quantum Breakout PRO 由拥有超过 13 年交易经验的经验丰富的交易者团队开发,旨在通过其创新和动态的突破区域策略将您的交易之旅推向新的高度。 量子突破指标将为您提供带有 5 个利润目标区域的突破区域的信号箭头,以及基于突破框的止损建议。 它既适合新手交易者,也适合专业交易者。 量子 EA 通道:       点击这里 MT5版本:   点击这里 重要的!购买后请私信我领取安装手册。 建议: 时间范围:M15 货币对:GBPJPY、EURJPY、USDJPY、NZDUSD、XAUUSD 账户类型:ECN、Raw 或 Razor,点差极低 经纪商时间:GMT +3 经纪商:IC Markets、Pepperstone with Raw 和 Razor 的点差最低 规格: 不重漆! 最多 5 个建议利润目标区域 建议止损水平 可定制的盒子。您可以设置自己的 Box Time Start 和 Box Time End。 接触 如果您
Market Makers
Mohamed Hassan
5 (4)
After purchase, contact me privately to receive 1 month of free testing with EA Forex Proton! This advanced MT4 trading robot automatically executes signals from any MT4 indicator, including Market Makers. The latest version also includes AI integration, allowing each trade signal to be analyzed using Artificial Intelligence. Live Signal with EA Forex Proton: Click here Market Makers is a powerful price action trading system designed to identify high-probability Buy and Sell opportunities based
Apex Edge 无重绘指标 适用于 MT4 的专业无重绘交易指标 Apex Edge 无重绘指标是一款优质、简洁、可靠的交易工具,专为追求清晰信号且不想被重绘箭头困扰的专业外汇和加密货币交易者而设计。 主要功能: 100% 不重绘 – 信号一旦出现在图表上,位置便固定不变 双信号系统:RAW 信号用于捕捉早期交易机会,CONF 信号用于高概率确认入场 一键式切换按钮:RAW 开/关和 CONF 开/关 专业实时仪表盘,显示趋势、强度百分比和信号状态 即时提醒:弹出窗口、声音和电子邮件通知 每个 CONF 信号自动绘制 TP1、TP2 和止损位 清晰的颜色编码箭头,带来即时视觉体验: 亮绿色 → CONF 买入 红色 → CONF 卖出 道奇蓝 → RAW 买入 品红色 → RAW 卖出 适用于所有时间周期和所有交易品种 优势: 消除信号消失或移动的常见问题 帮助您更有信心地进行交易,并更好地进行风险管理 可靠的即时提醒,节省屏幕时间 提供清晰的止盈和止损指导自动 适用于日内交易、超短线交易和波段交易 市场: 所有外汇货币对(主要货币对
Please send me Direct message on MQL5 CHAT after purchasing the Indicator for Training and Installation Support There are some additional files that is important to use with the Indicator . So be sure to contact me after purchasing the Indicator So that I can add you for training and support . If you find any difficulty with installation then send me Direct message here So that I can connect with you via Anydesk or Teamview for the product installation. " Smart Order Block Indicator " to find m
GoldRush Trend Arrow Signal
Kirk Lee Holloway
5 (2)
GoldRush 趨勢箭頭信號 GoldRush 趨勢箭頭信號 指標為 XAU/USD 中的高速、短期短線交易者提供精確、實時的趨勢分析。 專為1分鐘時間框架設計,此工具顯示方向箭頭以明確顯示入場點,使短線交易者能在波動市場中自信操作。 該指標包含主要和次要警示箭頭。主要信號為白色和黑色方向箭頭,用於指示趨勢方向的轉變;次要信號為藍色和紅色箭頭,用於確認主要箭頭指示的方向並提示潛在交易入場點。 注意:當趨勢方向發生變化後僅出現一個主要警報箭頭時,請注意可能會出現多個次要藍/紅箭頭。次要信號將在滿足信號標準的任何蠟燭圖後出現,因此在長期趨勢移動中,螢幕上將顯示大量次要箭頭(如附帶的截圖所示)。您可在設置中開啟或關閉任一箭頭類型。 以下是我使用此指標進行交易的方式: - 對於買入入場,我會耐心等待白箭頭在蠟燭收盤時出現,並在下一根可用蠟燭收盤時出現藍箭頭時進行買入交易。 - 對於賣出入場,我會耐心等待黑箭頭在蠟燭收盤時出現,並在下一根可用蠟燭收盤時出現紅箭頭時進行賣出交易。 - 獲利了結/止損設置由使用者自行負責,但我個人使用最低R:R為1:2,並發現這在倫敦/紐約開盤等
Dynamic Scalper System
Vitalyi Belyh
5 (1)
“ Dynamic Scalper System ”指标专为在趋势波内进行剥头皮交易而设计。 已在主要货币对和黄金上进行测试,并可与其他交易工具兼容。 提供顺势短线建仓信号,并提供额外的价格变动支持。 指标原理: 大箭头决定趋势方向。 在趋势波内,我们采用一种生成小箭头形式的剥头皮交易信号的算法。 红色箭头代表看涨方向,蓝色箭头代表看跌方向。 敏感的价格变动线会沿着趋势方向绘制,并与小箭头信号协同作用。 信号运作方式如下:当线在适当时刻出现时,将形成入场信号;在出现线时,持仓;线完成后,平仓。 建议的操作时间范围为M1 - H4。 箭头在当前K线上方形成,如果下一根K线已开仓,则不会重新绘制上一根K线上方的箭头。 输入参数 Trend Wave Period - 趋势方向(大箭头)的周期,改变趋势波的时间间隔。值 1 表示趋势方向的最长持续时间,参数值越大,持续时间越短。 Scalper Arrows Period - 信号箭头(小箭头)的计算周期,改变入场信号的生成频率。值 3 表示最频繁的生成频率,参数值越大,箭头频率越低,准确度越高。 这些参数可以根据不同的时间范
PZ Trend Trading
PZ TRADING SLU
4.8 (5)
许多盈利交易者不仅知道如何识别市场趋势,而且也能把握趋势建立后的交易机会。 Pz 趋势交易 指标设计用来在趋势行情中尽可能的赚取利润。 已建立的趋势提供了一揽子交易机会,但大多数趋势交易指标完全忽视了它们,让交易者在趋势行情时完全不知道该如何做!一般趋势指标只通知有关的趋势变化,但根本不足以得到卓越的回报. Pz 趋势交易 指标比一般趋势指标显示多达 20 倍的交易 , 因为它注重所谓的市场时机。它不仅显示当前的市场趋势,也有回调,内柱线的突破和调整。它令您在趋势回调之后介入,安全的柱线内突破金字塔加仓,以及发现潜在的反转,和已知的调整。 趋势改变 一个趋势改变在市场方向变化时发生。趋势变化在图表上用带数字的彩色圆圈显示。蓝色 (1) 信号为上涨开始, 而红色 (1) 信号为下跌开始。趋势变化并非评估当前价格动作的结果, 它意味着交易设置是不定时地。如果您正确使用本指标, 在趋势变化时, 您将将已经入场 (参看下面的调整)。 回调 但凡趋势在运动中,行情上下抖动,盈利者收割利润,且其它参与者入场。趋势回调代表好的买入机会,通常是由主力获利离场导致。如果行情在回调后回归上行, 指标将
GOLD Impulse with Alert
Bernhard Schweigert
4.67 (12)
这个指标是我们2个产品 Advanced Currency IMPULSE with ALERT  +   Currency Strength Exotics 的一个超级组合。 它适用于所有时间框架,并以图形方式显示8种主要货币和一种符号的强势或弱势冲动! 该指标专门用于显示任何符号的货币强度加速,如黄金、异国货币对、商品、指数或期货。这是它的第一个指标,任何符号都可以被添加到第9行,以显示黄金、白银、石油、DAX、US30、MXN、TRY、CNH等的真实货币强度加速(冲动或速度)。 建立在新的基础算法上,它使识别和确认潜在的交易更加容易。这是因为它以图形方式显示了一种货币的强势或弱势是否正在加速,并测量了这种加速的速度--把它想象成你汽车中的速度表。当你加速时,事情显然会发生得更快,这在外汇市场上也是一样的,即如果你配对的货币正在向相反的方向加速,你就会发现一个潜在的有利可图的交易。 动态市场斐波那契28水平被用作警报触发器,将适应市场活动。如果冲动击中黄色触发线,你将收到警报。然后你就知道作为一个交易员应该做什么。货币对和方向已经给出。只需点击警报按钮,就可以切换到该货
Advanced Supply Demand
Bernhard Schweigert
4.91 (300)
现在优惠 40%! 任何新手或专业交易者的最佳解决方案! 该指标是一款独特、高质量、且价格合理的交易工具,因为我们已经整合了许多专有功能和新公式。 依据此更新,您将能够显示双重时间帧区域。 您不仅可以显示一个较高的时间帧,还可以同时显示图表时间帧,加上更高的时间帧:显示嵌套时区。 供需双方所有交易者都会喜欢它。 :) 重要信息披露 高级供需的最大潜力,请访问 https://www.mql5.com/zh/blogs/post/720245   想象您的交易如何得以改善,是因为您能够精准定位入场或目标位吗? 构建于新的底层算法,它可以更轻松地识别出买卖双方之间的潜在失衡。 这是因为它以图形方式展示供需最强劲区域,及其过去的表现(显示旧区域)。 这些功能旨在帮助您更轻松地发现最佳入场区域和价位。 现在您可以针对您的交易品种和时间帧来优化和编辑区域强度! 高级供需指标适用于所有产品和时间帧。 它是一个新的公式,非常新的功能是两个区域强度函数可由用户输入进行调整! 这在交易中是一大优势。 当您学习如何使用专有功能,例如带有价格游离最小 X 因子的区域强度时,您能够判断该区域强劲与否。 供需
PZ Turning Points MT4
PZ TRADING SLU
1 (1)
该指标检查不同时期分形的价格结构,以确定市场中可能的反转点,从而为已经具有基本或技术估值模型的仓位交易者提供时机。与它的弟弟 Reversal Fractals不同 ,该指标不会因为所选时期而错过反转,并且会以之字形方式找到反转分形,而忽略那些没有足够动量来引发持续价格波动的反转。 [ 安装指南 | 更新指南 | 故障排除 | 常见问题 | 所有产品 ] 转折点可以开始长期趋势 指示器不重涂 它实现了各种警报 可自定义的颜色和尺寸 该指示符是无功或滞后信号,因为分形是奇数个条形的地层,是中间地带中最高或最低的条形,并且指示符在分形中的所有条形都闭合时绘制。但是,具有预先设定的方向偏差的交易者会发现该指标非常有用,可以提早进入切入点。 该指标既不是下探信号指标,也不是完整的交易系统。请不要这样评价或审查它。 输入参数 最小分形数:分形上的最小条形数。必须为奇数,例如3、5、7、9、11、13,... 最大分形:分形上的最大条形数量。必须为奇数,例如3、5、7、9、11、13 ... 最大历史柱数:指标加载时评估的过去柱数。 颜色:自定义箭头和线条的颜色和大小。 警报:启用或禁用各
PZ Support Resistance
PZ TRADING SLU
3.33 (3)
厌倦了绘制支撑线和阻力线? 支撑阻力 是一个多时间指标,可以自动检测并绘制图表中的支撑线和阻力线,并具有非常有趣的变化:随着时间的推移测试价格水平及其重要性的提高,线变得越来越粗。 [ 安装指南 | 更新指南 | 故障排除 | 常见问题 | 所有产品 ] 一夜之间增强您的技术分析 无需浏览图表即可检测重要的价格水平 一目了然地识别所有价格水平的相对优势 每次交易最多可节省半小时的绘图线 指标显示所有价格水平的期限 指示器不重涂 过去和现在的价格水平因接近程度而崩溃,并根据当前的市场行为进行了调整。在动作发生的地方绘制了线条,而不一定在峰值处绘制了线条。 价格水平随着时间的推移而被拒绝,变得越来越暗 定期清除不重要的价格水平以避免噪音 可自定义的时间范围选择和崩溃因子 它实现了电子邮件/声音/推送警报的突破 输入参数 指标设置:指标将从当前时间段读取价格,但您可以选择另一个。例如,您可以在H4图表中显示D1支撑线和阻力线。您还可以使用 价格水平密度 参数选择在图表上显示多少价格水平。 颜色设置:根据重要性输入所需的支撑线和阻力线颜色。 标签设置:(可选)可以在指示器中显示用于
Super Signal – Skyblade Edition 專業級無重繪 / 無延遲趨勢信號系統,擁有卓越勝率 | 適用於 MT4 / MT5 在較低的時間週期上效果最佳,例如 1 分鐘、5 分鐘與 15 分鐘圖表。 核心特色: Super Signal – Skyblade Edition 是一套專為趨勢交易設計的智能信號系統。 其採用多重濾波邏輯,僅篩選出具有明確方向性、動能強勁且波動結構健康的走勢進場點。 本系統 不預測高點或低點 ,只有在同時滿足以下三項條件時才會觸發交易信號: 趨勢方向明確 動能持續增強 波動率結構穩定 此外,系統還結合市場流動性分析,以進一步提升信號的準確性與觸發時機。 信號特性: 所有箭頭信號皆為 100% 無重繪,無延遲 信號一旦出現即固定於圖表,不會閃爍或消失 提供圖表箭頭、資訊面板、彈出通知、聲音提示及推播訊息 支援 EA 呼叫(Buffer 輸出),可整合至自動化交易或信號跟單系統 提供預設參數模板,免調整即可使用,適合新手快速上手 總結: Super Signal – Skyblade Edition 是一款邏輯清晰、穩定高效的專業趨勢型
They say history repeats itself. What if you could prove it in real-time? The Propfolio Ghost Pattern is an advanced algorithmic pattern-matching engine. It empowers you to select any current price action structure on your chart and instantly scan thousands of historical candles to find the exact moment in the past where the market did the exact same thing. Once it finds the highest probability match, it projects the historical outcome into the future as "Ghost Candles"—giving you a highly calcu
目前有26%的折扣!! 这个指标是我们两个主要指标( Advanced Currency Strength 28   &  Advanced Currency IMPULSE with ALERT )的一个超级组合。它显示了28个外汇对的TICK-UNITS货币强度值和警报信号。可以使用11种不同的Tick-Units。它们是1、2、3、4、5、6、10、12、15、20和30秒。子窗口中的Tick-Unit栏将被显示并向左移动,当在一秒钟的定时器中至少有一个Tick。 只用一个图表,你就可以剥28个外汇货币对的头皮!想象一下,你的剥头皮将如何提高。想象一下,你的剥头皮将如何改善,因为你能够准确地确定剥头皮机会的触发点? 这是市场上第一个在比1分钟更短的时间内工作的货币强度指标! 它是为那些希望快速进出并从市场中切出小点数的快速剥头皮者准备的。 用户手册:点击这里 https://www.mql5.com/en/blogs/post/727178 特点。 为28个货币对提供嘀嗒单位的卖出/买入警报,有一个按钮可以快速打开目标图表。 在3种敏感模式中选择一种(慢-中-快
Atomic Analyst
Issam Kassas
5 (5)
首先值得强调的是,该交易指标是非重绘、非延迟的指标,这使其成为手动和机器人交易的理想选择。 用户手册:设置、输入和策略。 Atomic Analyst是一种PA价格行动指标,利用价格的力量和动量来寻找市场上更好的机会。配备了高级过滤器,可帮助去除噪音和假信号,并提高交易潜力。使用多层复杂的指标,Atomic Analyst扫描图表,并将复杂的数学计算转化为任何初学者都能理解并用来做出一致交易决策的简单信号和颜色。 “Atomic Analyst”是专为新手和经验丰富的交易者量身定制的综合交易解决方案。它将高级指标和一流功能融合为一体的交易策略,使其成为所有类型交易者的多功能选择。 日内交易和剥头皮策略:专为快速准确的日内交易和短期交易而设计。 日内和摆动交易策略:可用作追求价格大幅波动的日内和摆动交易者的可靠工具。 多货币和市场:凭借其可靠的精度,在不同的工具和市场上运作。 多个时间框架:可在多个时间框架上使用,性能良好。 稳定性:所有指标均不重绘、不重绘和不滞后,确保可靠的信号。 信号清晰度:提供箭头信号,用于清晰的入场和出场点。 实时警报:通过交易入场、SL和TP警报通知交易者
Trend Screener
STE S.S.COMPANY
4.79 (95)
趋势指标,趋势交易和过滤的突破性独特解决方案,所有重要趋势功能都内置在一个工具中! 它是 100% 非重绘多时间框架和多货币指标,可用于所有符号/工具:外汇、商品、加密货币、指数、股票。 限时优惠:支撑和阻力筛选指标仅售 65美元,终身有效。(原价 250 美元)(优惠延长) 趋势筛选器是有效的指标趋势跟踪指标,它在图表中提供带有点的箭头趋势信号。 趋势分析器指标中可用的功能: 1.趋势扫描仪。 2. 具有最大利润分析的趋势线。 3.趋势货币强度计。 4. 带有警报的趋势反转点。 5. 带有警报的强趋势点。 6. 趋势箭头 每日分析示例,每日信号表现...等与我们的趋势筛选指标,可以在这里找到: 点击这里 限时优惠:Trend Screener Indicator 仅售 150 美元且终身可用。原价 199$) 通过访问我们的 MQL5 博客,您可以找到我们所有的高级指标以及分析示例、每日信号表现...等。 : 点击这里 我们的趋势系统由 2 个指标组成: 1. Trend Screener Indicator:显示趋势仪表盘、图表中的趋势线、入场点...等。 2. Trend
购买后请联系我,获取基于此指标的奖励EA。 Self Optimizing Double MA Strategy 是一款专业级别的交易工具,旨在消除参数猜测。它由内置的自动优化引擎驱动,通过在后台模拟数千种参数组合,不断适应不断变化的市场条件,从而保持统计上的优势。 该指标不依赖于静态、过时的设置,而是动态更新其内部逻辑,为当前的时间周期和交易品种寻找最赚钱的配置。 核心功能 内置自动优化:系统会根据您选择的更新频率,定期重新计算快速 MA、慢速 MA 和 RSI 的周期,确保您的设置始终与当前的市场节奏保持一致。 MA 发散过滤器:一项核心的趋势强度指标,仅在移动平均线积极发散时才确认信号的有效性。这可以防止在均线收敛或平缓的盘整市场中产生虚假的入场信号。 时序评分引擎:内部模拟器在图表上绘制任何实时信号之前,会根据您的具体目标(例如最大化利润因子或最小化回撤)对历史信号进行评估。 动态 ATR 区域:根据实时市场波动率,自动计算并在图表上直观地投射出止盈和止损区域。 实时绩效仪表板:直接在您的图表上跟踪并显示实时的系统指标,包括历史胜率、平均回撤以及产生的总点数。 完美支持 EA
Bull versus Bear
Mohamed Hassan
4.5 (18)
Send us a message after your purchase to receive more information on how to get your  BONUS  for FREE  that works in great combination with Bull vs Bear ! Bull versus Bear is an easy-to-use Forex indicator that gives traders clear and accurate signals based on clear trend retests . Forget about lagging indicators or staring at charts for hours because  Bull vs Bear provides real-time entries with no lag and no repaint, so you can trade with confidence. Bull vs Bear  helps you enter trades during
Advanced Currency Strength28 Indicator
Bernhard Schweigert
4.91 (657)
目前40%的折扣 任何新手或专家交易者的最佳解决方案! 这个指标是一个独特的、高质量的、可负担得起的交易工具,因为我们纳入了一些专有的功能和一个新的公式。只需一个图表,你就可以读出28个外汇对的货币强度!想象一下,你的交易将如何得到改善,因为你的交易是在你的手中进行的。想象一下,你的交易将如何改善,因为你能够准确地确定新趋势或剥头皮机会的触发点? 用户手册:点击这里  https://www.mql5.com/en/blogs/post/697384 这是第一本,原版的! 不要买一个毫无价值的崇拜者的克隆品。 特别的 子窗口中的箭头显示强劲的货币势头GAP将指导你的交易! 当基础货币或报价货币处于超卖/超买区域(外盘斐波那契水平)时,在个人图表的主窗口中出现警告信号。 当货币力量从外围区间回落时,回撤/反转警报。 十字星模式的特别警报 可选择多个时间框架,以快速查看趋势! 货币强度线在所有的时间框架中都非常平稳,当使用较高的时间框架来识别总体趋势,然后使用较短的时间框架来确定精确的入口时,效果非常好。你可以根据自己的意愿选择任何时间框架。每个时间框架都由其自身进行了优化。
Cyclic Impulse
Vitalyi Belyh
构建图表并识别周期性价格变动的技术指标。 可以在任何图表上工作。 几种类型的通知。 图表本身还有额外的箭头。 无需重新绘制历史记录,只需关闭蜡烛即可。 建议使用 M5 及以上的 TF。 易于使用和配置参数。 当使用 2 个具有不同参数的指标时,您可以单独使用它们,而无需其他指标。 有 2 个输入参数 周期性和信号持续时间 这两个参数处理图表结构的处理。 Cyclicity 调节反转周期的变化频率,平滑周期。 Signal duration 为最小数字,检测价格变动中的脉冲,最大长期趋势变动。    ---------------------------------------------------------------------------------------
KuKl
IGOR KIRIANEN
The indicator is built on a non-standard Zig Zag, it draws accumulations after which if the price leaves this zone and a test of this zone occurs, then a sound signal is given and an arrow appears - after the test candle closes.The indicator does not redraw its signals, it is very easy to use, there are only three settings 1- this is the zig zag parameter 2- this is the minimum price exit from the zone 3- this is the maximum price exit from the zone. The lower the parameter for Zig Zag, the more
Advanced Currency IMPULSE with ALERT
Bernhard Schweigert
4.9 (490)
目前40%的折扣!! 对任何新手或专家交易者来说都是最好的解决方案! 这个指标是一个独特的、高质量的、负担得起的交易工具,因为我们已经纳入了一些专有的功能和一个秘密的公式。只需一张图表,它就能给出所有28种货币对的警报。想象一下,你的交易将如何改善,因为你能够准确地确定新趋势或剥头皮机会的触发点 建立在新的基础算法上,它使识别和确认潜在交易变得更加容易。这是因为它以图形方式显示了一种货币的强势或弱势是否正在加速,并测量了这种加速的速度--把它想象成你汽车中的速度表。当你加速时,事情显然会发生得更快,这在外汇市场上也是一样的,即如果你配对的货币正在向相反的方向加速,你就会发现一个潜在的有利可图的交易。 货币动量的垂直线和箭头将指导你的交易! 动态的市场斐波那契23水平被用作警报触发器,将适应市场活动。如果冲动触及黄色触发线,您将在MetaTrader或您的电子邮件或推送警报中收到警报。然后你就知道作为一个交易员应该做什么。货币对和方向已经给出。只要点击警报按钮,就可以切换到该货币对或打开一个新的图表,以便进一步分析。警报级别可以通过用户输入来改变,可以选择3个敏感度级别。 尽
Lux Trend
Mohamed Hassan
5 (7)
Huge 70% Halloween Sale for 24 hours only!  After purchase, please contact me to get your trading tips + more information for a great bonus!   Lux Trend is a professional strategy based on using Higher Highs and Lower Highs to identify and draw Trendline Breakouts! Lux Trend  utilizes two Moving Averages to confirm the overall trend direction before scanning the market for high-quality breakout opportunities, ensuring more accurate and reliable trade signals. This is a proven trading system u
Gold PL MTF 4
Sergei Linskii
Gold PL MTF - 這是一項優秀的股票技術指標。指標演算法分析資產價格的走勢,並使用斐波那契方法(黃金分割)自動反映指定時間範圍(TF)的重要樞軸水準。 此指標完美地描述所選時間範圍(日、週、月、年)的價格軌跡,確定趨勢的開始和修正的開始,並可能發展為相反的趨勢。 此指標也顯示不同時間範圍內目前未使用的樞軸水平,作為價格磁鐵。這使得您能夠快速評估市場狀況並做出進入和/或退出交易的決定。每筆交易的潛力平均為50至1000點。 此指標可讓您評估不同時間範圍內價格變動的可能方向,並顯示最可能的目標和價格變動的潛力。 指標的優點: 1. 指標產生高精度訊號。 2. 樞軸水平不會消失,也不會重新繪製。只有當趨勢強勁時,FP 緩衝區的確認箭頭訊號才能重建。 3.您可以在任何經紀商的MetaTrader 4交易平台上進行交易。 4. 您可以交易任何資產(貨幣、金屬、加密貨幣、股票、指數等)。 5. 建議中長期交易的時間範圍為 H1-H4。 6. 可以在指標設定中更改單獨的參數(TF,顏色等),以便每個交易者可以輕鬆地為自己自訂指標。 7. 此指標可作為您交易系統的優秀主要補充,也可
Gold Venamax MT4
Sergei Linskii
3 (2)
Gold Venamax   - 這是最好的股票技術指標。 此指標演算法分析資產的價格變動並反映波動性和潛在的進入區域。 指標特點: 這是一個帶有 Magic 和兩個趨勢箭頭塊的超級指標,可實現舒適且有利可圖的交易。 圖表上顯示用於切換方塊的紅色按鈕。 Magic 在指標設定中進行設置,以便您可以將指標安裝在顯示不同區塊的兩個圖表上。 Gold Venamax 可以放置在具有不同箭頭緩衝區(GV 和 SD)的兩個圖表上。 為此,您需要在設定中選擇不同的 Magic,例如,一個具有 Magic = 999,另一個具有 Magic = 666。接下來,您可以使用圖表上的紅色按鈕選擇箭頭緩衝區。 指標設定中的每個箭頭緩衝區(GV и SD)都有一個單獨的箭頭過濾器,以實現舒適且有利可圖的交易(UseFiltrGV = true; 和 UseFiltrSD = true;)。 進入的最佳訊號 = 遵循兩個緩衝區的訊號箭頭(GV 和 SD)+ 所有三個 MA 線(紅色或藍色)的方向 + TMA 通道邊界(下或上) 。 TMA 通道邊界(下限或上限)也可用於鎖定利潤和/或以較短的停損位進行逆
RFI levels PRO
Roman Podpora
5 (1)
该指标能够准确显示反转点和价格回落区域。     行业领军人物 。您能洞察新趋势的形成,并以最高的精准度做出决策,掌控每一笔交易。 与……结合时,展现其最大潜力     趋势线专业版   指标  VERSION MT5 该指标显示的内容: 新趋势开始时的反转结构和反转水平及其激活。 显示屏   获利了结   和   止损   风险回报比最低的水平     RR 1:2       。 具有智能减值逻辑的止损。 显示指定指标中两种趋势类型的反转形态。 指标: 根据     趋势线     (全球趋势变化) 潮流专业版     (趋势快速变化) 简单有效   扫描器   实时趋势(新增)。 多时间框架工具筛选。 展示   利润   在 LOGIC AI 信号之后。 以下列出今日走势积极的金融工具。(RB键) 能够为终端启用通知(警报)功能,并向移动设备推送通知。 逻辑人工智能     — 利用人工智能寻找最佳切入点。 只有在启用 MTF(多时间框架分析)模式时,该功能才可用。 兼容性。 当与趋势线指标结合使用时,该指标能发挥其最大潜力。 这     RFI LEVELS PRO    
作者的更多信息
This is the free version of the Supply&Demand + Trendline + Trend tool. This version works only with EURCHF! You find the full version here:  https://www.mql5.com/en/market/product/67274 PAAIOS stands for   Price   Action   All   In   One   Solution. And that is the purpose of the Indicator. It should give you a tool to improve your trading decisively because you get the crucial information at a glance. The indicator simplifies the search for strong signals. It shows trend lines, demand and su
FREE
Netsrac SuPrEs
Carsten Pflug
5 (1)
The SuPrEs indicator indicates the distance to the next horizontal line whose name begins with the configured prefix (see Options). usage Draw support & resistance in the chart and let the indicator warn you, as soon as a configured distance is undershot. Use the prefix to provide alarms for other lines as well as standard lines (see screenshot with pivot indicator). Display of the indicator The indicator displays the distance to the next line above and below the current (Bid) price. Not more
FREE
The dashboard should help to get a quick overview of the correlations of different assets to each other. For this, the value series are compared according to the Pearson method. The result is the value of the correlation (in percent). With the new single asset mode, you can immediately see which symbols have the highest positive or negative correlation. This prevents you from accidentally taking a risk on your trades with highly correlated symbols. Usage There are different methods for the corr
Netsrac SR Dashboard
Carsten Pflug
5 (4)
With the SR Dashboard, you get a powerful tool to control some of the most important information in trading. Assemble a setup according to your strategy and get informed as soon as this setup is valid. Assign scores to defined conditions and let the Dashboard find them. Choose from Trend, Average Daily Range, RSI, Moving Averages, Pivot (Daily, Weekly, Monthly), Highs and Lows, Candlestick Patterns. Note: This indicator cannot be used in the Strategy Tester. The demo version here from the marke
Netsrac Correlation Trader
Carsten Pflug
4.73 (15)
Netsrac Correlation Trader(NCT)是一个非常强大的工具,可以用对冲订单交易正负相关的货币对。 1)它寻找正负相关的货币对 2) 如果相关货币对不平衡,它会向你显示一个信号 3) 它可以通过你设置的时间框架和信号值来 "自动交易 "一些或所有的相关货币对(小心处理) 4) 它可以设置正确的手数,以拥有点值和每日范围的最佳对冲交易 5)它可以成为你的单一工具来支持你的关联交易的自由裁量权 你可以为EA的信号使用任何时间框架。小的时间框架比大的时间框架需要更多的人工干预。从M30开始的时间框架更适合于自动交易。我将逐步增加更多的功能,支持手动和自动交易。 如果您有一些问题或建议--请随时联系我。请阅读我的博客文章( https://www.mql5.com/en/blogs/post/726866 ),了解本EA的设置! 请注意。本EA不能进行回测,而且!DEMO是无用的!因为它至少同时在两种资产中交易(对冲订单)。 如果你不知道,这个专家是否适合你--请利用廉价的测试月。你将不会后悔。或者,使用免费的DEMO,可以在这里找到( https://www
The Netsrac Correlation Trade Indicator (NCTI) was created to trade correlations between different assets. NCTI offers five different strategies to do this. Five different correlation trading strategies with two or three assets Fast access your assets with one click via asset buttons Your profit/loss at a glance Configurable alerts via screen or mobile You can use the indicator with every timeframe. Higher timeframes give fewer but better signals. If you have some questions or suggestions - ple
Netsrac PAAIOS
Carsten Pflug
5 (6)
PAAIOS 指 的 是 价格 一体化 解决。 而 这 正 是 该 指标 目的 它 应该 给 你 一 个 来 果断 地 改善 的 交易 可以 时间 框架 中 显示 趋势 "线、需求和供应区。 特点 * 检测多时间框架的供应和需求区 * 探测并显示多时间框架的趋势线 * 探测多个时间段的趋势行为--你可以一目了然地了解全貌 * 如果一个区域/趋势线接近价格,就会提醒你(屏幕、通知、邮件)。 * 使用智能算法,只计算强势的供应和需求区。 供应和需求 - 它是如何工作的 PAAIOS使用一个内部的人字形函数来计算多时间框架的人字形来获得波动。这没有什么特别的。但是PAAIOS测量的是所有的波动,只考虑真正显著的波动开始的区域。所以你可以从多个时间框架中得到真正强大的买方和卖方区域。 趋势线 - 它是如何工作的 Paaios 也 内部 zigzag 来 计算 趋势线。 这 什么 特别 的。 但是 , 如果 使用 较 高 时间 段 的 趋势线 并 供求 关系 结合 , 你 会 得到 真正 强势 的 指示 在 在 价格 价格 价格 价格 价格 价格 价格 价格 价格 价格 价格价格 价格 价
Netsrac "Supply and Demand Easy" is a small but highly specialized tool for quickly finding supply & demand zones without frills. It shows the next supply and demand zone in the current timeframe. Highly efficient and fast. Works perfectly with the Netsrac "Supply and Demand Dashboard" (https://www.mql5.com/en/market/product/96511 ) Controls Variable Description (SD01) Supply color Set your color for supply zones (default is LightCoral) (SD02) Demand color Set your color for demand zones (defau
The Netsrac Supply&Demand Dashboard shows you at a glance where relevant zones are located on your favorite assets. Open your chart directly from the dashboard and trade zones that really matter. Features Finds the next relevant supply and demand zone and displays the distance to this zone (in pips) Finds and displays the zones in three different timeframes Calculates a trend indicator for the current and past candle for each configured time frame Opens a chart with your chart template directly
The Netsrac Correlation Trade Indicator (NCTI) was created to trade correlations between different assets. NCTI offers five different strategies to do this. Five different correlation trading strategies with two or three assets Fast access your assets with one click via asset buttons Your profit/loss at a glance Configurable alerts via screen or mobile You can use the indicator with every timeframe. Higher timeframes give fewer but better signals. If you have some questions or suggestions - ple
The intention of the dashboard is to provide a quick overview of the daily, weekly and monthly range of configured assets. In "single asset mode" the dashboard shows you possible reversal points directly in the chart, thus making statistics directly tradable. If a configured threshold is exceeded, the dashboard can send a screen alert, a notification (to the mobile MT5) or an email.  There are various ways of using this information. One approach is that an asset that has completed nearly 100% o
With the SR Dashboard, you get a powerful tool to control some of the most important information in trading. Assemble a setup according to your strategy and get informed as soon as this setup is valid. Assign scores to defined conditions and let the Dashboard find them. Choose from Trend, Average Daily Range, RSI, Moving Averages, Pivot (Daily, Weekly, Monthly), Highs and Lows, Candlestick Patterns. What can you do with this tool? Use the dashboard as a powerful tool for your discretionary trad
THE flexible Expert Advisor for Custom Trading Strategies in MetaTrader 5 The Netsrac TradeAid expert is a powerful tool for traders looking to develop their own trading strategies in MetaTrader 5. With this expert advisor, you can combine a variety of technical indicators and trading rules with a simple "If This (AND This...) Then That" logic to create tailored trading strategies that match your individual preferences. You don´t need any knowledge in MQL5 coding language to build your own exper
筛选:
En Shahdi
294
En Shahdi 2025.10.07 15:18 
 

Netsrac ADR Dashboard by Carsten Pflug is truly one of the best indicators I’ve ever used. It’s extremely helpful for reading market range, identifying continuation or exhaustion zones, and aligns perfectly with my own trading system. Carsten Pflug is an outstanding developer — very fast to respond, professional, and always willing to share useful tips whenever I ask questions. Thank you so much for this powerful indicator — it has really helped me make clearer and more confident trading decisions every single day!

MP_mpap
633
MP_mpap 2025.06.29 19:52 
 

The most complete dashboard available. Anyone working with ADR will be 100% satisfied! Highly recommended!

wdbnz1
84
wdbnz1 2023.03.20 06:10 
 

A very good indicator, well-designed, and easy to use. Carsten responds to questions efficiently and is extremely helpful in clarifying the functionality of the Dashboard. I have been successfully live trading with the Dashboard for over a year and can highly recommend it. Good value for money!

lauro1956
5752
lauro1956 2022.01.06 12:41 
 

Very good board mr Pflug ... complete and clear

CasiousD
873
CasiousD 2021.11.16 20:15 
 

Best ADR indicator I have tried. Provides a ton of information that is almost entirely customizable, and all very useful. From determining the lookback periods individually for daily, weekly, and monthly ranges, previous day range and even a customized range of your own, to the customization of the lines drawn on the chart to represent each range, and the indications of how far away price is from the highs or lows of each range...this is such an in depth and valuable indicator. And the ability to use it as a dashboard with multiple instruments or just a single instrument on the current chart is great. Basically, you have unlimited flexibility with this indicator to pretty much set up this ADR indicator to suit whatever your trading style is.

Andrew Lee
2493
Andrew Lee 2020.10.20 23:48 
 

This ADR indicator is a brilliant. Love the dashboard view and the compact single currency option. The information is extremely well laid out and is a great asset to my trading tools. Support from Carsten is amazing - a small display issue I was experiencing was quickly resolved so 5+ stars for support if I could give it.

John Greydanus
603
John Greydanus 2020.08.28 05:31 
 

I totally agree with previous user comments = I am quite familiar with ADR indicators, and this is without a doubt the best and most powerful ADR indicator I have seen thus far. It takes a little time to learn how everything works, but the developer is very helpful to answer questions and to provide solutions if needed. I have complete confidence in this product and in the ability of the coder (Carsten) who created it. Highly recommended! And would like to add, not only most excellent as a Dashboard but also when applied to each individual chart. The price levels are great when in a trade, as daily and weekly target levels are clearly displayed, can't be beaten. I'll be buying for MT5 as well.

Ralph
230
Ralph 2020.08.17 04:45 
 

Phenomenal indicator, I highly recommend it!!

De Airelle
49
De Airelle 2020.05.28 03:55 
 

This is phenomenal!

Devonish
3253
Devonish 2020.04.21 13:19 
 

I think this is a very good tool, although it's taking a little time for me to understand the principles of how to apply this to my technical trading. Carsten is a very helpful developer who responds quickly. Update: Sept'20: New additions to the tool are very useful. Thank you for continued ongoing support and development.

Daniele Tosolini
294
Daniele Tosolini 2020.01.23 11:54 
 

Great dashboard!!! It still have some things to improve but it's a really good instrument I like it very much!!!

Carsten is also very helpful !!

cvdestyfx
2910
cvdestyfx 2020.01.22 17:56 
 

I am quite familiar with ADR indicators, and this is without a doubt the best and most powerful ADR indicator I have seen thus far.

It takes a little time to learn how everything works, but the developer is very helpful to answer questions and to provide solutions if needed.

I have complete confidence in this product and in the ability of the coder (Carsten) who created it. Highly recommended!

Ikechukwu Emmanuel Okaro
1003
Ikechukwu Emmanuel Okaro 2019.07.23 12:41 
 

This indicator is a must have for any serious trader. Welldone Carsten!

Arnel Arnao
2294
Arnel Arnao 2019.07.03 07:37 
 

Excellent Indicator. If you can add another column for the underlying trend short term and long term trend this will be a perfect indicator for level traders.

回复评论