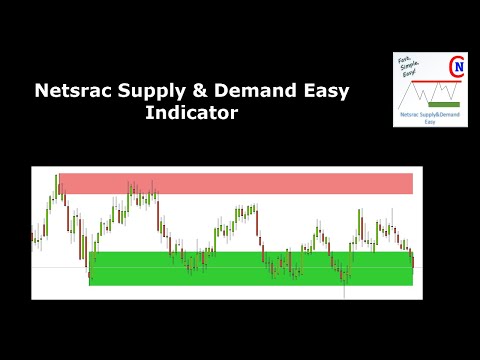
Netsrac Supply and Demand Easy

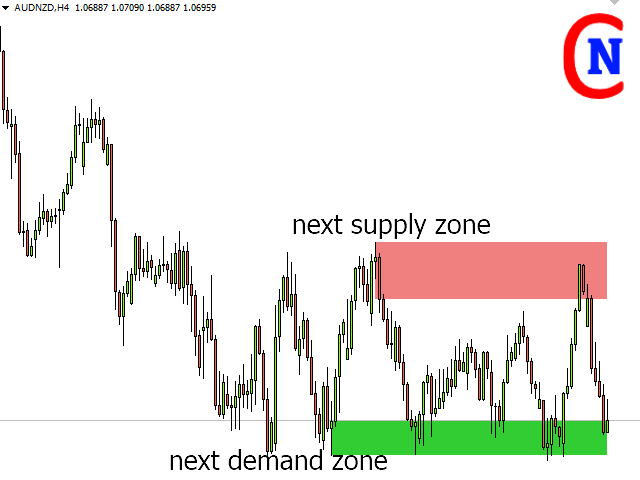
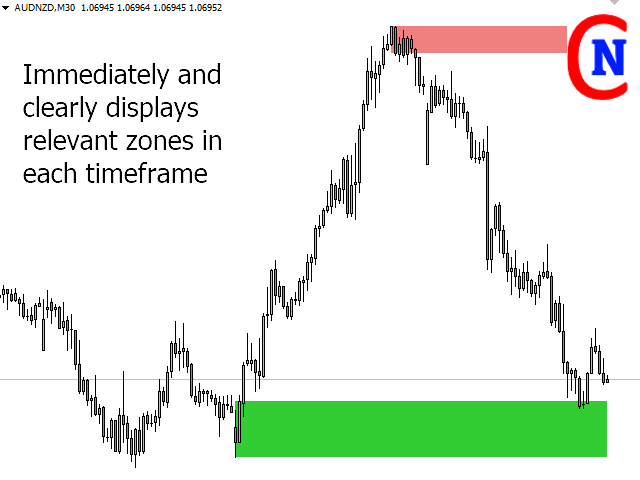
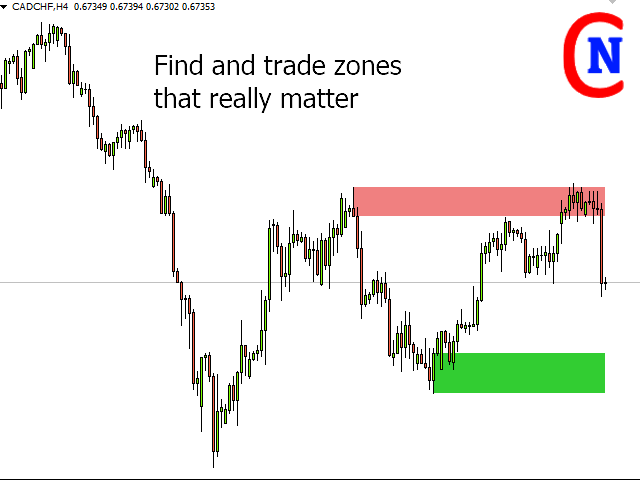
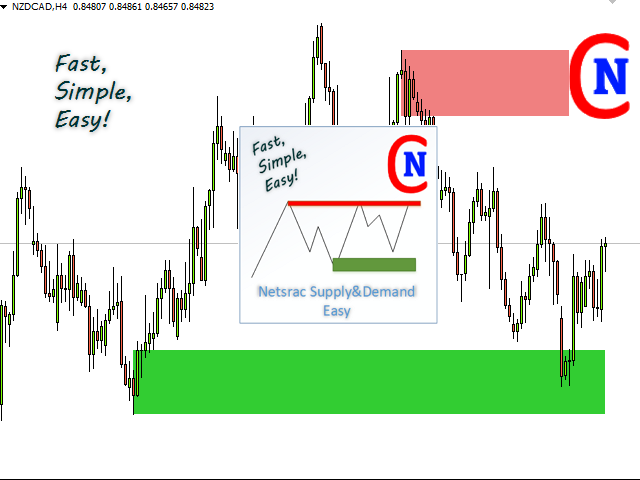
Netsrac "Supply and Demand Easy" is a small but highly specialized tool for quickly finding supply & demand zones without frills. It shows the next supply and demand zone in the current timeframe. Highly efficient and fast.

Works perfectly with the Netsrac "Supply and Demand Dashboard" (https://www.mql5.com/en/market/product/96511)
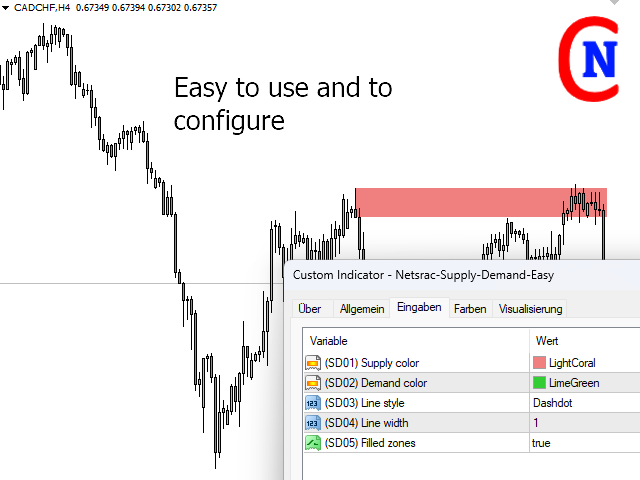
Controls

Variable Description
(SD01) Supply color Set your color for supply zones (default is LightCoral)
(SD02) Demand color Set your color for demand zones (default is LimeGreen)
(SD03) Line style If you want to show unfilled zones with a border, set the border style with that variable
(SD04) Line width If you have selected "solid" for line style, you can set the width of the line (1 - thin to 5 - thick)
(SD05) Filled zones True, if you want filled zones - otherwise false and set variables SD03/SD04
(SD06) Depth  Set the depth of the swing calculation algo (lower values produces more swings)

I wish you lot of success with this indicator!

Netsrac


推荐产品
MySNR - Precision Support & Resistance Line Indicator Discounted   Price   $50  !!     Secure your lifetime access   now   before it switches to   subscription-only ! Tired of drawing levels manually or guessing where the price will react inside a thick, messy zone? Now you can save time and trade with absolute confidence using the MySNR Indicator . Unlike traditional tools that plot broad and ambiguous zones, MySNR is engineered to automatically plot exact, pinpoint Support and Resistance lines
CRT Candle Range Theory HTF MT4.   Ultimate CRT Indicator: Advanced ICT Concepts and Malaysian SnR Trading System Discounted   Price   $50  !!     Secure your lifetime access   now   before it switches to   subscription-only ! Master the Market Maker's Footprints with the Most Advanced Candle Range Theory Indicator Unlock the true power of   Smart Money Concepts (SMC)   and trade precisely like the institutions with the   Ultimate CRT Indicator . Built exclusively for serious traders, this indic
这是一个预测蜡烛收盘价的指标。 该指标主要用于 D1 图表。 该指标适用于传统外汇交易和二元期权交易。 该指标可以用作独立的交易系统,也可以作为您现有交易系统的补充。 该指标分析当前蜡烛,计算蜡烛本身内部的某些强度因素,以及前一根蜡烛的参数。 因此,该指标预测市场走势的进一步方向和当前蜡烛的收盘价。 由于这种方法,该指标既适用于短期盘中交易,也适用于中长期交易。 该指标允许您设置指标在分析市场情况期间将产生的潜在信号的数量。 在指标设置中有一个特殊的参数。 此外,该指标可以通过图表上的消息、电子邮件以及推送通知的形式通知新信号。感谢您的关注!交易愉快! 购买后一定要写信给我! 我会给你我的交易指标的建议! 还可以获得奖金!
VR Cub
Vladimir Pastushak
VR Cub 这是获得高质量切入点的指标。该指标的开发是为了促进数学计算并简化对仓位入场点的搜索。多年来,该指标所针对的交易策略已被证明其有效性。交易策略的简单性是其巨大的优势,即使是新手交易者也能成功进行交易。 VR Cub 计算开仓点以及获利和止损目标水平,这显着提高了效率和易用性。查看使用以下策略进行交易的屏幕截图,了解简单的交易规则。 设置、设置文件、演示版本、说明、问题解决,可以从以下位置获取 [博客] 您可以在以下位置阅读或撰写评论 [关联] 版本为 [MetaTrader 5] 计算入场点的规则 开仓 要计算入场点,您需要将 VR Cub 工具从最后一个高点拉伸到最后一个低点。 如果第一个点在时间上早于第二个点,交易者等待柱线收于中线上方。 如果第一个点在时间上晚于第二个点,交易者等待柱线收于中线下方。 根据上述条件,严格在 柱线收盘 后建仓。 换句话说,如果我们在小时图上进行交易,那么从最高点到最低点的时间距离必须超过24小时,最高点和最低点之间的点数必须大于或等于平均价格变动每天。 维持和改变市场地位 可以有多个未平仓头寸;每个头寸都可以单独修改。 VR Cub
Infinity Trend Pro
Yaroslav Varankin
1 (1)
This is a trend indicator without redrawing Developed instead of the binary options strategy (by the color of the Martingale candlestick) Also works well in forex trading When to open trades (binary options) A signal will appear in the place with a candle signaling the current candle It is recommended to open a deal for one candle of the current timeframe M1 and M5 When a blue dot appears, open a deal up When a red dot appears, open a trade down. How to open trades on Forex. When a signal is rec
Max Ribbon
Stefano Frisetti
WARNING: This indicator is distributed EXCLUSIVELY on MQL5.com MT4 version:   https://www.mql5.com/it/market/product/160363 MT5 version:   https://www.mql5.com/it/market/product/160410 MAX RIBBON ver 1.00 The indicator that shows you the TREND clearly and unambiguously! DESCRIPTION MAX RIBBON is an advanced trend indicator that combines two ribbon systems to accurately identify market direction: • MaxRib2 (Fast Ribbon): Responsive to short-term movements, ideal for capturing rapid reversals an
True SnD
Indra Lukmana
5 (1)
This Supply & Demand indicator uses a unique price action detection to calculate and measures the supply & demand area. The indicator will ensure the area are fresh and have a significant low risk zone. Our Supply Demand indicator delivers functionality previously unavailable on any trading platform. Trading idea You may set pending orders along the supply & demand area. You may enter a trade directly upon price hit the specific area (after a rejection confirmed). Input parameters Signal - Set
FILH Index Pro MT4
Aiman Saeed Salem Dahbag
Indicator Description: The Advanced Force Index combines volume and price to determine the strength  of the trend. It has been developed to provide an accurate measurement of  seller and buyer power in the market, with multiple smoothing and display options. Key Features: Two display modes: Colored Histogram (bicolor) or Solid Line 4 Moving Average methods: SMA, EMA, SMMA, LWMA 7 Price types: Close, Open, High, Low, Median, Typical, Weighted Both volume types supported: Tick Volum
FREE
Matrixs
Andriy Sydoruk
Matrix is a Forex arrow indicator. Displays signals simply and clearly! The arrows show the direction of the transaction, and are colored accordingly, which can be seen in the screenshots. As you can see, trading with such an indicator is easy. I waited for an arrow to appear in the desired direction - I opened a deal. An arrow formed in the opposite direction - closed the deal. The indicator also displays the lines with the help of which the arrow signals are formed, taking into account the int
PipFinite Razor Scalper
Karlo Wilson Vendiola
4.4 (47)
Pipfinite creates unique, high quality and affordable trading tools. Our tools may or may not work for you, so we strongly suggest to try the Demo Version for MT4 first. Please test the indicator prior to purchasing to determine if it works for you. We want your good reviews, so hurry up and test it for free...we hope you will find it useful. Combo Razor Scalper with Trend Laser Strategy: Scalp in the direction of the trend Watch Video: (Click Here) Features Scalping indicator using a confirme
Magic Pivot
Evgeny Belyaev
Magic Pivot is a professional indicator for finding the support and resistance lines; it has been developed by a group of professional traders. The indicator plots three support lines and three resistance lines, where a price reversal is highly probable. Magic Pivot is an excellent tool for scalping and intraday trading.   Advantages High accuracy of signals. Suitable for scalping and intraday trading. The indicator does not redraw. Simple indicator setup, minimum parameters. Works on any financ
Trends Finder
Oleksii Ferbei
"Trend Finder" is a trend trading strategy that combines market noise filtration and all necessary functions in one tool! The system automatically displays entry and exit points using arrows. Only one parameter is sufficient for configuration. It offers simple, intuitively understandable, and effective trend detection. The intelligent algorithm of the "Trend Finder" indicator identifies potential market reversal points. Often, a good trend can be visually observed on the price chart. However, a
Trendiness Index
Libertas LLC
5 (3)
"The trend is your friend" is one of the best known sayings in investing, because capturing large trendy price movements can be extremely profitable. However, trading with the trend is often easier said than done, because many indicators are based on price reversals not trends. These aren't very effective at identifying trendy periods, or predicting whether trends will continue. We developed the Trendiness Index to help address this problem by indicating the strength and direction of price trend
Multi Pivot Indicator - Professional Trading Tool MULTI PIVOT PRO INDICATOR Professional Multi Pivot Indicator for MT4 5-in-1 Pivot Indicator Professional Trading Tool for MetaTrader 4 ENGLISH TÜRKÇE Multi Pivot Indicator PRO Classic Fibonacci Camarilla Woodie DM What is Multi Pivot Indicator? Multi Pivot Indicator is a professional trading tool that displays 5 different pivot calculation methods on your MetaTrader 4 charts. Pivot points are critical support and resistance
Stepline MTF SNR
Mohamad Faizul Bin Mohd Haris
Stepline MTF SNR with Heiken Ashi Stepline MTF SNR is a sophisticated technical analysis tool for MetaTrader 4 that combines Multi-Timeframe (MTF) Support and Resistance levels with a built-in Heiken Ashi smoothing filter. This indicator is designed for traders who require a clear, bird's-eye view of market structure across multiple horizons without leaving their current chart.  Combines 4 timeframe SNR levels (SBR/RBS) with built-in Heiken Ashi filtering for cleaner, more accurate signals – e
Quant Direction
Georgios Kalomoiropoulos
Quant Direction 是一款三维市场分析工具。它通过同时计算多个维度上的精确百分比偏差,提供完全客观的、基于算法的市场分析视角。该算法采用先进的人工智能建模工具开发,并经过全面测试,旨在以独特的精准度解读市场。它可以分析您平台上的任何货币对或金融工具。 无论您是短线 交易者、日内 交易者还是波段交易者,Quant Direction 都是您的理想之选。 交易者的真正优势 Quant Direction 的真正优势在于彻底消除情绪、屏幕疲劳和过度思考。它无需手动点击十几个图表来寻找方向并反复质疑自己的偏好,引擎即可在几毫秒内即时处理 8 个时间周期(从 5 个月到月线)。它能准确告诉你任何时刻谁在掌控市场,确保你始终朝着概率最高的方向进行交易。 市场分析的三个维度 该算法将市场分为三个不同的交易维度,为您提供完整的宏观和微观视角: 超短线交易分析: 捕捉即时、快速的动量变化和较低时间框架的执行点。 日内分析: 识别真实的、潜在的每日方向性偏差。 波动分析: 专注于宏观趋势,确保您不会与大盘机构的走势背道而驰。 独家评分引擎 Quant Direction 的底层采用了一套
This indicator is another variant of the famous powerful indicator Fibonacci-SS https://www.mql5.com/en/market/product/10136 but has different behaviour in placing Pending Order and TP Line. Automatically places Fibonacci retracement lines from the last highest and lowest visible bars on the chart with: An auto Pending Order (Buy/Sell). Taking Profit 1, Taking Profit 2 is pivot point and Taking Profit 3 for extended reward opportunity. The best risk and reward ratio. Simple and powerful indicat
The indicator will help you find support and resistance levels, increase the number of confirmations for stronger levels. This is not a multi-timeframe indicator that refers to the information from other timeframes. But it allows to show strong levels of support and resistance where the price respects a mark two or more times. How to trade: For smaller timeframes up to M30 I recommend at least 3 confirmations. This filters stronger levels with subsequent strong movements. For larger timeframes o
Next level of trend trading here. Possibility 75%, the indicator analyzes the current market to determine short (small dot), middle (circle with a dot inside) and long (cross with a circle and a dot inside) trends.  Wingdings characters of  Aqua color represents the beginning of the UP trend. Wingdings characters of  Orange color represents the beginning of the DOWN trend. Possibility 75% Indicator will improve your trading in the world of forex, commodities, cryptocurrencies and indices.
Szia! Egy indikátorral. Több idő gyertyájának kirajzoltatása egy charton. Különböző színek rendelhetők a long és short gyertyákhoz. Vonal vastagsága állítható. A gyertya kitöltése engedélyezhető. Hello! With an indicator. Drawing multiple time candles on a chart. Different colors can be ordered for long and short candles. Line thickness can be adjusted. Filling the candle can be allowed. Videó: https://www.youtube.com/watch?v=-9bequnAw-g&amp ;ab_channel=GyulaKlein
Kangaroo Tailz
Brenden Caleb Luebeck
Looking for an indicator that identifies high-probability price action patterns? Love counter-trend trading? The Kangaroo Tailz indicator might be just for you. This indicator is meant to be used as a reversal detector. I personally would rather enter a position at the beginning of a trend rather than catch the last couple of moves. This indicator does a good job of alerting when price may reverse by identifying price action patterns that occur frequently in markets. Even though this indicator i
RTSPattern
Tomas Belak
The indicator provides a superior alternative to price action analysis. It enables the identification of normalized patterns, which are then transformed into a graphical representation to forecast future steps within a time series. In the top-left corner, you'll find information regarding the expected prediction accuracy, determined through a complex MSQE calculation. You have the flexibility to adjust the time window, making it easy to validate the indicator's performance. Additionally, you can
FXC iMACD-DivergencE MT4 Indicator This is an advanced MACD indicator that finds trend-turn divergences on the current symbol. The indicator detects divergence between the MACD and the price movements as a strong trend-turn pattern. Main features: Advanced divergence settings Price based on Close, Open or High/Low prices Give Buy/Sell open signals PUSH notifications E-mail sending Pop-up alert Customizeable Information panel Input parameters: MACD Fast-EMA: The Fast-EMA variable of the MACD indi
SMC Venom 模型 BPR 指標是針對在智慧貨幣 (SMC) 概念內工作的交易者的專業工具。它會自動辨識價格圖表上的兩種關鍵模式: FVG (公平價值缺口)是三根蠟燭的組合,其中第一根和第三根蠟燭之間存在缺口。它在水平之間形成一個沒有成交量支撐的區域,這通常會導致價格調整。 BPR (平衡價格區間)是兩種 FVG 模式的組合,形成一個「橋樑」 - 當價格以低成交量活動移動時,突破並返回到水平的區域,從而在蠟燭之間產生間隙。 這些模式可協助交易者透過分析圖表上的交易量和價格動態(大型市場參與者和普通參與者之間的互動)來識別關鍵的支撐/阻力位、突破區域和切入點。 此指標以矩形和箭頭的形式可視化模式,也支援靈活的警報設定。 主要特點: 模式顯示模式:選擇顯示 BPR 模式(看漲和看跌)或 FVG 模式(看漲和看跌)。 可以隱藏所有圖表分析模式。 以條數過濾:BPR 結構中 FVG 之間的最小/最大距離。 訊號的附加視覺化: 箭頭有 9 種類型可供選擇(標準、細、分形等)或手動輸入 Wingdings 代碼,其表格可以選擇性地顯示在圖表上。 使用 ATR 配置顏色、尺寸及其相對於價格
FXC iDeM-DivergencE MT4 Indicator This is an advanced DeMarker indicator that finds trend-turn divergences on the current symbol. The indicator detects divergence between the DeMarker and the price movements as a strong trend-turn pattern. Main features: Advanced divergence settings Price based on Close, Open or High/Low prices Give Buy/Sell open signals PUSH notifications E-mail sending Pop-up alert Customizeable Information panel Input parameters: DeM Period: The Period size of the DeMarker in
Smart Reversal Oscillator Pro
Atventius Bayu Riswanto
## Smart Reversal Oscillator Pro Smart Reversal Oscillator Pro is an advanced hybrid trading utility designed for MetaTrader 4 that reinvents volatility and momentum analysis. Instead of analyzing raw price action, this indicator applies mathematical Bollinger Bands directly onto the Relative Strength Index (RSI) array data within a separate sub-window. Standard fixed oversold and overbought levels (like 30 and 70) often fail during strong market expansions. This professional oscillator solve
Gann Square of 144
Taras Slobodyanik
5 (6)
江恩箱(或江恩方)是一种基于 W.D. Gann 的“市场预测的数学公式”文章的市场分析方法。 该指标可以绘制三种正方形模型:90、52(104)、144。有六种网格变体和两种弧形变体。 您可以在一张图表上同时绘制多个方块 参数 Square — 江恩方格模型的选择: 90 — 90 的平方(或 9 的平方); 52 (104) — 52(或 104)的平方; 144 — 144的万能平方; 144 (full) — 正方形的“完整”版本,结合了其他正方形的线条。 据我们所知,W.D.江恩并没有这样的加价; for Arcs — 圆弧的简化正方形; Grid — 网格的变体: 4x4 (52) — 4 x 4 网格,52 个标记; 5x5 (40); 8x8 (90); 8x8 (104); 8x8 (144); 16x16 (144); 36x36 (144); disable — 禁用网格; Arcs — 弧线的变体: 4x4; 5x5; disable — 禁用弧; 开始时的方形参数: Length of Square, Bars (X-axis) — 正方形的长度(以条为
FW 2WPR MTF
Sergey Zhukov
Indicator based trading according to the price analysis of bars, the most popular among traders. The indicators calculated based on larger periods are used for identification of a stable trend on the market, and the ones calculated based on smaller periods are used for entering the market after a correction. The oscillators with overbought and oversold levels have a special place in indicator-based trading. The values of such indicators are subjected to wave structure - the higher waves (chart t
Auto Fibo Pro m
DMITRII GRIDASOV
“Auto FIBO Pro” Crypto_Forex 指标 - 是交易中的绝佳辅助工具! - 指标自动计算并放置在图表斐波那契水平和局部趋势线(红色)上。 - 斐波那契水平指示价格可能反转的关键区域。 - 最重要的水平是 23.6%、38.2%、50% 和 61.8%。 - 您可以将其用于反转剥头皮或区域网格交易。 - 还有很多机会可以使用 Auto FIBO Pro 指标来改进您当前的系统。 - 它具有信息价差掉期显示 - 它显示所连接的外汇对的当前价差和掉期。 - 显示屏还显示账户余额、净值和保证金。 - 可以将信息价差掉期显示定位在图表的任何角落 . 点击这里查看高质量的交易机器人和指标! 这是仅在此 MQL5 网站上提供的原创产品。 ...............................................
SRP Pro
Farhad Kia
5 (1)
Strong Retracement Points Pro edition! SRP (Strong Retracement/Reversal Points) is a powerful and unique support and resistance indicator. It displays the closest important levels which we expect the price retracement/reversal! If all level are broken from one side, it recalculates and draws new support and resistance levels, so the levels might be valid for several days depending on the market! If you are still hesitating to start using this wonderful tool, you can check this link to see how ef
该产品的买家也购买
Neuro Poseidon MT4
Daria Rezueva
4.94 (32)
Neuro Poseidon is a new indicator by Daria Rezueva. It combines precise trading signals with adaptive TP/SL levels - creating best possible trades as a result! Message me and get  Neuro Poseidon Assistant  as a gift to automize your trading process! What makes it stand out? 1. Proven profitability on all assets and timeframes 2. Only confirmed BUY and SELL signals present on the chart 3. Adaptive TP & SL levels generated by the software for each trade 4. Easy to understand - suitable for all
Gann Made Easy
Oleg Rodin
4.84 (165)
Gann Made Easy 是一个专业且易于使用的外汇交易系统,它基于使用先生理论的最佳交易原则。 W.D.江恩。该指标提供准确的买入和卖出信号,包括止损和获利水平。您甚至可以使用推送通知在旅途中进行交易。 购买后请联系我,即可免费获得交易指导和超棒的额外指标! 您可能已经多次听说过江恩交易方法。通常 Gann 的理论不仅对于新手交易者而且对于那些已经有一定交易经验的人来说都是非常复杂的东西。这是因为江恩的交易方法在理论上并不那么容易应用。我花了几年时间来完善这些知识,并将最好的原则应用到我的外汇指标中。 该指标非常易于应用。您所需要的只是将其附加到您的图表并遵循简单的交易建议。该指标不断进行市场分析工作并寻找交易机会。当它检测到一个好的入口点时,它会为您提供一个箭头信号。该指标还显示止损和获利水平。 换句话说,当您像先生一样进行交易时,该指标会为您提供最佳江恩建议。江恩亲自告诉你此时此刻该做什么。但最好的部分是您不需要了解任何有关江恩交易原则的知识,因为该指标会为您完成整个市场分析工作。
M1 Sniper
Oleg Rodin
5 (24)
M1 SNIPER 是一款易于使用的交易指标系统。它是一个专为 M1 时间框架设计的箭头指标。该指标可以作为独立的系统在 M1 时间框架下进行剥头皮交易,也可以作为您现有交易系统的一部分使用。虽然该交易系统专为 M1 时间框架交易而设计,但它也可以用于其他时间框架。我最初设计此方法是为了交易 XAUUSD 和 BTCUSD。但我发现这种方法在其他市场交易中也同样有用。 指标信号既可以顺势交易,也可以逆势交易。我教授一种特殊的交易技巧,帮助您利用指标信号进行双向交易。该方法基于使用特殊的动态支撑位和阻力位区域。 购买后,您可以立即下载 M1 SNIPER 箭头指标。此外,我还为所有 M1 SNIPER 工具用户免费提供下方屏幕截图所示的 Apollo Dynamic SR 指标!这两个指标的组合可以帮助您更轻松、更准确地利用 M1 时间框架进行交易。 购买后请联系我,免费获取交易提示和奖励指标! 祝您交易成功!
Dynamic Forex28 Navigator
Bernhard Schweigert
4.43 (7)
Dynamic Forex28 Navigator - 下一代外汇交易工具。 当前 49% 折扣。 Dynamic Forex28 Navigator 是我们长期流行的指标的演变,将三种功能合二为一: 高级货币强度 28 指标 (695 条评论)+ 高级货币 IMPULSE 带警报 (520 条评论)+ CS28 组合信号(奖励)。 有关指标的详细信息 https://www.mql5.com/en/blogs/post/758844 下一代强度指标提供什么? 您喜欢的原始指标的一切,现在通过新功能和更高的精度进行了增强。 主要特点: 专有货币强度公式。  所有时间范围内的平滑和准确的强度线。 非常适合识别趋势和精确进入。 动态市场斐波那契水平(市场斐波那契)。  此指标独有的独特功能。 斐波那契应用于货币强度,而不是价格图表。 适应实时市场活动以获得准确的反转区域。 实时市场动量。  第 9 行显示市场是活跃还是被动。 对于定时交易至关重要。 全面的警报和显示。  每种货币最强的买入和卖出动量。 ​​28 对的双重动量买入和卖出。 超买/超卖警告外部范围和止损。 反转
Trend Catcher ind
Ramil Minniakhmetov
5 (2)
趨勢捕捉指標 趨勢捕捉指標結合了作者獨有的客製化自適應趨勢分析指標,用於分析市場價格趨勢。它透過過濾掉短期噪音,並專注於潛在的動能強度、波動性擴張和價格結構行為,來識別真實的市場方向。此外,它還結合了平滑和趨勢過濾等客製化指標,例如移動平均線、相對強弱指標 (RSI) 和波動率過濾器。 您可以在這裡查看實際運行情況以及我的其他產品: https://www.mql5.com/en/users/mechanic/seller 請注意,我不會在 Telegram 上出售 EA 或任何設置,那是騙局。所有設定都可以在我的部落格上免費取得。 重要提示!購買後請立即聯繫我,以獲取使用說明和額外獎勵! 請注意,我不會在 Telegram 上出售 EA 或任何設置,那是騙局。所有設定都可以在我的部落格上免費取得。
本指标是实践实战交易完善的波浪自动分析的指标 !  案例... 注: 波浪分级用西方叫法不习惯,因受到缠论(缠中说禅)命名方式习惯的影响,我是将基础波浪命名为 笔 ,将二级波段命名为 段 ,同时具有趋势方向的段命名为 主趋段 (以后笔记中都是这种命名方式,先告知大家),但是算法上和缠论关系不大切勿混淆.反映的是本人分析盘面总结的 千变万化纷繁复杂的运行规律 . 对波段进行了标准化定义,不再是不同人不同的浪  ,   对人为干扰的画法进行了排除,在严格分析进场起到了关键的作用 . 使用这个指标,等于将交易界面提升美感,抛弃最原始的K线交易带你进入新的交易层次.如果不是为了交易,在宣传上也将使客户观感提升层次. 指标内容: 1. 基础波浪 (笔) : 首先我们找出了价格波动过程中的基础波动拐点,当然他的有序性低,为下一步的计算提供基础. 2. 二级波段( 段 ) :在基础波浪的基础上,通过算法分析得到层级更明显的二级波段,二级波段为波浪提供了分析基础 3. 波浪( 浪 ): 有着更清晰的趋势,更清晰直观的方向.分析一个波浪是否延续,需要看二级波段的形态,分析二级的构成,可以得出波浪后
KT Alpha Hunter Arrows MT4
KEENBASE SOFTWARE SOLUTIONS
大多数箭头指标只给你一个信号,然后把剩下的判断全部留给你自己。KT Alpha Hunter Arrows 给你的,是一套完整的交易计划。 每一个信号箭头出现时,图表上都会同时绘制完整计划:入场线、止损位、四个止盈目标,以及实时 Edge 结论,告诉你当前品种和时间周期是否值得交易。套装中还包含 Trade Manager EA,在你手动入场后负责后续执行,让你在市场波动和情绪干扰下依然保持纪律。非重绘。只在K线收盘后给出信号。适用于 Forex、黄金、指数,以及你交易的其他任何品种。 核心功能 非重绘买入和卖出箭头,只在K线收盘后出现。 每个信号都带有入场线、结构性止损和四个止盈目标。 Edge Dashboard 会分别评估当前图表上的买入和卖出机会。 结论系统:No Edge、Marginal、Tradeable、Good 或 Strong。 一键 Auto Optimize 按钮,可根据当前品种和时间周期自动调整设置。 完整套装包含 Trade Manager EA,并内置五种专为本指标设计的交易管理方案。 Prop Firm Risk Panel 可在图表上实时追踪日内回撤
Scalper Inside PRO
Alexey Minkov
4.74 (68)
Scalper Inside PRO Scalper Inside PRO 是一款适用于 MetaTrader 4 的日内趋势与剥头皮指标,使用专有算法快速识别市场方向和关键目标价位。它能够自动计算进场价、出场价以及多级止盈目标,并显示详细的绩效统计,让您了解不同交易品种和策略以往的表现情况,从而帮助您为当前的市场环境选择最合适的交易工具。此外,您还可以将自己的箭头指标轻松接入 Scalper Inside PRO,快速评估其统计数据和历史表现。 该指标可用于任何交易品种和任何周期(建议在 M5 上进行日内交易),并内置多种交易策略,因此既可以作为独立的剥头皮工具使用,也可以作为您交易系统中功能强大的分析组件。 主要功能 通过专有算法(Next‑Generation Trend Detection Algorithm,NG TDA)快速识别当前市场趋势。 自动计算日内交易的进场价、出场价和多级止盈目标。 内置策略与统计模块,用于评估不同市场环境下各品种的表现。 支持接入自定义箭头指标(PRO 模式),并计算其详细信号统计数据。 适用于外汇、金属、指数、股票、商品、期货和加密货币等各类市
Advanced Supply Demand
Bernhard Schweigert
4.91 (300)
现在优惠 40%! 任何新手或专业交易者的最佳解决方案! 该指标是一款独特、高质量、且价格合理的交易工具,因为我们已经整合了许多专有功能和新公式。 依据此更新,您将能够显示双重时间帧区域。 您不仅可以显示一个较高的时间帧,还可以同时显示图表时间帧,加上更高的时间帧:显示嵌套时区。 供需双方所有交易者都会喜欢它。 :) 重要信息披露 高级供需的最大潜力,请访问 https://www.mql5.com/zh/blogs/post/720245   想象您的交易如何得以改善,是因为您能够精准定位入场或目标位吗? 构建于新的底层算法,它可以更轻松地识别出买卖双方之间的潜在失衡。 这是因为它以图形方式展示供需最强劲区域,及其过去的表现(显示旧区域)。 这些功能旨在帮助您更轻松地发现最佳入场区域和价位。 现在您可以针对您的交易品种和时间帧来优化和编辑区域强度! 高级供需指标适用于所有产品和时间帧。 它是一个新的公式,非常新的功能是两个区域强度函数可由用户输入进行调整! 这在交易中是一大优势。 当您学习如何使用专有功能,例如带有价格游离最小 X 因子的区域强度时,您能够判断该区域强劲与否。 供需
PRO Renko System
Oleg Rodin
5 (30)
PRO Renko Arrow Based System for trading renko charts.  准确的信号交易任何外汇工具. 另外,我将免费提供系统的附加模块! PRO Renko系统是RENKO图表上高度准确的交易系统。该系统是通用的。 该交易系统可应用于各种交易工具。 该系统有效地中和了所谓的市场噪音,打开了获得准确反转信号的通道。 该指标易于使用,只有一个参数负责产生信号。 您可以很容易地使算法适应您感兴趣的交易工具和renko酒吧的大小。 我很乐意通过提供任何咨询支持来帮助所有客户有效地使用该指标。 祝您交易成功!购买后,立即写信给我! 我将与您分享我的建议和我的renko发电机。 另外,我将免费提供系统的附加模块!
Current event:  https://c.mql5.com/1/326/A2SR2025_NoMusic.gif A. 什么是 A2SR ?   * 这是一个领先的技术指标(没有重绘,没有滞后)。  -  指导 : -- 在  https://www.mql5.com/en/blogs/post/734748/page4#comment_16532516 -- 和  https://www.mql5.com/en/users/yohana/blog A2SR 在确定支撑(需求)和阻力(供应)水平方面有一种特殊的技术。 与我们在网上看到的普通方式不同,A2SR 在确定实际 SR 级别时有一个独创的概念。 原技术不是从网上拿来的,也没有在网上公开过。 A2SR 将根据您的交易风格自动选择 SR 级别。 即使您正在更改时间范围,但 SR 级别仍将保留在其位置上。 因为实际的 SR 不是从你使用的时间范围内获得的。 A2SR 拥有完整的交易工具 。 实际支持(需求)和阻力(供应)的真正概念。 新闻事件和央行讲话的市场情绪。 新闻事件和趋势的主要货币强度 (MCS) 的真正概念
MetaBands M4
Vahidreza Heidar Gholami
3.5 (6)
MetaBands使用强大且独特的算法绘制通道并检测趋势,以便为交易者提供进出交易的潜在点。它是一个通道指标和强大的趋势指标。它包括不同类型的通道,可以通过使用输入参数简单地合并以创建新通道。MetaBands使用所有类型的警报通知用户市场事件。 功能 支持大多数通道算法 强大的趋势检测算法 能够合并不同类型的通道 多时间帧和多货币(信号矩阵) 所有类型的警报功能(声音、屏幕闪烁、推送通知、电子邮件、弹出窗口、箭头) 它永远不会重绘 趋势检测 MetaBands使用在通道内振荡的蓝色线来检测趋势。当该线遇到通道的上界时,表明开始下跌趋势,当它遇到下界时,表明开始上涨趋势。如果蓝线接近中线,则市场处于整理期。 该指标使用独特的方法来检测趋势。一开始可能看起来有些复杂,但如果您观看视频教程,您就会意识到它是多么强大且易于使用。 入场和出场信号 当趋势变化或价格穿过上下通道时,MetaBands会立即通过不同的方法提醒交易者,这些方法可以在指标设置中启用。 信号矩阵 要监视来自不同时间框架的多个符号并在一个地方查看信号,请单击右上角按钮或按键盘上的M键以打开信号矩阵。该矩阵可以快速概览
Genesis Matrix Pro is a professional multi-timeframe trend detection indicator designed to help traders identify high-quality market alignment with clarity and structure. It combines 12 different technical indicators into one visual alignment matrix, allowing traders to quickly see when market conditions are bullish, bearish, or neutral. A signal is generated only when the selected strategies are aligned, helping reduce noise and improve decision-making. PLEASE CONTACT ME AFTER PURCHASE TO GET
本产品已针对 2026 年市场进行更新,并针对最新 MT5 版本进行了优化。 价格更新通知: Smart Trend Trading System 目前价格为 $99 。 接下来的 30 次购买 后,价格将上涨至 $199 。 特别优惠: 购买 Smart Trend Trading System 后,请发送私信给我,即可免费领取 Smart Universal EA ,并将您的 Smart Trend 信号转换为自动交易。 Smart Trend Trading System 是一套完整的交易系统,具备不重绘、不回绘、不延迟的特点,专为希望获得更清晰信号、更准确趋势方向以及更有组织交易方式的交易者打造。 Online course , manual and download presets . 它将 10 多种交易工具 整合到一个系统中,包括趋势检测、反转区域、Smart Cloud、移动止损逻辑、支撑与阻力、K线着色、提醒以及多周期分析。 该系统旨在帮助您应对不同的市场环境: 趋势市场: 识别主要趋势,发现回调,跟随动能,并通过止损指导和移动止损选项寻找更清晰的入场机会。 震荡
Breakout Arrows Mt4
Michael Oko Oboh
5 (1)
Trend Breakout Arrows Indicator The Trend Breakout Arrows Indicator is a momentum-based signal tool designed to identify potential bullish and bearish breakout opportunities. It displays clear arrow signals directly on the price chart, helping traders quickly recognize possible trend changes and continuation setups. Up Arrow (Buy Signal) A magenta up arrow appears below a candle when bullish momentum begins to strengthen. This signal indicates that buying pressure may be overtaking selling press
IQ FX Gann Levels
INTRAQUOTES
5 (2)
IQ FX Gann Levels a precision trading indicator based on W.D. Gann’s square root methods . It plots real-time, non-repainting support and resistance levels to help traders confidently spot intraday and scalping opportunities with high accuracy. William Delbert Gann (W.D. Gann) was an exceptional market analyst, whose trading technique was based on a complex blend of mathematics, geometry, astrology, and ancient mathematics which proved to be extremely accurate. Setup & Guide:  Download  MT5 Ver
PZ Swing Trading
PZ TRADING SLU
5 (3)
Swing Trading 是第一个旨在检测趋势方向的波动和可能的反转波动的指标。它使用在交易文献中广泛描述的基准摆动交易方法。该指标研究多个价格和时间向量,以追踪总体趋势方向,并检测市场超卖或超买并准备好进行修正的情况。 [ 安装指南 | 更新指南 | 故障排除 | 常见问题 | 所有产品 ] 市场波动的利润不会被窃取 指示器始终显示趋势方向 彩色价格带代表机会基准 彩色虚线表示可能的反转波动 该指标分析其自身的质量和性能 它实现了一个多时间仪表板 可定制的趋势和波动周期 它实现了电子邮件/声音/推送警报 指示器为非重涂或重涂 什么是摇摆交易 摇摆交易是一种尝试在一天到一周内从证券中获得收益的交易方式,尽管某些交易最终可以保持更长的寿命。摇摆交易者使用技术分析来买入弱点和卖出力量,并有耐心等待这些机会的发生,因为在发生一波抛售浪潮之后购买证券而不是陷入抛售更有意义。 机会基准 关于历史数据的大量研究证明,适合于波动交易的市场倾向于在基线价格带上下交易,基线价格带由图表显示,使用平均真实区间计算得出。波动交易者使用基线,该策略是购买常态和卖出躁狂,或做空常态并掩盖沮丧。在没有疲
Scalper Vault
Oleg Rodin
5 (37)
Scalper Vault 是一个专业的剥头皮系统,为您提供成功剥头皮所需的一切。该指标是一个完整的交易系统,可供外汇和二元期权交易者使用。推荐的时间范围是 M5。 该系统为您提供趋势方向的准确箭头信号。它还为您提供顶部和底部信号以及江恩市场水平。无论您拥有何种交易经验,该系统都易于使用。您只需要遵循简单的规则并每天重复该过程。 建议将此系统用于主要货币对。感谢您的关注! 请注意,该指标在策略测试器中可能无法正常工作。因此,我建议仅在模拟或真实账户的真实交易条件下使用该系统。 指示器提供所有类型的警报,包括推送通知。 购买指标后请与我联系。我将免费与您分享我的个人交易建议和出色的奖励指标! 祝您交易愉快,盈利!
Neo Wave PRO
Nikolay Raykov
5 (1)
Price & Time Market Structure Indicator A professional market structure tool that analyzes waves through both price and time — not price alone. Main Description NeoWave PRO is a professional market structure indicator for MetaTrader 4 designed for traders who want to move beyond traditional one-dimensional wave tools such as ZigZag, swing indicators, and basic high/low systems. Most wave indicators analyze only one thing: Price. But a real market wave is not only a price movement. A true wave de
GOLD Impulse with Alert
Bernhard Schweigert
4.67 (12)
这个指标是我们2个产品 Advanced Currency IMPULSE with ALERT  +   Currency Strength Exotics 的一个超级组合。 它适用于所有时间框架,并以图形方式显示8种主要货币和一种符号的强势或弱势冲动! 该指标专门用于显示任何符号的货币强度加速,如黄金、异国货币对、商品、指数或期货。这是它的第一个指标,任何符号都可以被添加到第9行,以显示黄金、白银、石油、DAX、US30、MXN、TRY、CNH等的真实货币强度加速(冲动或速度)。 建立在新的基础算法上,它使识别和确认潜在的交易更加容易。这是因为它以图形方式显示了一种货币的强势或弱势是否正在加速,并测量了这种加速的速度--把它想象成你汽车中的速度表。当你加速时,事情显然会发生得更快,这在外汇市场上也是一样的,即如果你配对的货币正在向相反的方向加速,你就会发现一个潜在的有利可图的交易。 动态市场斐波那契28水平被用作警报触发器,将适应市场活动。如果冲动击中黄色触发线,你将收到警报。然后你就知道作为一个交易员应该做什么。货币对和方向已经给出。只需点击警报按钮,就可以切换到该货
Market Structure Order Block Dashboard MT4 是一款 MetaTrader 4 指标, 专为希望直接在图表上解读市场结构和主要价格反应区域的交易者设计。它结合了 BOS、ChoCH、Order Blocks、Fair Value Gaps (FVG)、流动性、Kill Zones、Volume Profile 和紧凑的仪表盘, 便于快速分析。 本指标面向使用市场结构、ICT 和 Smart Money 概念作为决策框架的交易者。它有助于以更结构化的方式识别趋势延续、可能的反转、价格不平衡、流动性目标和关注区域。 买家专属资源 购买后通过 MQL5 私信即可获取完整的 PDF 用户指南和参数设置建议。通过 MQL5 私信提供直接技术支持。 此 MT4 版本涵盖 MT5 1.20 版本的全部功能: Pending BOS / Pending ChoCH 检测 、 可拖动仪表盘 (按住标题栏可将面板拖到图表任意位置)、 多周期面板 、 Order Block 绩效统计 和 自动风险回报区 。Pending Breaks 在 K 线收盘越过前一摆动点的瞬
Dynamic Scalper System
Vitalyi Belyh
5 (1)
“ Dynamic Scalper System ”指标专为在趋势波内进行剥头皮交易而设计。 已在主要货币对和黄金上进行测试,并可与其他交易工具兼容。 提供顺势短线建仓信号,并提供额外的价格变动支持。 指标原理: 大箭头决定趋势方向。 在趋势波内,我们采用一种生成小箭头形式的剥头皮交易信号的算法。 红色箭头代表看涨方向,蓝色箭头代表看跌方向。 敏感的价格变动线会沿着趋势方向绘制,并与小箭头信号协同作用。 信号运作方式如下:当线在适当时刻出现时,将形成入场信号;在出现线时,持仓;线完成后,平仓。 建议的操作时间范围为M1 - H4。 箭头在当前K线上方形成,如果下一根K线已开仓,则不会重新绘制上一根K线上方的箭头。 输入参数 Trend Wave Period - 趋势方向(大箭头)的周期,改变趋势波的时间间隔。值 1 表示趋势方向的最长持续时间,参数值越大,持续时间越短。 Scalper Arrows Period - 信号箭头(小箭头)的计算周期,改变入场信号的生成频率。值 3 表示最频繁的生成频率,参数值越大,箭头频率越低,准确度越高。 这些参数可以根据不同的时间范
另有 MT5 版本可供选择 https://www.mql5.com/zh/market/product/170916 M30/H1/H4 波段版已上线 想抓住M5/M15无法捕捉的大行情? Gold Signal Swing Pro(M30/H1/H4)现已发售。 目标每笔$20-$80+。 https://www.mql5.com/en/market/product/177643 KURAMA GOLD SIGNAL PRO(MT4版)— 7层过滤器、自动TP/SL、品质评分搭载 XAUUSD完整交易系统 不重绘。不重画。不延迟。每个信号永久固定。所见即所得。 福利:购买买断版许可证可免费获得 AI Zone Radar(价值$59)+ 完整PDF手册。购买后请给我发消息。 AI Zone Radar: https://www.mql5.com/en/market/product/175834 交易员的信赖:已被活跃的黄
PZ 123 Pattern
PZ TRADING SLU
1 (1)
123模式 是最受欢迎,功能强大和灵活的图表模式之一。该模式由三个价格点组成:底部,峰值或谷值以及38.2%至71.8%之间的斐波纳契回撤位。当价格突破最后一个峰值或谷值时,该形态被认为是有效的,此时指标绘制箭头,发出警报并可以进行交易。 [ 安装指南 | 更新指南 | 故障排除 | 常见问题 | 所有产品 ] 清除交易信号 可自定义的颜色和尺寸 实施绩效统计 可定制的斐波那契回撤水平 显示适当的止损和获利水平 该指标可用于查找连续或反转形态 它是不可重涂和不可重涂的 它实现了电子邮件/声音/视觉警报 123模式 可以表现为连续或反转模式。为了简化操作,该指标使您可以选择要寻找哪种类型的形态,使其成为趋势或反转交易者的绝佳工具。 设置 将指标加载到任何图表时,将显示一组选项作为输入参数。如果您认为它们太多,请不要感到失望,因为参数被分组为不言自明的块。这就是每个参数块的作用。 幅度-幅度表示替代价格点之间的最小柱线量。要找到大图案,请增加幅度参数。要查找较小的模式,请减小幅度参数。 闵。回撤-形态中所需的最小斐波那契回撤。设置为零不对其进行评估。 最大。回撤-形态中可能的最大斐
Apollo SR Master
Oleg Rodin
5 (2)
Apollo SR Master 是一款支撑/阻力指标,其特殊功能使利用支撑/阻力区域进行交易更加便捷可靠。该指标通过检测局部价格顶部和底部,实时计算支撑/阻力区域,没有任何时间延迟。为了确认新形成的支撑/阻力区域,该指标会显示特殊信号,表明该支撑/阻力区域可以作为实际的卖出或买入信号。在这种情况下,支撑/阻力区域的强度会增强,因此从该区域进行交易的成功率也会更高。这正是该指标的核心理念。 SR区域也使止损和止盈的操作更加便捷。根据信号方向,可以将SR区域上方或下方的空间用作止损位。此外,相对的SR区域也可以用作潜在的止盈区域。 我还免费向所有 Apollo SR Master 指标的用户提供我的“Apollo 价格行为系统”指标。这两个指标结合使用将帮助您找到更好的入场点。 购买后请联系我,即可免费获得我的交易技巧以及我的“阿波罗价格行为系统”指标作为赠品!
地震仪 市场地震探测器。 Description in English : https://www.mql5.com/en/market/product/113869?source=Site+Market+Product+Page#description How to use the Seismograph : https://www.mql5.com/en/market/product/113869#!tab=comments&page=2&comment=52806941 Create an EA : https://www.mql5.com/en/market/product/113869#!tab=comments&page=3&comment=52816509 无论您以何种方式交易,您都绝对希望避免进入低流动性市场。 然而,即使你确保在应该繁忙的市场时间进入,事实是许多人经常被困在流动性低的市场中。 经过几个小时的等待,市场突然变得繁忙起来,但是......事实证明,现在很多人都站在了与市场相反的方向上。 如果人们不得不等待浮动负数需要很长时间,甚至人们不得不止
Advanced Currency Strength28 Indicator
Bernhard Schweigert
4.91 (657)
目前40%的折扣 任何新手或专家交易者的最佳解决方案! 这个指标是一个独特的、高质量的、可负担得起的交易工具,因为我们纳入了一些专有的功能和一个新的公式。只需一个图表,你就可以读出28个外汇对的货币强度!想象一下,你的交易将如何得到改善,因为你的交易是在你的手中进行的。想象一下,你的交易将如何改善,因为你能够准确地确定新趋势或剥头皮机会的触发点? 用户手册:点击这里  https://www.mql5.com/en/blogs/post/697384 这是第一本,原版的! 不要买一个毫无价值的崇拜者的克隆品。 特别的 子窗口中的箭头显示强劲的货币势头GAP将指导你的交易! 当基础货币或报价货币处于超卖/超买区域(外盘斐波那契水平)时,在个人图表的主窗口中出现警告信号。 当货币力量从外围区间回落时,回撤/反转警报。 十字星模式的特别警报 可选择多个时间框架,以快速查看趋势! 货币强度线在所有的时间框架中都非常平稳,当使用较高的时间框架来识别总体趋势,然后使用较短的时间框架来确定精确的入口时,效果非常好。你可以根据自己的意愿选择任何时间框架。每个时间框架都由其自身进行了优化。
Enigmera
Ivan Stefanov
5 (8)
ENIGMERA: 市场的核心 重要提示:MQL5.com 演示版本在策略测试器中运行,可能无法完全反映 Enigmera 的功能。请查看描述、截图和视频了解详细信息。如有任何问题,请随时联系我! 该指标的代码已完全重写。版本 3.0 增加了新功能并修复了自指标发布以来积累的错误。 简介 这个指标和交易系统是金融市场的一种独特方法。ENIGMERA 使用分形周期来精确计算支撑和阻力水平。它展示了真实的积累阶段,并提供了方向和目标。无论是在趋势中还是在修正中,这个系统都能工作。 它是如何工作的 指标的大部分功能通过图表左侧的按钮控制,使得能够快速响应不同的市场情况。 按钮 ON/OFF – 显示或隐藏整个指标。 Channel – 激活支撑通道,显示可接受的偏差范围。 Dev1 (第一偏差) – 指示价格在支撑偏差内的波动,信号表示市场正在整合或积累力量。 Dev2 (第二偏差) – 显示价格在偏差之间的波动,表示趋势形成和方向。 Dev3 (第三偏差) – 表示趋势的显著加速和高波动性。 45deg (45度) – 显示市场的节奏和相对于 45 度线的运动稳定性。 Tgt1/2
Introduction to Fractal Pattern Scanner Fractal Indicator refers to the technical indicator that makes use of the fractal geometry found in the financial market. Fractal Pattern Scanner is the advanced Fractal Indicator that brings the latest trading technology after the extensive research and development work in the fractal geometry in the financial market. The most important feature in Fractal Pattern Scanner is the ability to measure the turning point probability as well as the trend probabi
Trend Lines PRO
Roman Podpora
5 (1)
TREND LINES PRO 帮助您了解市场真正的方向转变点。该指标显示真实的趋势反转点以及主要参与者重新入场的时机。 您可以看到 BOS线、 趋势变化和更高时间框架的关键水平——无需复杂的设置或不必要的干扰。信号不会重绘,并在K线收盘后仍然保留在图表上。 VERSION MT 5    -   与……搭配使用时,可发挥其最大潜力   RFI LEVELS PRO 指示器 该指标显示的内容: 实际变化 趋势(BOS 线) 一旦信号出现,它就始终有效!这与会重绘的指标有着重要的区别,后者可能会发出信号后又改变信号,从而导致资金损失。现在,您可以更精准、更准确地进入市场。此外,还有一个功能,会在箭头出现后为K线着色,直到达到目标价位(止盈)或出现反转信号为止。 重复条目   以及主要玩家的充值 为了提高寻找入场点时的视觉清晰度,我们创建了一个模块,该模块首先显示买入/卖出区域,并在该区域内寻找最佳入场点。此外,我们还加入了智能逻辑来管理止损位,该逻辑会随着时间的推移逐步降低止损位的大小,从而降低入场交易时的初始风险(移动止损位)。 信号强度水平(BOS) 该指标采用三个显著性等级来衡量
作者的更多信息
This is the free version of the Supply&Demand + Trendline + Trend tool. This version works only with EURCHF! You find the full version here:  https://www.mql5.com/en/market/product/67274 PAAIOS stands for   Price   Action   All   In   One   Solution. And that is the purpose of the Indicator. It should give you a tool to improve your trading decisively because you get the crucial information at a glance. The indicator simplifies the search for strong signals. It shows trend lines, demand and su
FREE
Netsrac SuPrEs
Carsten Pflug
5 (1)
The SuPrEs indicator indicates the distance to the next horizontal line whose name begins with the configured prefix (see Options). usage Draw support & resistance in the chart and let the indicator warn you, as soon as a configured distance is undershot. Use the prefix to provide alarms for other lines as well as standard lines (see screenshot with pivot indicator). Display of the indicator The indicator displays the distance to the next line above and below the current (Bid) price. Not more
FREE
Netsrac ADR Dashboard
Carsten Pflug
4.92 (13)
仪表盘的意图是提供配置资产的日、周、月范围的快速概览。在 "单一资产模式 "下,仪表板会在图表中直接显示可能的反转点,从而使统计数据可以直接交易。如果超过了配置的阈值,仪表盘可以发送屏幕警报,通知(到手机MT4)或电子邮件。 使用这些信息的方式有多种。一种方法是,已经完成近100%日均运动的资产显示出逆转的趋势。另一种方法是观察资产,它的波动率与平均水平相比非常低。现在的挑战是如何从这个低波动性中交易突破。 这只是两种可能的策略,对于这些策略,仪表盘可以成为一个重要的辅助工具。发现各种可能性! 关于控件的完整描述,请观看我的博客文章( https://www.mql5.com/en/blogs/post/732999 )。 注意:这个指标不能在策略测试器中使用。所以这里来自市场的演示版本不能使用。请使用该指标的免费版本进行测试: https://www.mql5.com/de/market/product/33913 这是ADR-Dashboard的MT4版本。如果你想在MT5上使用,请到 https://www.mql5.com/en/market/product/527
The dashboard should help to get a quick overview of the correlations of different assets to each other. For this, the value series are compared according to the Pearson method. The result is the value of the correlation (in percent). With the new single asset mode, you can immediately see which symbols have the highest positive or negative correlation. This prevents you from accidentally taking a risk on your trades with highly correlated symbols. Usage There are different methods for the corr
Netsrac SR Dashboard
Carsten Pflug
5 (4)
With the SR Dashboard, you get a powerful tool to control some of the most important information in trading. Assemble a setup according to your strategy and get informed as soon as this setup is valid. Assign scores to defined conditions and let the Dashboard find them. Choose from Trend, Average Daily Range, RSI, Moving Averages, Pivot (Daily, Weekly, Monthly), Highs and Lows, Candlestick Patterns. Note: This indicator cannot be used in the Strategy Tester. The demo version here from the marke
Netsrac Correlation Trader
Carsten Pflug
4.73 (15)
Netsrac Correlation Trader(NCT)是一个非常强大的工具,可以用对冲订单交易正负相关的货币对。 1)它寻找正负相关的货币对 2) 如果相关货币对不平衡,它会向你显示一个信号 3) 它可以通过你设置的时间框架和信号值来 "自动交易 "一些或所有的相关货币对(小心处理) 4) 它可以设置正确的手数,以拥有点值和每日范围的最佳对冲交易 5)它可以成为你的单一工具来支持你的关联交易的自由裁量权 你可以为EA的信号使用任何时间框架。小的时间框架比大的时间框架需要更多的人工干预。从M30开始的时间框架更适合于自动交易。我将逐步增加更多的功能,支持手动和自动交易。 如果您有一些问题或建议--请随时联系我。请阅读我的博客文章( https://www.mql5.com/en/blogs/post/726866 ),了解本EA的设置! 请注意。本EA不能进行回测,而且!DEMO是无用的!因为它至少同时在两种资产中交易(对冲订单)。 如果你不知道,这个专家是否适合你--请利用廉价的测试月。你将不会后悔。或者,使用免费的DEMO,可以在这里找到( https://www
The Netsrac Correlation Trade Indicator (NCTI) was created to trade correlations between different assets. NCTI offers five different strategies to do this. Five different correlation trading strategies with two or three assets Fast access your assets with one click via asset buttons Your profit/loss at a glance Configurable alerts via screen or mobile You can use the indicator with every timeframe. Higher timeframes give fewer but better signals. If you have some questions or suggestions - ple
Netsrac PAAIOS
Carsten Pflug
5 (6)
PAAIOS 指 的 是 价格 一体化 解决。 而 这 正 是 该 指标 目的 它 应该 给 你 一 个 来 果断 地 改善 的 交易 可以 时间 框架 中 显示 趋势 "线、需求和供应区。 特点 * 检测多时间框架的供应和需求区 * 探测并显示多时间框架的趋势线 * 探测多个时间段的趋势行为--你可以一目了然地了解全貌 * 如果一个区域/趋势线接近价格,就会提醒你(屏幕、通知、邮件)。 * 使用智能算法,只计算强势的供应和需求区。 供应和需求 - 它是如何工作的 PAAIOS使用一个内部的人字形函数来计算多时间框架的人字形来获得波动。这没有什么特别的。但是PAAIOS测量的是所有的波动,只考虑真正显著的波动开始的区域。所以你可以从多个时间框架中得到真正强大的买方和卖方区域。 趋势线 - 它是如何工作的 Paaios 也 内部 zigzag 来 计算 趋势线。 这 什么 特别 的。 但是 , 如果 使用 较 高 时间 段 的 趋势线 并 供求 关系 结合 , 你 会 得到 真正 强势 的 指示 在 在 价格 价格 价格 价格 价格 价格 价格 价格 价格 价格 价格价格 价格 价
The Netsrac Supply&Demand Dashboard shows you at a glance where relevant zones are located on your favorite assets. Open your chart directly from the dashboard and trade zones that really matter. Features Finds the next relevant supply and demand zone and displays the distance to this zone (in pips) Finds and displays the zones in three different timeframes Calculates a trend indicator for the current and past candle for each configured time frame Opens a chart with your chart template directly
The Netsrac Correlation Trade Indicator (NCTI) was created to trade correlations between different assets. NCTI offers five different strategies to do this. Five different correlation trading strategies with two or three assets Fast access your assets with one click via asset buttons Your profit/loss at a glance Configurable alerts via screen or mobile You can use the indicator with every timeframe. Higher timeframes give fewer but better signals. If you have some questions or suggestions - ple
The intention of the dashboard is to provide a quick overview of the daily, weekly and monthly range of configured assets. In "single asset mode" the dashboard shows you possible reversal points directly in the chart, thus making statistics directly tradable. If a configured threshold is exceeded, the dashboard can send a screen alert, a notification (to the mobile MT5) or an email.  There are various ways of using this information. One approach is that an asset that has completed nearly 100% o
With the SR Dashboard, you get a powerful tool to control some of the most important information in trading. Assemble a setup according to your strategy and get informed as soon as this setup is valid. Assign scores to defined conditions and let the Dashboard find them. Choose from Trend, Average Daily Range, RSI, Moving Averages, Pivot (Daily, Weekly, Monthly), Highs and Lows, Candlestick Patterns. What can you do with this tool? Use the dashboard as a powerful tool for your discretionary trad
THE flexible Expert Advisor for Custom Trading Strategies in MetaTrader 5 The Netsrac TradeAid expert is a powerful tool for traders looking to develop their own trading strategies in MetaTrader 5. With this expert advisor, you can combine a variety of technical indicators and trading rules with a simple "If This (AND This...) Then That" logic to create tailored trading strategies that match your individual preferences. You don´t need any knowledge in MQL5 coding language to build your own exper
筛选:
无评论
回复评论