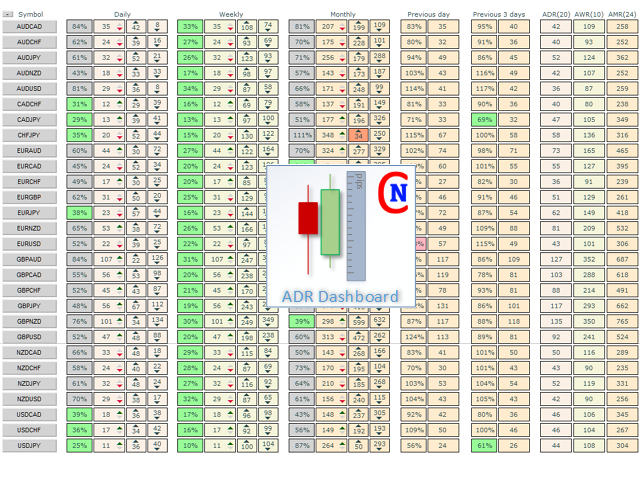
Netsrac ADR Dashboard
- インディケータ
- バージョン: 4.8
- アップデート済み: 19 6月 2026
- アクティベーション: 10

As a tribute to all the "quants" and "quantums" in this market who promise to make you rich quickly and easily, my ADR Dashboard is now just $39 — until summer is over, or perhaps a little longer. It won't make you rich quick, but it gives you a perfect view of the potential trading ranges of an asset.
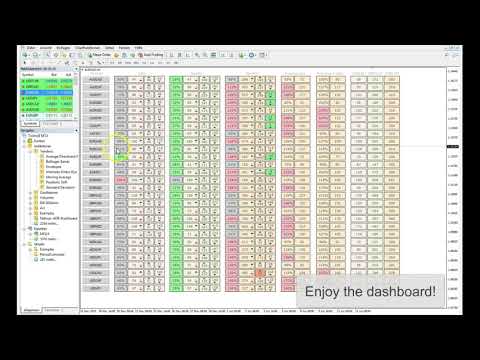
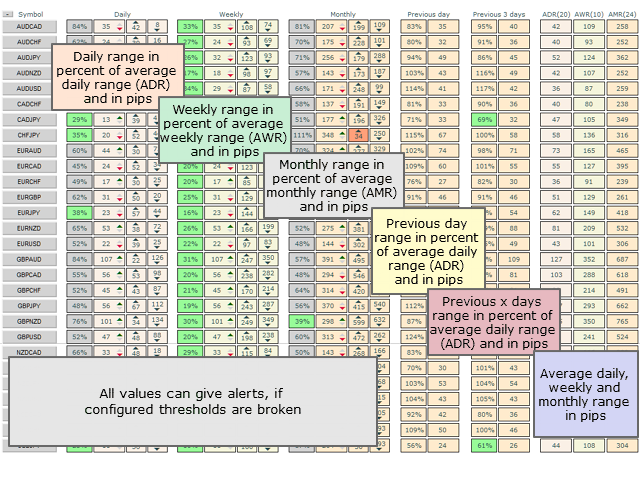
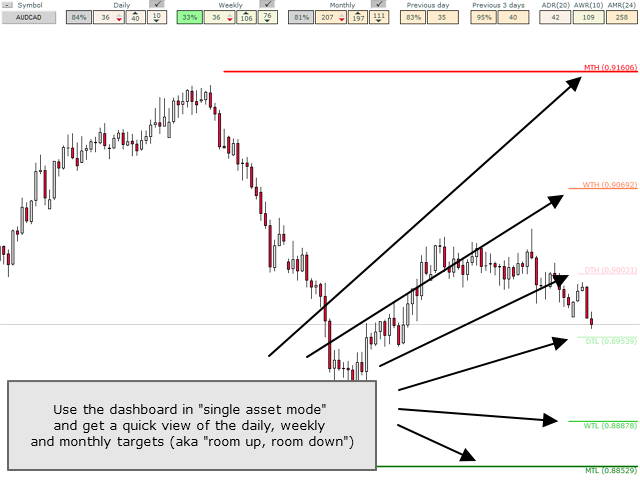
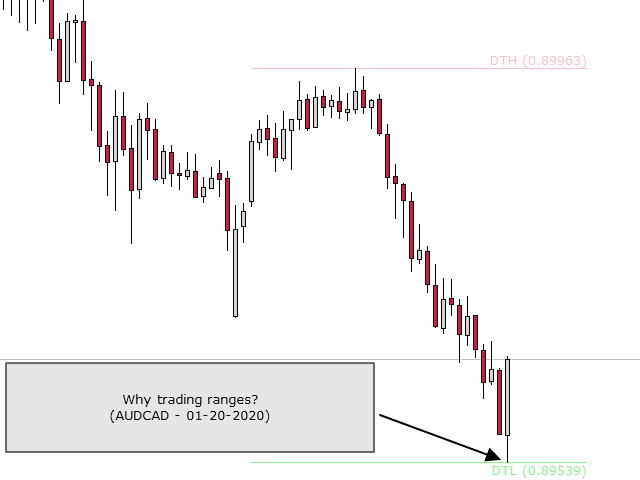
The intention of the dashboard is to provide a quick overview of the daily, weekly and monthly range of configured assets. In "single asset mode" the dashboard shows you possible reversal points directly in the chart, thus making statistics directly tradable. If a configured threshold is exceeded, the dashboard can send a screen alert, a notification (to the mobile MT4) or an email.
There are various ways of using this information. One approach is that an asset that has completed nearly 100% of its average daily movement shows a tendency to reverse. Another approach is to observe the assets, which has a very low volatility compared to the average. Now the challenge is to trade the breakout from this low volatility.
These are just two possible strategies for which the dashboard can be an important aid. Discover the possibilities!
For full description of the controls, please watch my blog entry (https://www.mql5.com/en/blogs/post/732999).
Note: This indicator can not be used in the Strategy Tester. So the demo version here from the market does not work. Please use the free version of the indicator for testing: https://www.mql5.com/de/market/product/33913
This is the MT4-Version of the ADR-Dashboard. If you want it for MT5, go to https://www.mql5.com/en/market/product/52708


Netsrac ADR Dashboard by Carsten Pflug is truly one of the best indicators I’ve ever used. It’s extremely helpful for reading market range, identifying continuation or exhaustion zones, and aligns perfectly with my own trading system. Carsten Pflug is an outstanding developer — very fast to respond, professional, and always willing to share useful tips whenever I ask questions. Thank you so much for this powerful indicator — it has really helped me make clearer and more confident trading decisions every single day!