Netsrac PAAIOS
- 指标
- 版本: 3.1
- 更新: 15 十一月 2024
- 激活: 10

PAAIOS
指 的 是 价格 一体化 解决。 而 这 正 是 该 指标 目的 它 应该 给 你 一 个 来 果断 地 改善 的 交易 可以 时间 框架 中 显示 趋势 "线、需求和供应区。
特点
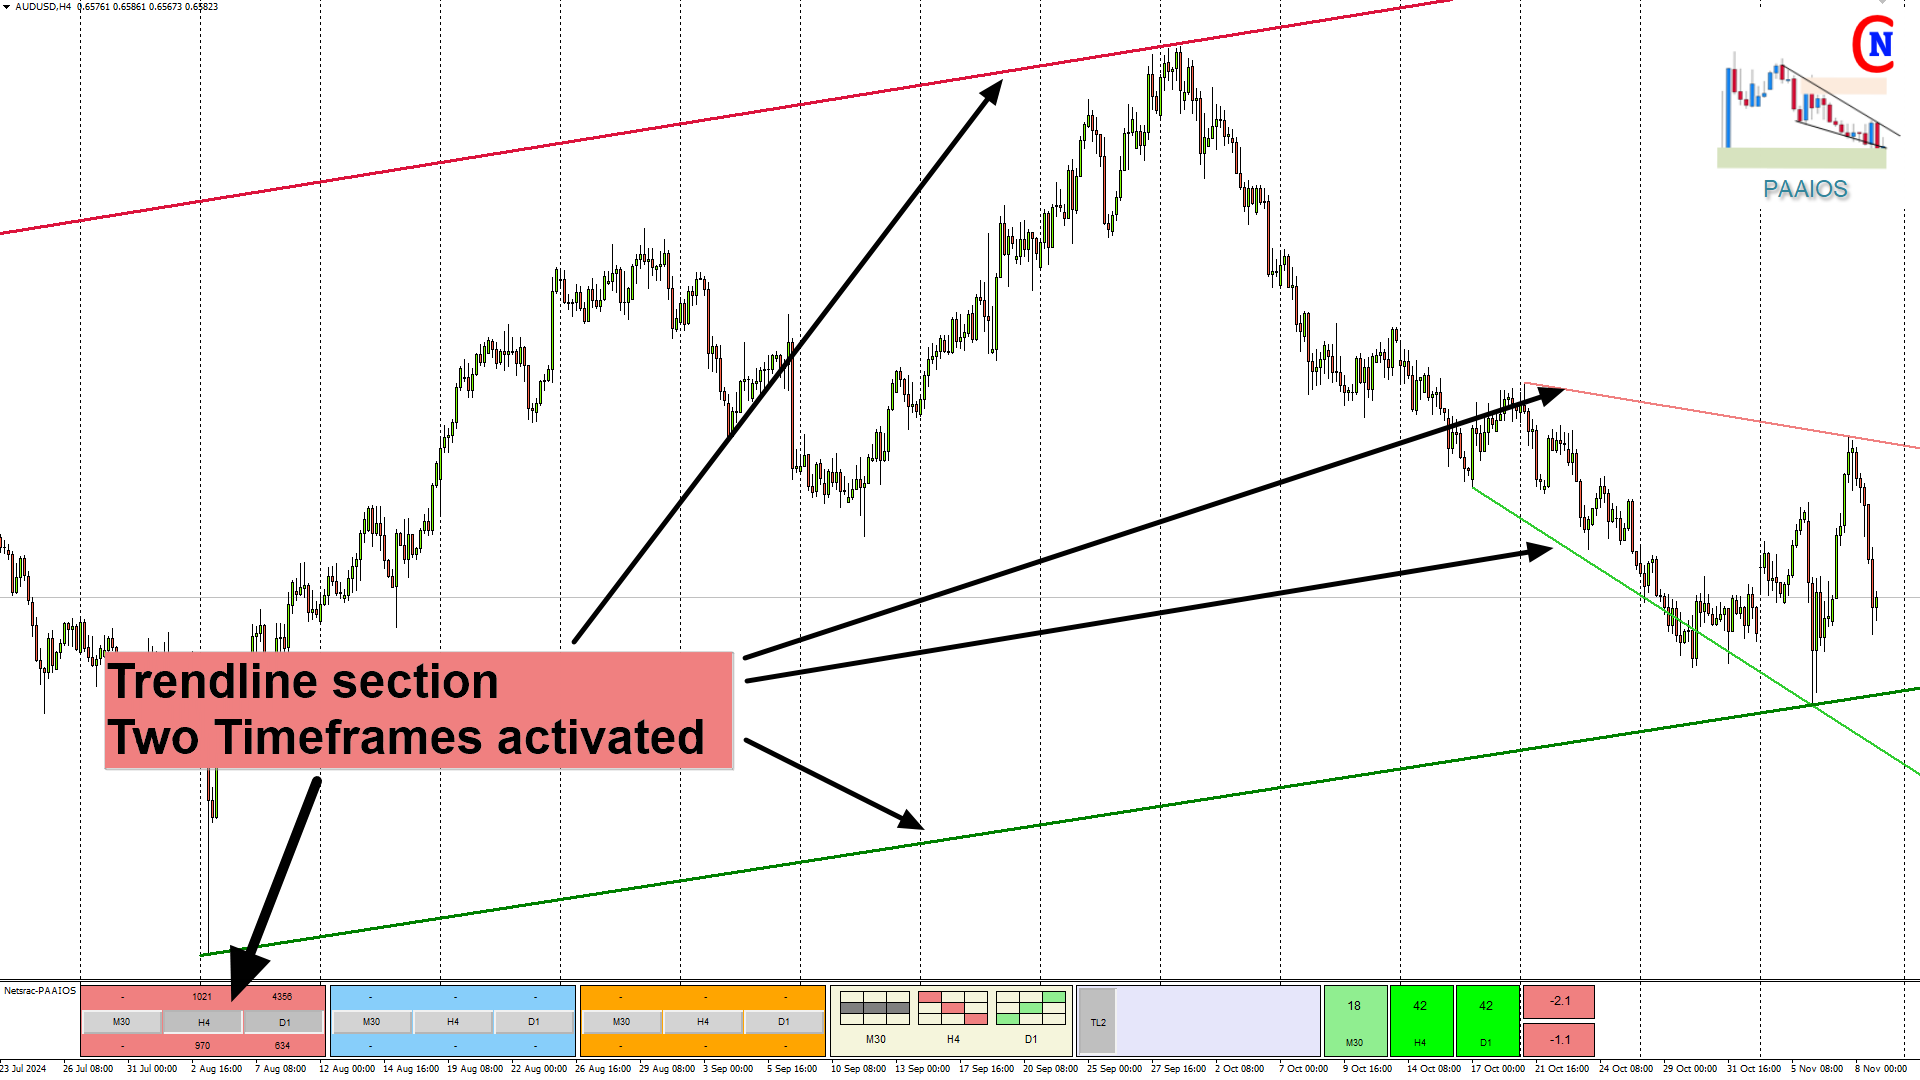
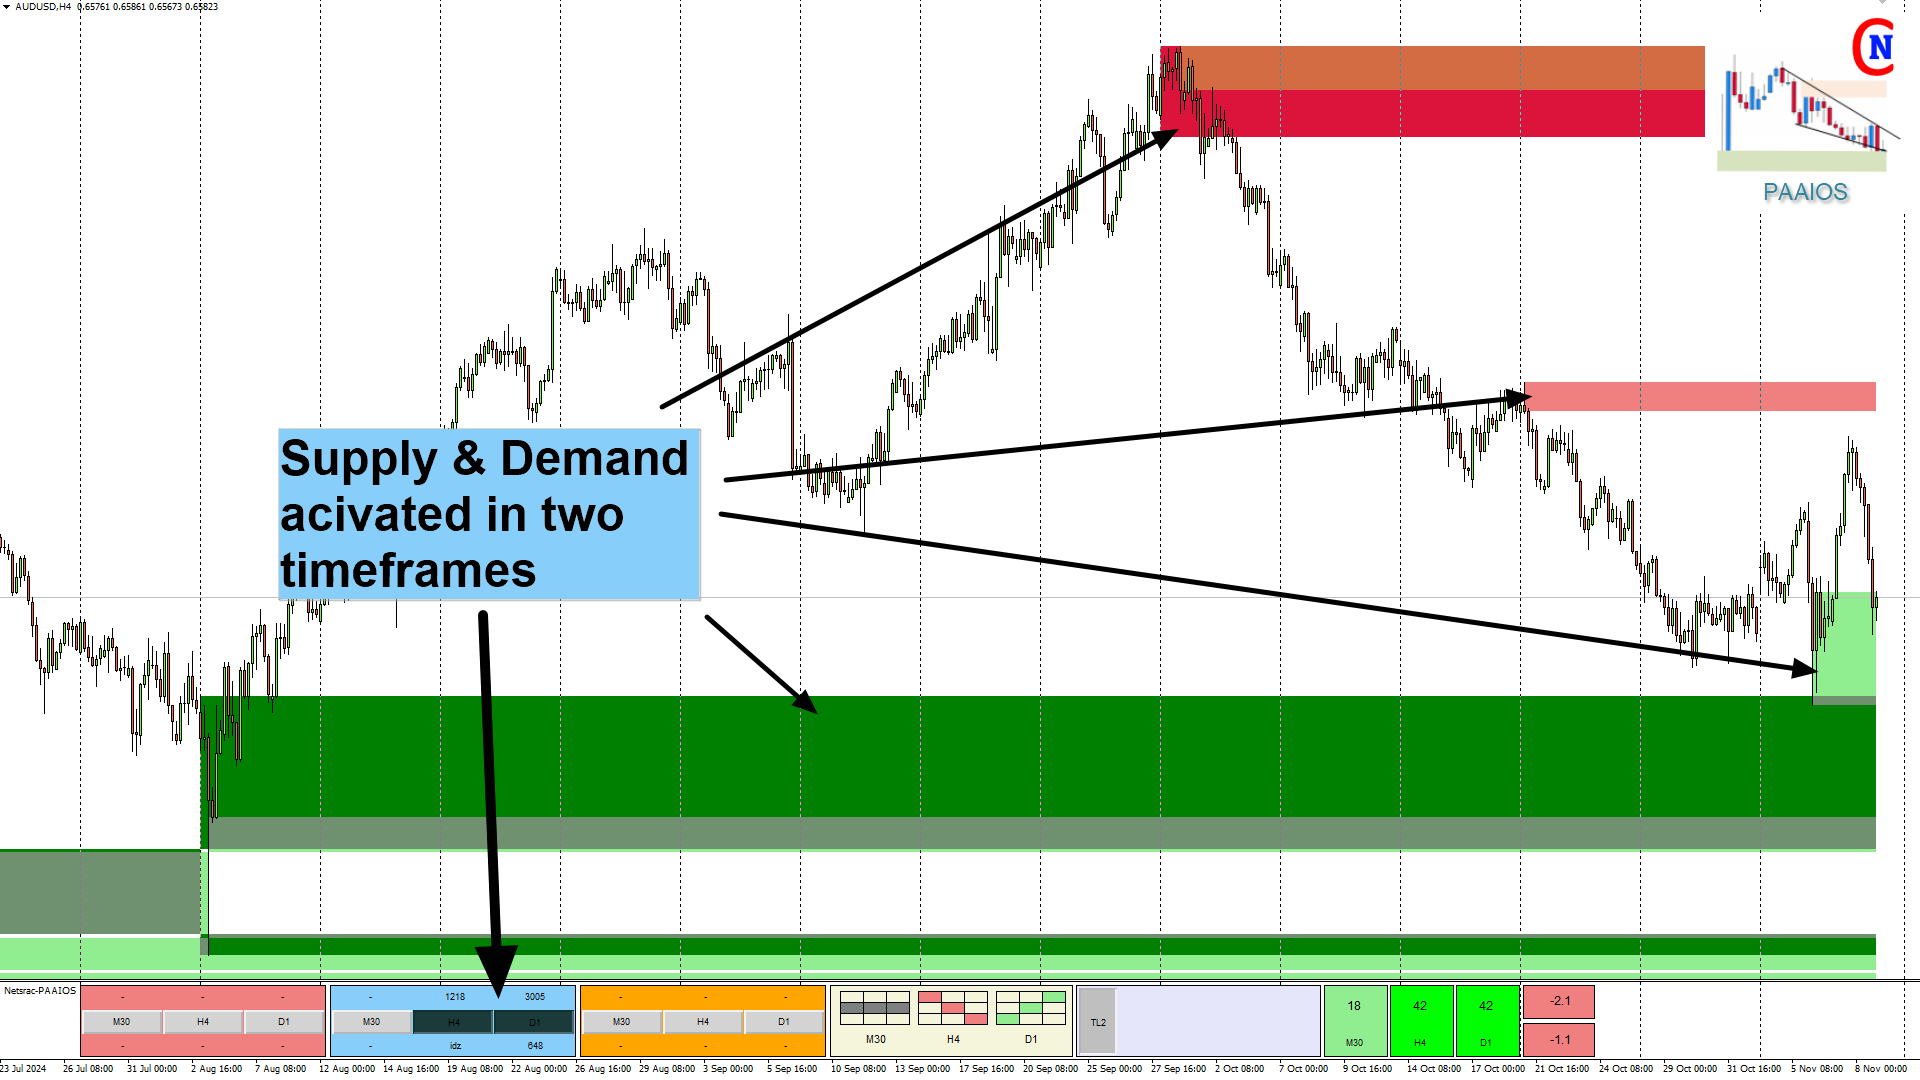
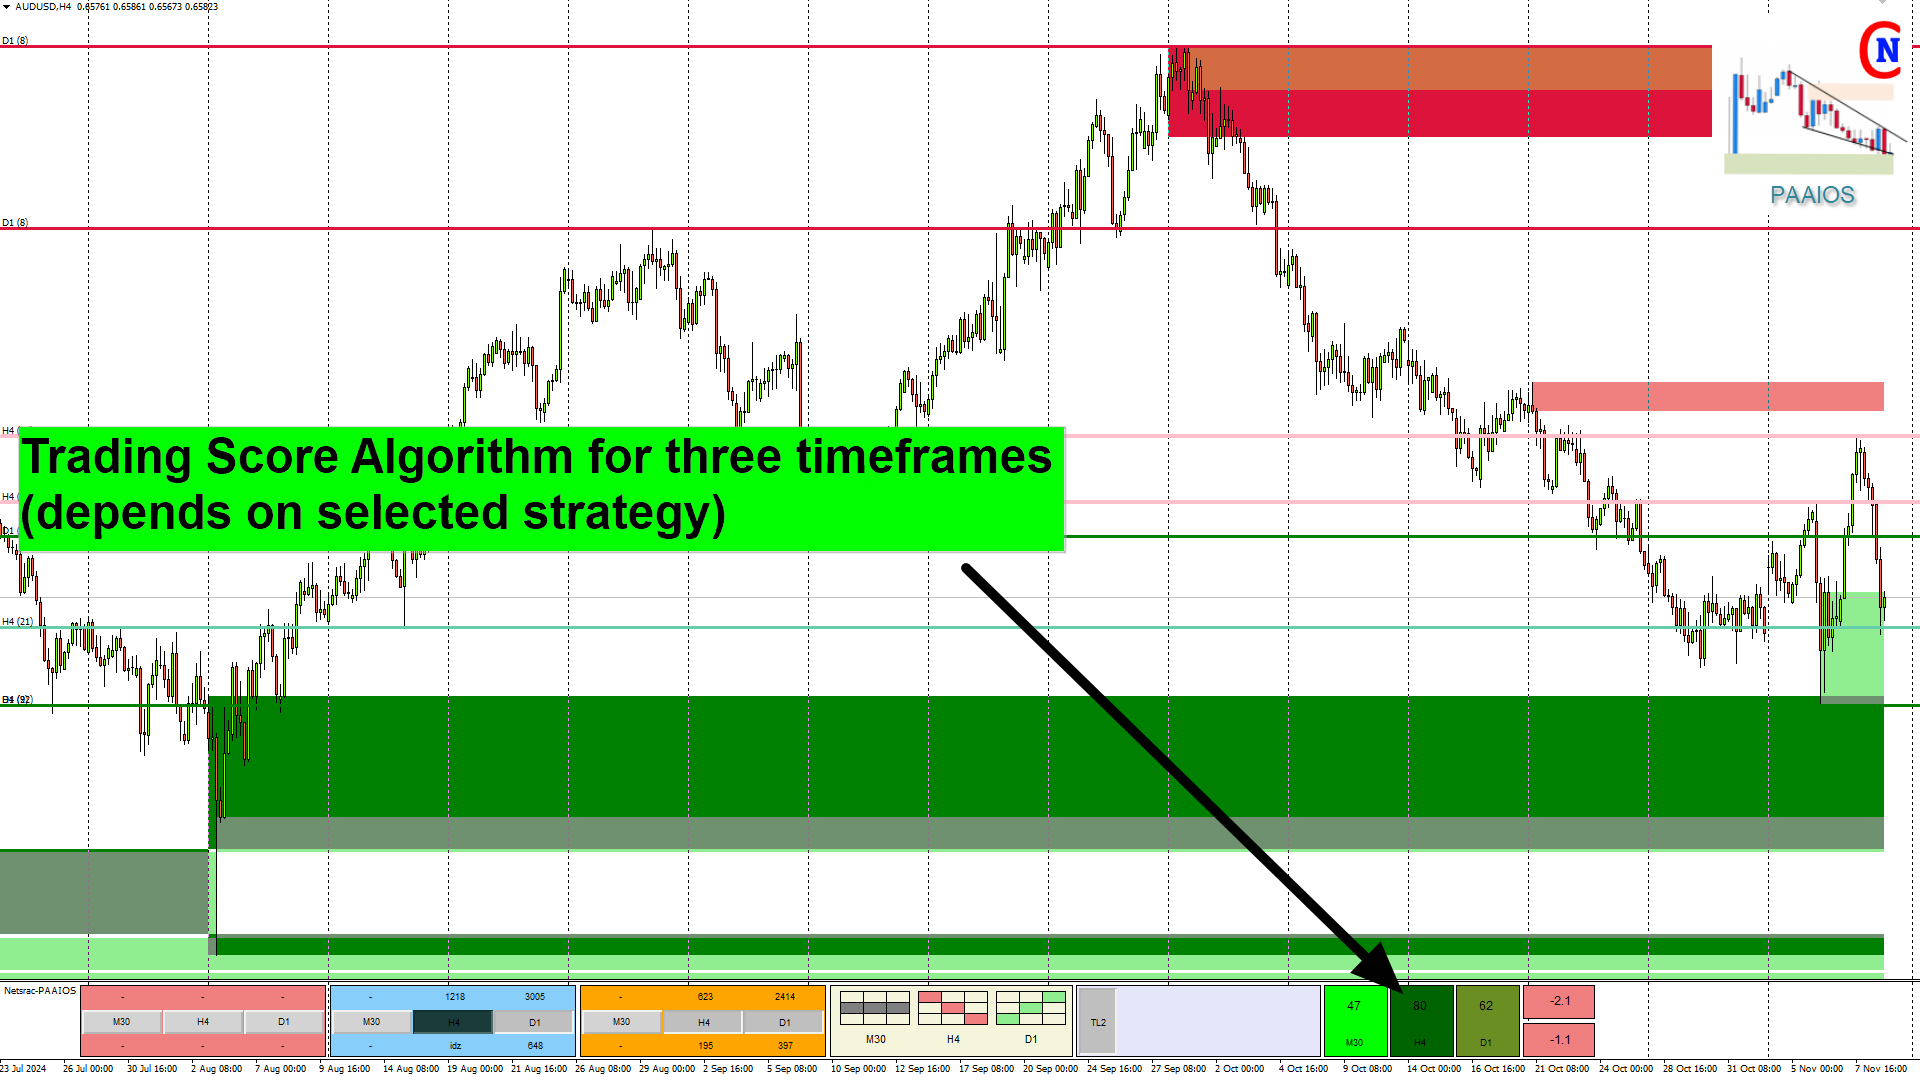
* 检测多时间框架的供应和需求区
* 探测并显示多时间框架的趋势线
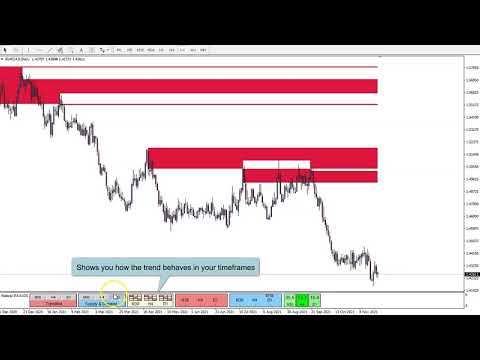
* 探测多个时间段的趋势行为--你可以一目了然地了解全貌
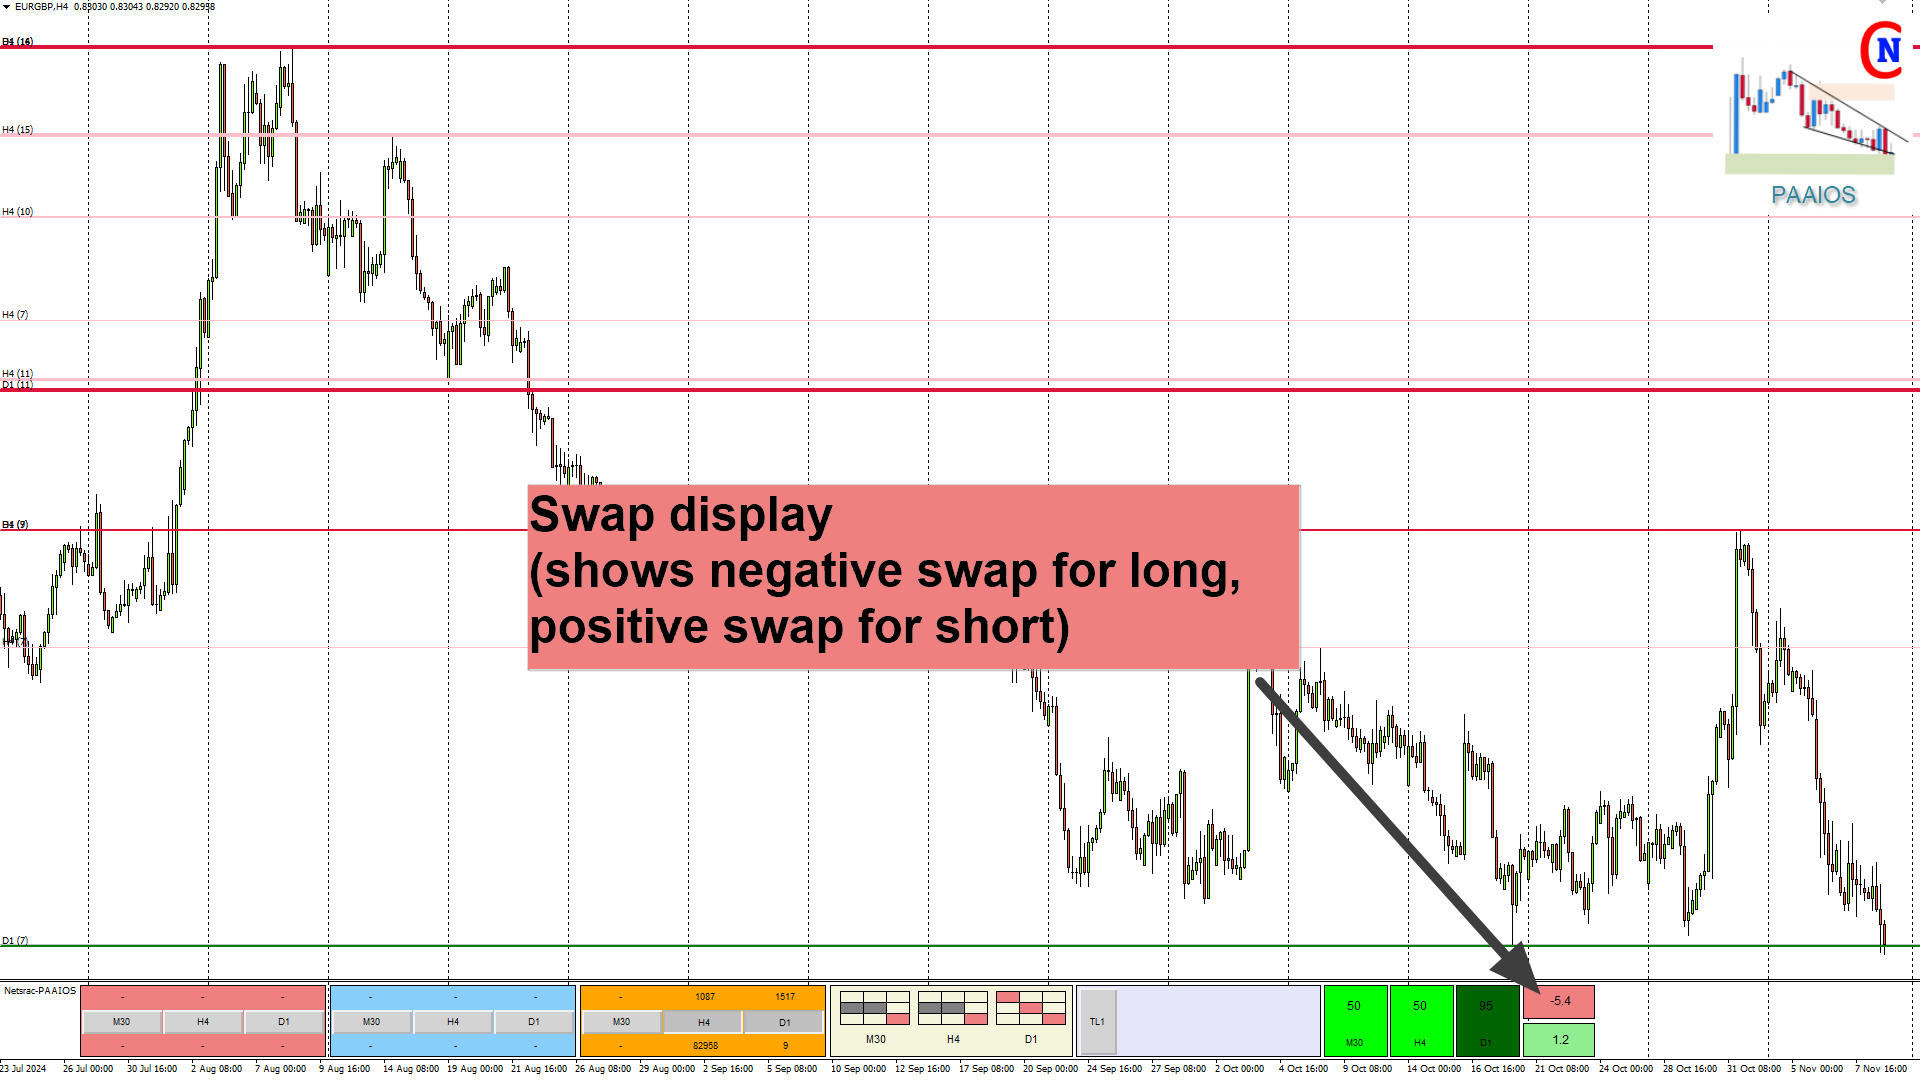
* 如果一个区域/趋势线接近价格,就会提醒你(屏幕、通知、邮件)。
* 使用智能算法,只计算强势的供应和需求区。
供应和需求 - 它是如何工作的
PAAIOS使用一个内部的人字形函数来计算多时间框架的人字形来获得波动。这没有什么特别的。但是PAAIOS测量的是所有的波动,只考虑真正显著的波动开始的区域。所以你可以从多个时间框架中得到真正强大的买方和卖方区域。
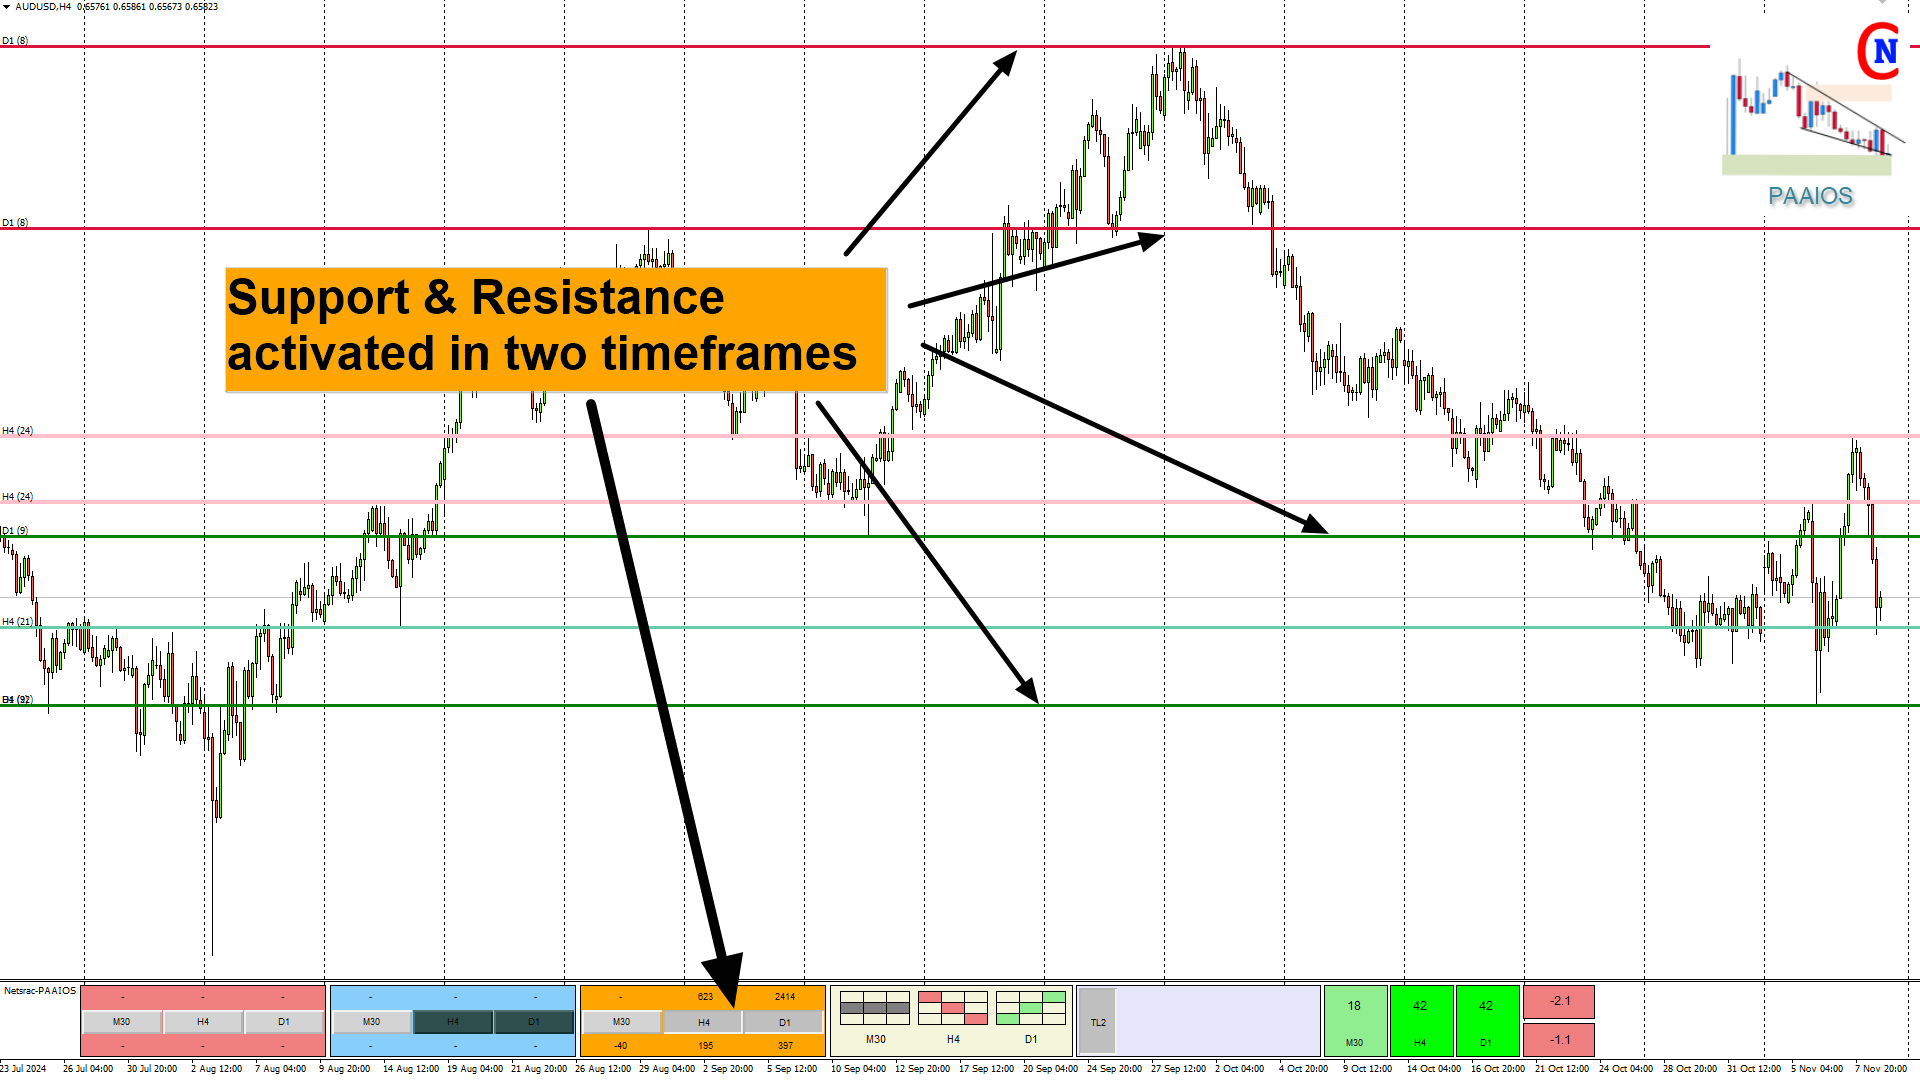
趋势线 - 它是如何工作的
Paaios 也 内部 zigzag 来 计算 趋势线。 这 什么 特别 的。 但是 , 如果 使用 较 高 时间 段 的 趋势线 并 供求 关系 结合 , 你 会 得到 真正 强势 的 指示 在 在 价格 价格 价格 价格 价格 价格 价格 价格 价格 价格 价格价格 价格 价格 HIP可能会有反应。
趋势部分 - 它是如何工作的
最后 , 趋势 告诉 你 资产 什么 状态。 它 是否 上升 上升 我们 是否 有 一 个 范围区 趋势 算法 使用 市场 经典 规则 , 如 的 的 高 , 较 的 低 等等 等等 。。。。。。。。。 。。。。。。。。。 。。。。。。。。。 。。。。。。。。。 ≤ HI部分给你一个真正有用的大画面。
请阅读我的博客文章( https://www.mql5.com/en/blogs/post/746705 ),以了解各项功能的描述。
我祝愿你在使用这个指标时获得更大的成功!
Carsten - netsraC Carsten - netsraC


Does not support product responses. The product's lines are haphazardly drawn, resistance to support the trend line is not high in reputation. What a waste of money. Update : he fixed the trend line