QuantSystem MTF Direction Panel

3
  • 指标
  • Elias Balian Zimmermann
    Elias Balian Zimmermann
    Hello to all readers,
    As the founder of QuantCore Systems, I develop and optimize Expert Advisors for MetaTrader 5. My focus lies on rule-based trading logic, structured backtesting, transparent risk control, and the development of automated trading systems for liquid markets.
  • 版本: 2.10
QuantSystem Multi Timeframe Panel

QuantSystem Multi Timeframe Panel is a free MetaTrader 5 indicator that displays the current market direction across several important timeframes in a clean chart dashboard.

The indicator was developed to give traders a fast, clear and structured overview of the current multi-timeframe market situation. Instead of opening each timeframe manually and checking several indicators separately, the panel summarizes the most relevant information directly on the chart.

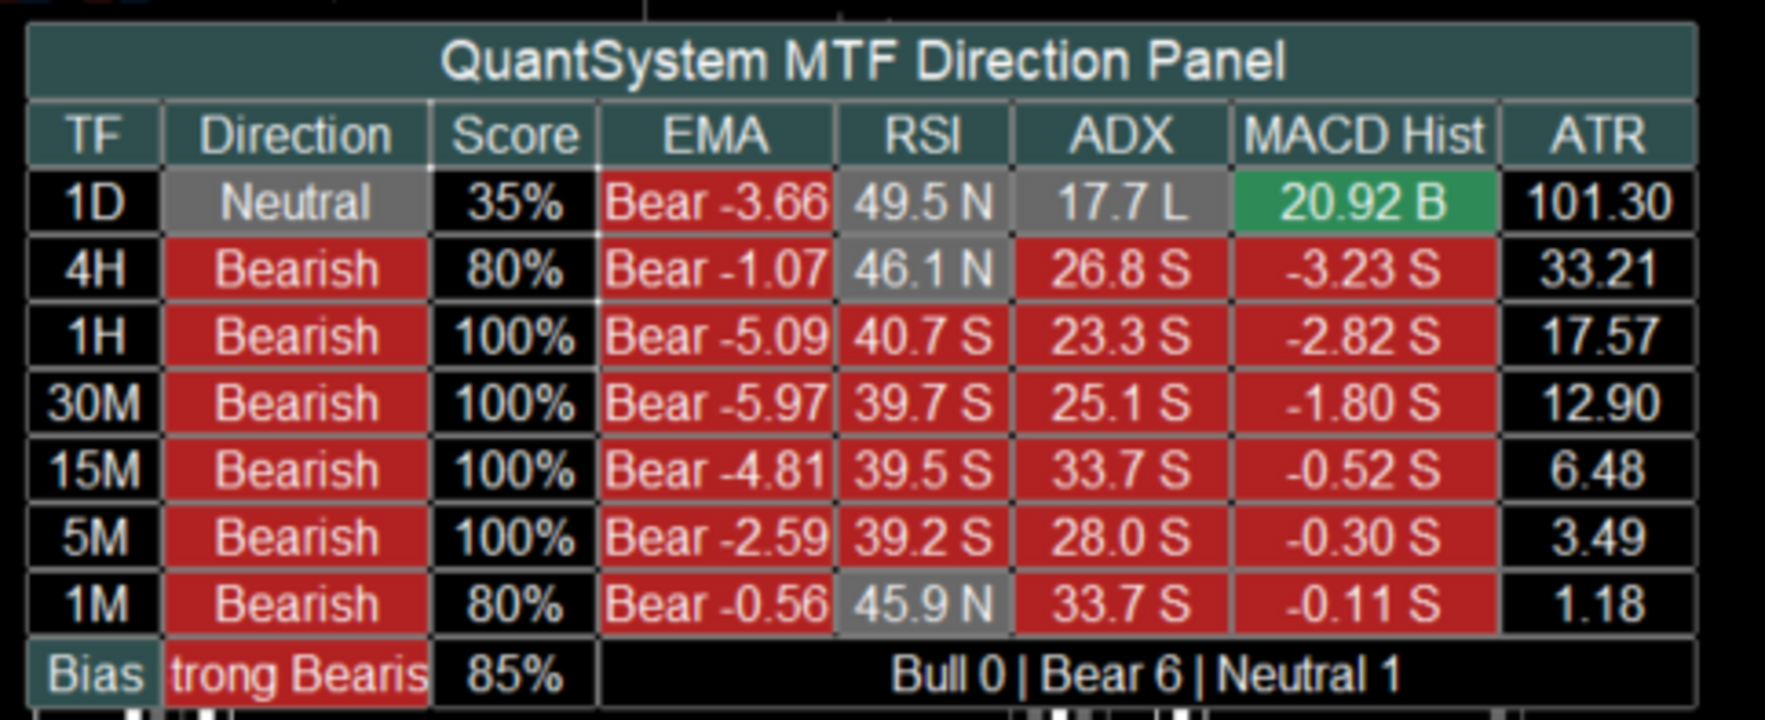
By default, the tool analyzes the following timeframes: 1D, 4H, 1H, 30M, 15M, 5M and 1M. For each timeframe, the panel calculates an individual market direction based on several technical components such as EMA, RSI, ADX, MACD Histogram and ATR.

The user can decide which values should be displayed in the panel and which components should be included in the score calculation. This allows the panel to be used either in a compact format or as a more detailed analysis dashboard.

The indicator is not designed as a standalone trading system. It is built as a professional market context and orientation tool for manual traders, systematic traders and users of automated trading strategies.

Main Idea of the Indicator

Many traders use multi-timeframe analysis to get a better understanding of the current market structure. However, a common mistake is focusing only on the current chart while ignoring the higher timeframes.

For example, an M1 chart may look bullish in the short term, while 1H, 4H and 1D are still clearly bearish. In such situations, a trader may be trading against the larger market structure without immediately noticing it.

This is exactly where QuantSystem Multi Timeframe Panel is designed to help. The panel shows at a glance which timeframes are bullish, which timeframes are bearish, which timeframes are neutral, how strong the current direction is, whether several timeframes are aligned in the same direction and whether the market is clearly directional or mixed.

This gives the user a fast visual overview without overloading the chart with many separate indicators.

What the Panel Displays

The panel consists of several columns. Some columns are always visible, while others can be enabled or disabled in the input settings.

The columns TF, Direction and Score are always visible.

The TF column shows the corresponding timeframe, for example 1D, 4H, 1H, 30M, 15M, 5M and 1M.

The Direction column shows the calculated direction of each timeframe. Possible values are Bullish, Bearish and Neutral. The direction is not based on only one value. Instead, it is calculated from a weighted combination of different technical components. By default, EMA, RSI, ADX and MACD can be included in this evaluation.

The Score column shows the strength of the calculated direction in percent. A high score means that several active analysis components are pointing in the same direction. A score of 100 percent means that all active score components confirm the same direction. A lower score means that the signals are more mixed or that some components are neutral or opposite.

In addition, the following optional columns can be displayed: EMA, RSI, ADX, MACD Hist and ATR. Each of these columns can be enabled or disabled separately through the inputs. This allows the user to customize the panel and keep the chart clean.

EMA Column

The EMA column shows the direction of the moving average structure.

By default, the indicator uses a Fast EMA with a length of 9 and a Slow EMA with a length of 21.

The logic is simple: if the Fast EMA is above the Slow EMA, the EMA component is evaluated as bullish. If the Fast EMA is below the Slow EMA, the EMA component is evaluated as bearish.

In compact mode, the EMA column does not display both full EMA prices. Instead, it shows the direction and the difference between the Fast EMA and the Slow EMA. This keeps the panel much cleaner and easier to read.

Example: Bull 2.35 means that the Fast EMA is above the Slow EMA. Bear -4.18 means that the Fast EMA is below the Slow EMA.

The EMA difference also gives the user an idea of how far both moving averages are apart. This means the panel does not only show direction, but also provides a basic sense of EMA separation.

RSI Column

The RSI column shows the current RSI value of each timeframe.

By default, the indicator uses an RSI period of 14, an RSI midline of 50 and a neutral zone of 5 points.

With the default settings, this means: RSI above 55 is evaluated as bullish, RSI below 45 is evaluated as bearish and RSI between 45 and 55 is evaluated as neutral.

The RSI value is displayed in a compact format, for example 56.8 B, 43.2 S or 49.5 N.

B stands for bullish, S stands for bearish and N stands for neutral.

The neutral zone is important because RSI values around the 50 level often do not provide a clear directional signal. Without a neutral zone, every small movement above or below 50 would immediately be interpreted as bullish or bearish. The neutral zone makes the evaluation smoother and cleaner.

ADX Column

The ADX column shows trend strength and trend direction using ADX, PlusDI and MinusDI.

By default, the indicator uses an ADX period of 14 and a minimum ADX value of 18.

The logic is: if ADX is below the minimum value, the ADX component is evaluated as weak or neutral. If ADX is above the minimum value and PlusDI is greater than MinusDI, the component is evaluated as bullish. If ADX is above the minimum value and MinusDI is greater than PlusDI, the component is evaluated as bearish.

Example displays are 26.8 B, 31.2 S or 14.5 L.

B stands for bullish, S stands for bearish and L stands for low or too weak.

ADX is useful because it does not only evaluate direction, but also checks whether there is enough trend strength. This can help identify weak or unclear market phases.

MACD Histogram Column

The MACD column does not display MACD Main and MACD Signal as two long values. Instead, it shows the difference between both lines.

The calculation is: MACD Histogram = MACD Main minus MACD Signal.

By default, the indicator uses MACD Fast 12, MACD Slow 26 and MACD Signal 9.

The logic is: if the MACD Histogram is greater than 0, the MACD component is evaluated as bullish. If the MACD Histogram is below 0, the MACD component is evaluated as bearish.

Example displays are 1.25 B or -3.42 S.

This format is much clearer than displaying both full MACD values. The user can immediately see whether MACD momentum is bullish or bearish.

ATR Column

The ATR column shows the current average price movement of each timeframe.

By default, the indicator uses an ATR period of 14.

ATR is currently displayed as a volatility value and is not included in the Direction Score calculation by default. This is intentional, because ATR does not provide a direct bullish or bearish direction. ATR mainly shows how much the market is currently moving.

A higher ATR value means higher market volatility. This can be especially useful in markets such as Gold, indices, Forex or cryptocurrencies, where volatility plays an important role.

How the Direction Is Calculated

The direction of each timeframe is calculated through a weighted point system.

By default, EMA, RSI, ADX and MACD can be included in the score.

The default weighting is: EMA Weight 35, RSI Weight 20, ADX Weight 25 and MACD Weight 20.

Together, this equals 100 points.

If all active components are bearish, the timeframe receives a bearish score of 100 percent. If some components are bullish while others are bearish or neutral, the score is calculated accordingly.

Example: EMA bearish gives 35 points to bearish, RSI neutral gives no points, ADX bearish gives 25 points to bearish and MACD bullish gives 20 points to bullish. The indicator then compares bullish and bearish points. The stronger side determines the direction, as long as the minimum score requirement is reached.

Neutral State

The indicator can also display a neutral state.

This is controlled by the settings Allow Neutral State and Min Directional Score.

By default, the minimum score is set to 60.

This means: if the stronger direction is below 60 percent, the timeframe is evaluated as neutral.

This prevents the indicator from showing a clear direction too quickly when the market situation is actually mixed.

Overall Bias

At the bottom of the panel, the indicator displays an overall market bias.

Possible values are Strong Bullish, Mild Bullish, Mixed, Mild Bearish and Strong Bearish.

This overall bias is based on how many of the analyzed timeframes are bullish, bearish or neutral.

By default, the Strong Alignment Count is set to 5. This means that if at least 5 out of 7 timeframes point in the same direction, the panel displays a strong bias.

Example: if 5 timeframes are bearish, the panel displays Strong Bearish. If 5 timeframes are bullish, the panel displays Strong Bullish.

If there is no clear majority, the panel displays a mixed or milder market condition.

Closed Candle Mode

An important setting is Use Closed Candle Mode.

When this option is enabled, the indicator uses only already closed candles for the higher timeframes.

This is important because values on open higher-timeframe candles can still change while the candle is forming.

For example, a 4H candle can look bullish during its formation, but close bearish by the end of the period. With Closed Candle Mode enabled, the panel works more conservatively and more stable because it only uses confirmed candle values.

If the user wants to see the most current live values, this option can be disabled. The panel will then react faster, but values may change more often during the still-open candle.

Compact Display

The Compact Display setting controls how compactly values are shown inside the panel.

When Compact Display is enabled, the panel shows short and clean values.

Examples: EMA Bear -3.20, RSI 43.5 S, ADX 28.4 S, MACD Hist -1.25 S and ATR 4.80.

When Compact Display is disabled, some values can be displayed in a more detailed format.

For most users, compact mode is recommended because it keeps the panel easier to read and uses less chart space.

Displayed Columns

The user can choose which values are displayed in the panel through the input settings.

The relevant settings are Show EMA, Show RSI, Show ADX, Show MACD and Show ATR.

If a column is disabled, it disappears from the panel. The basic columns TF, Direction and Score always remain visible.

This allows each user to decide whether they want a simple overview or a more detailed analysis panel.

A simple setup can display only TF, Direction and Score. A detailed setup can additionally display EMA, RSI, ADX, MACD Hist and ATR.

Score Components

In addition to the visible columns, the user can choose which components are included in the score calculation.

The relevant settings are Use EMA In Score, Use RSI In Score, Use ADX In Score and Use MACD In Score.

This is important because display and calculation are controlled separately.

For example, a user can display RSI in the panel but exclude RSI from the score calculation. Another user can base the score only on EMA and ADX, while MACD and RSI are shown only as additional information.

This makes the indicator flexible and adaptable to different trading styles.

Adjustable Periods and Parameters

The indicator provides several inputs that allow the user to customize the calculation.

In the EMA Settings, the user can adjust Fast MA Length, Slow MA Length, MA Method, Applied Price, Use EMA In Score and EMA Weight.

In the RSI Settings, the user can adjust RSI Period, RSI Midline, RSI Neutral Zone, Use RSI In Score and RSI Weight.

In the ADX Settings, the user can adjust ADX Period, Minimum ADX, Use ADX In Score and ADX Weight.

In the MACD Settings, the user can adjust MACD Fast, MACD Slow, MACD Signal, Use MACD In Score and MACD Weight.

In the ATR Settings, the user can adjust the ATR Period.

In the Bias Settings, the user can adjust Allow Neutral State, Min Directional Score and Strong Alignment Count.

Panel Position and Design

The user can also customize the visual appearance of the panel.

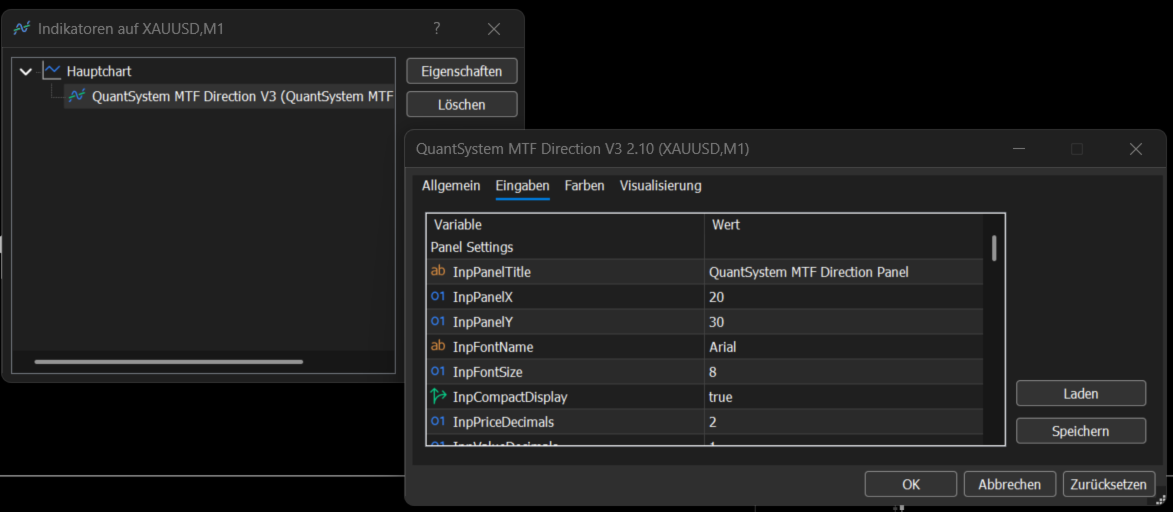
This includes Panel X, Panel Y, Font Name, Font Size, Compact Display, Price Decimals, Value Decimals, MACD Decimals and the colors.

Panel X and Panel Y can be used to move the dashboard on the chart. If the panel should be moved further to the right, Panel X can be increased. If the panel should be moved further down, Panel Y can be increased.

Colors for bullish, bearish, neutral, header, text and borders can also be adjusted.

Alerts

The indicator includes an optional alert function.

If Enable Bias Alerts is activated, an alert can be triggered when the Overall Bias changes.

Examples of possible changes are Strong Bearish to Mixed, Mixed to Strong Bullish or Mild Bullish to Strong Bullish.

This function can be useful if the user wants to be notified when the multi-timeframe structure changes significantly.

Notes About the Screenshots

The screenshots show different display versions of the indicator directly on a MetaTrader 5 chart.

The screenshots show how the panel appears in the main chart window, how multiple timeframes are analyzed at the same time, how Direction and Score are displayed for each timeframe, how optional values such as EMA, RSI, ADX, MACD Histogram and ATR appear in detailed mode and how the Overall Bias is summarized at the bottom of the panel.

The screenshots are visual examples of how the indicator can look in practical chart use. Depending on the symbol, timeframe, broker data, enabled inputs and selected panel position, the display may differ slightly.

Suitable Markets

The indicator can generally be used on all markets available in MetaTrader 5.

Examples include Gold, Forex, indices, cryptocurrencies, commodities and stock CFDs.

The panel can be especially useful in markets where multi-timeframe structure plays an important role, for example XAUUSD, EURUSD, GBPUSD, US100, US500, BTCUSD and ETHUSD.

The indicator is not limited to a specific symbol.

Practical Use

The indicator can be used for different purposes, for example as a fast multi-timeframe market overview, as a trend filter for manual trades, as additional confirmation before an entry, for identifying mixed market phases, for comparing short-term and long-term timeframes and for supporting the analysis of trend strength, momentum and volatility.

One possible use case: if 1D, 4H and 1H are bearish while M1 is temporarily bullish, the user can quickly recognize that the short-term move may only be a correction within a larger bearish structure.

On the other hand, strong alignment across several timeframes can indicate a clearer market phase.

Important Notice

QuantSystem Multi Timeframe Panel is not a standalone trading system and does not provide guaranteed buy or sell signals.

The indicator is designed only for technical market analysis and for better understanding the current multi-timeframe structure.

Trading involves risk. Technical indicators, historical price movement or current market structures do not guarantee future results. Every user should perform their own testing, adjust the settings to their own trading style and use appropriate risk management.
推荐产品
Multi Timeframe Volatility Dashboard Free indicator for multi-timeframe volatility analysis Description Multi Timeframe Volatility Dashboard is a powerful and convenient tool for traders that allows instant assessment of current market volatility across 7 timeframes simultaneously. The indicator displays ATR (Average True Range) values and classifies volatility as **LOW, MEDIUM, or HIGH** relative to the average value over a specified lookback period. Key Features - Multi-timeframe analy
FREE
KD MTF Candle Timer
Dien Du Khanh Duong
KD MTF Candle Timer — Multi-Timeframe Candle Countdown & Synchronized Clocks for MetaTrader 5 Have you ever entered a trade prematurely on the lower timeframe, only to watch a Higher Timeframe (H1 or H4) candle wick violently against you before closing as a rejection pinbar? Or entered right before the candle close and suffered severe slippage during the transition? In discretionary trading and prop firm challenges, entry timing relative to candle closure is just as critical as your price level
FREE
Let us introduce the Heikin Ashi RSI Oscillator! This indicator combines the concepts of Heikin Ashi candles with the RSI (Relative Strength Index) to produce an oscillator-like format that can be used to filter out some of the noise associated with standard RSI readings. This provides traders with a smoother representation of market conditions. Here are some articles to read more about the RSI and Heikin Ashi candles: https://www.investopedia.com/terms/r/rsi.asp https://www.investopedia.com/ter
SafePair Manual Trader Pro MultiPairs EA
Bashar Taisir Saleh Al Zubaidi
SafePair Manual Trader Pro MultiPairs SafePair Manual Trader Pro MultiPairs 是一款先进的 MetaTrader 5 智能交易系统,专为专业手动交易、半自动交易管理、多品种监控、风险规划以及智能市场分析而设计,并通过一个强大的控制面板集中管理。 该 EA 适合需要快速手动执行、结构化风险控制、智能交易辅助和清晰图表决策支持的交易者,同时避免随机信号和缓慢的面板反应。 EA 配备专业的 Daily Mimic Panel ,用户可以直接在图表上管理交易、监控市场状况、控制关键交易功能,并接收智能交易建议。 高级 EA 智能分析引擎 该 EA 现在加入了高级市场智能分析引擎,可通过多项加权因素分析实时市场情况,包括: 趋势方向 多周期确认 价格行为 波动率状态 动能强度 支撑与阻力区域 流动性行为 Fair Value Gap 确认 点差状态 交易时段 交易安全过滤器 市场稳定性评分 根据该分析,EA 会在 Daily Mimic Panel 顶部显示清晰的交易建议: Recommended Action: BUY
GDS Renko Pip ST Chart - Pip-Based Renko Chart Indicator for MetaTrader 5 GDS Renko Pip ST Chart is a pip-based Renko chart indicator for MetaTrader 5. It helps traders build and study cleaner Renko price movement using a practical fixed pip or point-based brick structure. This tool is designed as a Renko chart foundation for manual analysis. It does not predict the market, does not generate buy or sell signals and does not decide whether a trade should be opened. Renko EDGE EA Golden Delta | A
Divergent Stochastic Filter II Catch Reversals Early, Filter Noise, Trade with Confidence The Edge: Why This Stochastic is Different  Every trader knows the Stochastic oscillator. But knowing when to trust its signals, that's the real challenge. The Divergent Stochastic Filter II transforms this classic indicator into a precision reversal detection system by adding critical elements: divergence intelligence, signal filtering and exhaustion detection.  While standard Stochastic oscillators fire s
G-Labs IC Breaker by G-Labs — ICT source and breaker order blocks for MetaTrader 5. Multi-timeframe structural zones, breaker invalidation on close, retest alerts, and per-timeframe colour control on one chart. Marks where opposing liquidity rested before a move and what happens when structure breaks. Source order blocks draw as outlined rectangles from the first opposite-colour candle after a structural break. When price closes through the tracked extreme, the zone flips to a filled breaker bl
Apex Zone Reversal
Joseph Muguai Nguru
Apex Zone Reversal 产品概述 Apex Zone Reversal 是专为 MetaTrader 5 (MT5) 开发的技术分析指标。它旨在帮助交易者根据 ZORRO 框架和市场结构反转来识别市场支撑位、阻力位和反转区。 核心功能 区域绘制 :使用源自 ZORRO 框架的系统逻辑自动识别支撑、阻力 and 反转区。 时间周期过滤 :包含内置参数,可限制在 M1、M2 和 M3 等较小时间周期上的绘制,保持图表清晰。 回撤缩放 :正确地从起点到终点绘制内部分析叠加层。 多资产兼容性 :经过工程设计,可用于各种金融工具,包括黄金 (XAUUSD) 和货币对等主要资产。 规格 平台 :MetaTrader 5 (MT5) 产品类型 :自定义技术指标(编译为 EX5 文件) 语言 :英语(所有输入和消息均为英语)
Advanced HTF Multi
Felipe Monteiro Rodrigues
Advanced HTF Multi 是一款用于 MetaTrader 5 的多时间框架指标,可直接在当前图表上显示更高时间框架的K线。 该指标允许同时监控多个 HTF 结构,方便用户将高时间框架K线与当前图表的价格走势进行比较,而无需频繁切换时间框架。 最多可以配置 8 个独立 HTF 组。 多时间框架显示 每个 HTF 组都可以独立配置: 时间框架 显示状态 Multi 模式中的K线数量 Focus 模式中的K线数量 警报设置 Range Sweep 设置 时间框架和主要组设置可以直接通过指标面板进行修改。 Multi 模式 Multi 模式可以同时显示多个已配置的时间框架。 用户可以在较低执行时间框架上操作时,同时观察不同的市场结构。 每个组都会显示自己的 HTF K线及对应的价格结构。 Focus 模式 Focus 模式可显示选定的 HTF,并增加显示的K线数量。 用户可以通过点击 HTF K线的开盘时间文字,在 Multi 模式与单独 HTF 显示之间切换。 这样无需改变主图表的时间框架即可详细分析特定 HTF。 HTF K线投影 可以选择一个 HTF K线并将其直接投影到主
BlueBoat – Prime Cycle is a technical indicator for MetaTrader 5 that visualizes market cycles based on the Fimathe cycle model (Marcelo Ferreira) . It identifies and displays historic and live cycle structures such as CA, C1, C2, C3, etc., helping traders understand the rhythm and timing of price movement across multiple sessions. This tool is ideal for manual analysis or as a supporting signal in discretionary strategies. Key Features Historical Cycle Analysis – Backtest and visualize as many
Axiom Point
Tatiana Savkevych
Axiom Point — Precision Structural Breakout Indicator Axiom Point is a high-performance analytical indicator designed to identify high-probability reversal zones using price-action behaviour and adaptive balance filtering. The indicator applies a multi-layer analytical model to detect moments when price transitions beyond its normal equilibrium area, indicating a potential shift in market momentum. Unlike conventional trend-following tools, Axiom Point focuses on so-called points of no return —
Momentum Candle MT5 - Professional Trading Indicator Overview Momentum Candle Detector V4 is a powerful and intelligent indicator designed to identify high-probability momentum candles across all timeframes and instruments. Built with advanced filtering technology, this indicator helps traders spot explosive price movements before they happen. Key Features Core Detection System Universal Compatibility: Works on all pairs - Forex (EURUSD, GBPUSD, USDJPY, etc.), Gold (XAUUSD), Bitcoin (BTCUSD), a
FREE
这款多市场、多时间框架扫描器,将趋势、位置和动量综合为一个 0-100 的交易评分,并具备自适应状态检测和内置噪声过滤器。它可同时扫描外汇、加密货币、指数、金属和原油等 10 个交易品种。 完整描述 APEX 多市场扫描器——告别频繁切换图表,一览整个市场动态。 APEX 是一款专业级仪表盘,可同时扫描多达 10 个交易品种——包括外汇主要/次要货币对、加密货币、指数、黄金、白银和原油——并将每个图表上的所有信息简化为一个清晰准确的数字:交易评分(0-100)。 大多数扫描器只会显示交叉线。APEX 不仅能向您展示某个交易品种当前的重要性,更重要的是,它还能告诉您何时应该观望。 运作原理: 市场状态检测 — APEX 首先使用 ADX 和 ATR 将每个交易品种分类到 5 种市场状态之一(趋势、区间震荡、突破、波动、收缩)。这一点至关重要,因为在趋势中有效的策略在区间震荡中可能失效——因此 APEX 不会对所有情况都使用同一套公式。 自适应评分权重 — 一旦确定了市场状态,APEX 会自动重新调整趋势、支撑/阻力和动量在最终得分中的权重。在趋势市场中,趋势强度主导得分。
“可调分形” - 是分形指标的高级版本,非常有用的交易工具! .......................................................................................... - 众所周知,标准分形 MT5 指标根本没有设置 - 这对交易者来说非常不方便。 - 可调分形解决了这个问题 - 它具有所有必要的设置: - 指标的可调周期(建议值 - 高于 7)。 - 价格高点/低点的距离可调。 - 可调分形箭头设计。 - 指标内置移动和 PC 警报。 点击这里查看高质量的交易机器人和指标! 这是仅在此 MQL5 网站上提供的原创产品。 ....................................................
Prime Vortex Pro (MT5) — Multi-Layer Confluence Trend & Reversal Signal Indicator Built natively for MetaTrader 5. Fewer signals. Stronger confluence. Why Prime Vortex Pro Exists Most signal indicators fire on nearly every candle — dozens of arrows a day, most of them noise that pulls traders into weak, low-probability setups. Prime Vortex Pro flips that approach: silence is the default. A signal only appears when multiple, independent layers of market evidence — trend, trend strength, market st
Trendline Rebounce M5
Abd Rahman Bin Muhammad
Trendline Rebounce M5 是 一 款 MetaTrader 5 智能 交易 系统( EA), 用于 在 M5 时间 周期 寻找 趋势 线 回 踩 和 拒绝 形态 蜡烛。 在 开 立 首 个 仓 位 前, 它 会 检查 更高 时间 周期 的 市场 方向 和 结构。 入 场 评估 结合 五项 条件: EMA 趋势、 已 确认 的 摆动 结构、 趋势 线 回 踩、 拒绝 形态 蜡烛 以及 RSI 动能。 默认 最低 入 场 评 分为 四分。 在 默认 设置 下, EMA 趋势 和 拒绝 形态 蜡烛 是 必需 条件。 对于 首次 入 场, EA 可 检查 H1 趋势 方向、 H1 趋势 运行 情况、 H1 潜在 或 已 确认 的 双 顶 和 双 底 形态, 以及 H1 和 H4 上 与 交易 方向 相反 的 趋势 线。 如果 更高 时间 周期 的 市场 环境 不 支持 M5 信号, 这些 过滤 条件 可能 阻止 入 场。 可 选 的 加 仓 功能 会 在 价格 朝 不利 于 现有 持 仓 组合 的 方向 移动 后, 寻找 支撑 位 或 阻力 位。 加 仓 必须 触 及 相应
FREE
SuperTrend Indicator for MT5
Vijaykumar Jayantilal Panchal
Supertrend 是一種相對不受歡迎的技術指標,如上所述,由 Olivier Sebam 開發,旨在幫助交易者識別趨勢並了解何時買賣金融資產。該指標在 TradingView 和 MetaTrader 中未作為默認設置。不過,您仍然可以在市場上找到定制的 Supertrend 指標。 當應用於圖表時,超級趨勢指標以其兩種顏色可見。雖然它們可以更改,但默認顏色通常是紅色和綠色。當它是綠色時,是買入資產的信號,當它是紅色時,是賣出資產的信號。 超級趨勢指標適用於所有時間線。它可以在較短的時間範圍內工作,如 5 分鐘或更長的圖表,如每日和每週圖表。 識別買賣信號 如上所示,買入和賣出信號在超級趨勢指標中得到了很好的標記。當價格高於指標的綠色部分時,會出現買入信號。 另一方面,當它移動到指標的紅色部分下方時,就會看到賣出信號。但是,進行多時間框架分析將幫助您確定最佳支撐位和阻力位。 超級趨勢指標的優缺點 超級趨勢指標的優點包括: 易於解釋:即使對於初學者來說,計算也不是很複雜。 預測相當準確:在超級趨勢是可用的最可靠指標之一的趨勢市場中尤其如此。 易於配置:由於輸入變量
适用于MT5平台的“WPR双均线指标”,无重绘。 - WPR本身就是短线交易的最佳震荡指标之一。 - “WPR双均线指标”允许您查看WPR震荡指标的快慢均线。 - 该指标能够帮助您及早发现价格回调。 - 此指标的参数设置非常简单,适用于任何时间周期。 - 您可以在图片中看到买入和卖出的入场条件。 - 通过 PC 和移动设备接收 WPR MAs 交叉警报。 买入信号示例: (1) - 如果快均线向上穿过慢均线,且WPR值低于-50:开立买单。 (2) - 一旦WPR值进入超买区域,高于-20:平仓。 卖出信号示例: (1) - 如果快均线向下穿过慢均线,且WPR值高于-50:开立卖单。 (2) - 一旦 WPR 值低于 -80 进入超卖区域:平仓卖单。 点击这里查看高质量的交易机器人和指标! 这是仅在 MQL5 网站上提供的原创产品。
通过 Pip Movement Alert MT5 领先市场动能,这是一款多币种指标,专为跟踪和提醒交易者多个符号的精确点数移动而设计,适用于外汇、股票、加密货币和商品交易。在 Forex Factory 和 Reddit 的 r/Forex 等交易社区中备受赞誉,并在 Investopedia 和 TradingView 的讨论中因其检测突发市场变化的能力而受到关注,该指标是希望利用快速价格变化的交易者的必备工具。用户报告称,识别基于点数的重大移动(例如,10点增量)的可靠性高达95%,许多人指出通过利用实时警报捕捉波动性激增,交易时机提高了20-30%。主要优势包括多币种监控、可定制的点数阈值以及轻量级设计,无需持续分析图表即可简化跟踪,非常适合剥头皮、日内交易和波段交易者。 Pip Movement Alert MT5 监控用户定义的符号(默认:EURUSD、GBPUSD、USDJPY、USDCHF),并在价格移动指定点数值(默认:10点)时触发警报,检测绝对价格水平(例如,1.178500、1.178600)。它使用实时计算来识别上升或下降移动,通过弹出窗口、推送通知和电子邮件
FREE
Divergence Hunter
Rizwan Akram
5 (3)
Divergence Hunter - Professional Multi-Oscillator Divergence Detection System Overview Divergence Hunter is a professional-grade technical indicator designed to automatically detect and visualize price-oscillator divergences across multiple timeframes. Built for serious traders who understand the power of divergence trading, this indicator combines precision detection algorithms with an intuitive visual interface. Key Features Multiple Oscillator Support: RSI (Relative Strength Index) MACD (Mo
FREE
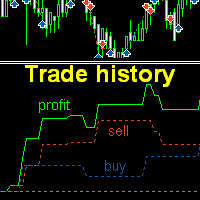
Trade history
Andriy Konovalov
5 (2)
The indicator plots charts of profit taken at the Close of candles for closed (or partially closed) long and short positions individually. The indicator allows to filter deals by the current symbol, specified expert ID (magic number) and the presence (absence) of a substring in a deal comment, to set the start time and the periodicity of profit reset (daily, weekly or monthly) to calculate the profit chart. The indicator also displays the floating (not fixed) profit of the opened positions at th
Enhanced Elliott Wave Pro
Magdy Khames Aly Hasan
Enhanced Elliott Wave Pro – Advanced Market Structure & Wave Analysis   Enhanced Elliott Wave Pro is a lightweight, institutional-grade MT5 indicator that eliminates chart clutter by detecting and displaying only the current, active market structure: the 1-2-3-4-5 Impulse wave and the subsequent A-B-C Correction.   Built with classic Prechter wave rules and ATR-adaptive pivot detection, it delivers clean, real-time wave counts without bogging down your terminal.   ――――――――――――――――――――――――――――
Short Description Swing Timing Breakout EA is a smart Expert Advisor for MetaTrader 5 that combines trend filtering, momentum timing, and dynamic risk management to capture high-probability swing and breakout opportunities. Full Description Swing Timing Breakout EA is a professional trading robot designed for MetaTrader 5, suitable for traders who want a balance between automation, control, and disciplined risk management. This EA uses a trend-following and momentum confirmation approach ,
CapitalSol Forex MTF Scanner MetaTrader 5 多时间框架外汇趋势扫描器 CapitalSol Forex MTF Scanner 是一款多品种、多时间框架市场分析指标,旨在直接通过 MetaTrader 5 提供结构化的外汇市场方向概览。 交易者无需逐个打开并检查多个货币对图表。扫描器可以在一个紧凑的仪表板中显示所选外汇品种,并同时分析多个时间框架上的市场方向。 标准仪表板使用 M15、H1、H4 和 D1,并将每个市场和时间框架分类为 BULL、BEAR、NEUTRAL 或 LOADING。 该指标的目的并不是自动做出交易决策,而是帮助交易者更高效地识别不同时间框架之间的趋势一致性和多时间框架共振。 工作原理 趋势分类基于 EMA 20 和 EMA 50。 BULL: EMA 20 位于 EMA 50 上方。 BEAR: EMA 20 位于 EMA 50 下方。 NEUTRAL: 当前没有有效的方向分类。 LOADING: 所需的历史数据或指标数据尚未完全加载。 扫描器使用已经确认并收盘的K线进行分析。因此,趋势分类不会
Show Pips for MT5
Roman Podpora
4.5 (32)
对于那些总是想了解帐户当前情况的人来说,此信息指示器将很有用。 VERSION MT 4 -   More useful indicators 该指标显示诸如利润点数、百分比和货币等数据,以及当前货币对的点差以及柱在当前时间范围内收盘的时间。 有多种选项可用于将信息线放置在图表上: 价格右侧(运行在价格后面); 作为评论(在图表的左上角); 在屏幕的选定角落。 还可以选择信息分隔符: | / \ # 该指标易于使用且信息丰富。可以在设置中禁用不必要的信息项目。 设置 外观类型     - 信息行的显示类型。有以下三种选择: 跟随价格     - 遵循价格; 作为评论     - 作为评论; 在屏幕的选定角落     - 在屏幕的选定角落。 附件图角     - 如果您选择屏幕选定角的显示类型,则此项目允许您选择四个捕捉角之一; 显示利润?       - 该参数负责以存款货币显示利润; 以百分比显示利润?       - 该参数负责以百分比形式显示利润; 显示传播?       - 该参数负责显示当前点差; 显示酒吧关闭时间?       - 该参数负责显示柱关闭之前的时间; 文字颜
FREE
EUR 8 of 8
Tomas Michalek
Plug & Play portfolio - series of high-quality EURUSD H1 strategies for maximized success. The eighth strategy, the last one from the EUR-8 portfolio , uses BollingerBands mean reversal method for setting up the pending order. To have a whole portfolio of strategies, which trades for you is incredibly efficient, don't miss that opportunity. Check my other strategies today! and assemble your portfolio. Benefits for you Plug & Play system , designed to have   simple initial setup . That's saved
Knowledge of the strength and weakness of each currency is vital for every forex trader. Our   Currency Strength Meter indicator   measures the strength of eight major currencies (USD, EUR, GBP, CHF, JPY, CAD, AUD, NZD) by using the Relative Strength Index indicator, also known as RSI. The Currency Strength Meter indicator shows you, simply and quickly, when a currency is oversold, overbought, or in "normal area". This way, you can identify which currency is the strongest and the weakest. Our
Phantom ICT
Thanaphat Jantawee
5 (1)
PHANTOM ICT MTF EA is an automated trading system designed for XAUUSD (Gold), using a multi-timeframe analysis approach. The system focuses on identifying structured market conditions and executing trades based on selective entry logic. It is not designed for frequent trading, but instead waits for specific conditions before opening positions. Core Features Multi-timeframe analysis (D1 / H4 / M5) Selective trade entry based on structured conditions Designed for short-term execution on M5 timefr
FREE
Quant Lattice
Dilwyn Tng
5 (1)
一个价格,两+1种策略 实时信号:   QL Drive   |   QL Steady          设置文件 Quant Lattice (量子格) 是什么 Quant Lattice (量子格) 是一款全自动智能交易系统 (Expert Advisor),只交易一个货币对:AUDCAD,内含两种不同策略——Steady (稳健) 与 Drive (进取)。  你只需安装一次,选择一种策略,设定好资金管理,它便会自动交易,无需你手动干预。 为什么选 AUDCAD?  澳元和加元都是与大宗商品挂钩的货币,走势高度同步。AUDCAD 以安静的区间震荡和可靠的均值回归著称。Quant Lattice (量子格) 正是为这一货币对从零打造的——这个货币对我了如指掌。 一切均已预先配置。无需调整任何参数(只需设定你的资金管理)。  选 Steady。或选 Drive。 大多数 EA 只给你一种策略,然后寄望它能适合你的账户。Quant Lattice (量子格) 给你两种,只需一个下拉菜单即可切换。 Steady (稳健) 策略  适合长期复利、注重增长的交易者,资金曲线平
Smart Fair Value Gap Pro
Joao Luiz Savioli Filho
Unlock the power of Smart Money Concepts (SMC) with the cleanest FVG indicator on the market. Smart FVG Pro is not just another gap detector. It is designed for professional traders who need to filter out noise and focus on high-probability reversal zones. Unlike standard indicators that clutter your chart with every minor gap, Smart FVG Pro uses advanced filtering logic (Trend + Volatility) and a unique "Smart Mitigation" system to automatically remove invalidated zones, keeping your chart clea
该产品的买家也购买
Trend Sniper X
Sarvarbek Abduvoxobov
4.9 (41)
Trend Sniper X 是一款适用于 MetaTrader 5 的多周期趋势跟踪指标,可帮助交易者清晰精准地识别趋势方向和潜在的反转点。 适用于 MT4: https://www.mql5.com/en/market/product/193245 价格信息: 当前价格为促销价,随着后续更新和新功能的推出,价格可能会有所变动。 赠品优惠: 购买后联系作者,即可免费获取该指标的 Auto-Trade Assistant EA(自动交易助手 EA)。 Code2Profit 频道 通过多时间框架分析掌控市场! 如何使用 Trend Sniper X 最大化您的胜率:核心规则与交易时段技巧 技术规格 平台 MetaTrader 5 指标类型 多时间周期趋势指标 运行时间周期 任何图表时间周期,可独立选择更高的时间周期 (M1–MN1) 主要交易品种 外汇、黄金 (XAUUSD) 及其他差价合约 (CFD) 推荐账户 任何账户类型 可视化 彩色趋势蜡烛 (买入/卖出/微弱/变化) + 买入/卖出箭头 附加模块 交易时段方框 (悉尼、东京、伦敦、纽约) 主要功能 多时间周期趋势分析: 直接在
Smart Trend Trading System — MetaTrader 5 购买后,请在 MQL5 上给我发消息,即可免费获得 Smart Universal Expert Advisor,以及在线课程、PDF 手册和私人群组访问权限。 STTS 将趋势方向、入场和出场信号、反转区域及重要价格水平集中呈现在图表上。您可以根据系统手动交易,也可以连接单独的兼容 EA,按照您选择的设置自动执行交易。 一套系统,四种交易思路 STTS 将交易方法分为四大类: • 剥头皮交易 — 跟踪短期信号和市场波动。 • 趋势交易 — 评估方向,寻找趋势中的交易机会。 • 反转交易 — 识别潜在的转折区域和方向变化。 • 成交量交易 — 利用成交量相关信息评估市场活跃程度。 入场和出场箭头、趋势信息、支撑与阻力位及反转区域,帮助您直接在图表上分析交易形态。 先从一种方法开始。了解其信号和设置后,再探索其他方法。 从信号到自动化 Smart Universal Expert Advisor 可连接 STTS,让您自动执行受支持的交易信号。 启用自动交易前,请配置指标连接、仓位大小和交易管理设置
Zoryk Gold
Reda El Koutbane
5 (15)
折扣将在 24 小时后结束——下一价格为 69 美元 ZORYK — MetaTrader 5 专用高级 XAUUSD 黄金信号系统 你一定熟悉这种感觉。 你花了很多时间分析黄金,等待合适的入场机会。终于开仓后,价格却立刻朝相反方向移动。你过早平仓、移动止损,或者只犹豫了几秒钟。随后,市场却在没有你的情况下到达了你原本预期的目标。 问题并不总是方向判断错误。 真正的问题是缺乏确定性。 你不知道准确的入场位置在哪里。 你不知道什么时候交易逻辑已经失效。 你不知道应该先锁定较近的利润,还是继续等待更大的行情。 你也不知道当前信号是否足够强,还是自己只是在强行寻找交易机会。 黄金市场变化非常快。一个没有明确计划的好想法,可能在几秒钟内变成错误的交易决定。 ZORYK 正是为了解决这个问题而开发。 什么是 ZORYK ZORYK 是一套完整的 XAUUSD 黄金信号与交易计划系统,专门为 MetaTrader 5  和 M5 时间周期 开发。 它不是一个只显示 BUY 或 SELL 箭头,然后让你独自决定其余所有内容的简单指标。 每个确认后的信号都可以在图表上显示完整的可视化交易计划,包
SuperScalp Pro
Van Minh Nguyen
4.56 (36)
SuperScalp Pro - Professional Multi-Layer Confluence Scalping System SuperScalp Pro 是一款高级剥头皮交易指标,在经典 Supertrend 的基础上加入了多个智能确认过滤器。它可以帮助您识别概率更高的 Buy/Sell 交易机会,同时显著减少虚假信号。 清晰的 Buy 和 Sell 箭头会直接显示在图表上,基于 ATR 的 Stop Loss 和 Take Profit 水平会实时自动计算。 购买后,请联系我获取设置指导和推荐配置。 使用 SuperScalp Pro Auto Trader 轻松实现信号自动化: [Auto Trader] 下载推荐设置文件: [Set File] 完整文档请参阅产品博客: [User Guide] 加入官方频道获取最新更新: [Official Channel] SuperScalp Pro 如何工作? 只有当多个确认层同时一致时,指标才会生成交易信号(趋势 + 动能 + 成交量 + 波动率)。 您可以手动交易,也可以连接 SuperScalp Pro Auto Tr
全新王者降临 - 指标 + 订单管理提示(TP1 + TP2 + TP3)+ 可选 Telegram 信号发送器 INCLUDED(免费) (完整交易与信号系统) 我们最强的黄金 EA: Gold Slayer 该指标包含先进的交易策略、可自定义订单管理系统,以及结合 Envelope 扩展的均值回归系统,并通过 RSI 等多重智能确认过滤器进行验证,以捕捉高概率反转入场机会,提供 BUY 与 SELL 信号。 你不仅能够学习如何交易,还能学会如何高效管理多个仓位,并利用之前盈利的持仓来覆盖亏损交易。 专为 M5 周期打造并优化,在 BTCUSD 和 XAUUSD 上表现尤为出色,因为这些市场的流动性能够让信号更加干净、可靠。 该指标会自动生成清晰的多头(Long)与空头(Short)信号,同时基于 ATR 自动计算入场位、止损位和止盈位,让风险管理从一开始就融入系统之中。 多 TP 系统设有三个渐进式目标位,你可以在 TP1 锁定部分利润、在 TP2 继续持仓,并在更大的行情中将仓位持有至 TP3,而这正是平均风险回报比真正开始大放异彩的地方。 默认参数开箱即用,已经针对稳定表现进行
SMC Intraday Formula
VividMind Digital Solutions
5 (26)
让我们先坦诚一点。 没有任何一个指标可以单独让你实现盈利。如果有人告诉你可以,那他是在向你兜售一个梦想。任何显示完美买卖箭头的指标都可以被做得看起来毫无瑕疵——只需要放大历史中的某一段并截取成功交易的截图。我们不会这样做。 SMC Intraday Formula 是一个工具。 它为你读取市场结构,标记出概率最高的价格区域,并用简单直白的语言准确告诉你当前智能资金的行为轨迹。你仍然需要做决定。你仍然需要执行交易。但现在,你是带着精确性执行,而不是靠希望。 我们已经在黄金(XAUUSD)以及主要外汇货币对的日内剥头皮交易中使用该指标将近三年。这是我们在 M1、M5、M15 和 M30 上的日常主力工具。它之所以有效,是因为它不试图预测未来——它展示的是当前正在形成的高概率交易机会,并解释 为什么 。 它与其他所有指标有什么不同? 大多数交易指标只做一件事。移动平均线交叉。振荡指标触及某个水平。出现一个箭头。你进场交易。你亏损。你责怪指标。重复。 SMC Intraday Formula 将多个机构级概念整合为一个统一的市场解读: - 斐波那契共振引擎 不只是普通的斐波那契水平——该指标
GoldenX Entry MT5
VividMind Digital Solutions
5 (16)
GoldenX Entry 是一款用于 MT5 的指标,包含自适应 Smart Entry Trend 算法、信号评分系统、市场状态识别器以及波动率过滤器。每个信号都包含计算得出的入场位、三个止盈位(TP1、TP2、TP3)以及止损位。它基于多个分析层构建,旨在适应不同市场条件,将多层分析系统与内置优化器及统计跟踪系统相结合。该指标基于风险收益比(RR)指标和历史交易行为提供量化分析。 开始使用非常简单——在所选时间周期上运行优化器,然后在图表上开始使用该指标。 核心功能 GoldenX Entry 将信号引擎与内置交易管理及历史统计跟踪整合在同一图表中: - 内置优化器: 优化器可在图表上单击运行。它通过两阶段搜索流程测试200种参数组合——先进行探索,再进行优化——并在完成后自动应用选定配置。结果会按时间周期缓存,因此当返回已优化的周期时,会立即恢复相同设置。 - 黄金品种自动周期识别: 将指标加载到任何 XAUUSD 图表(M1 到月线)。系统会自动识别当前周期并加载对应预设。共包含9个时间周期配置文件,专为黄金在标准周期上优化设计。切换周期时,参数会自动调整。 - 资金参考面
Gann Made Easy MT5
Oleg Rodin
5 (10)
Gann Made Easy   是一个专业且易于使用的外汇交易系统,它基于使用先生理论的最佳交易原则。 W.D.江恩。该指标提供准确的买入和卖出信号,包括止损和获利水平。您甚至可以使用推送通知在旅途中进行交易。 购买后请联系我,即可免费获得交易指导和超棒的额外指标! 您可能已经多次听说过江恩交易方法。通常 Gann 的理论不仅对于新手交易者而且对于那些已经有一定交易经验的人来说都是非常复杂的东西。这是因为江恩的交易方法在理论上并不那么容易应用。我花了几年时间来完善这些知识,并将最好的原则应用到我的外汇指标中。 该指标非常易于应用。您所需要的只是将其附加到您的图表并遵循简单的交易建议。该指标不断进行市场分析工作并寻找交易机会。当它检测到一个好的入口点时,它会为您提供一个箭头信号。该指标还显示止损和获利水平。 换句话说,当您像先生一样进行交易时,该指标会为您提供最佳江恩建议。江恩亲自告诉你此时此刻该做什么。但最好的部分是您不需要了解任何有关江恩交易原则的知识,因为该指标会为您完成整个市场分析工作。
Neuro Poseidon MT5
Daria Rezueva
4.75 (52)
Neuro Poseidon is a new indicator by Daria Rezueva. It combines precise trading signals with adaptive TP/SL levels - creating best possible trades as a result! Message me and get  Neuro Poseidon Assistant  as a gift to automize your trading process! What makes it stand out? 1. Proven profitability on all assets and timeframes 2. Only confirmed BUY and SELL signals present on the chart 3. Adaptive TP & SL levels generated by the software for each trade 4. Easy to understand - suitable for al
Entry Points Pro for MT5
Yury Orlov
4.52 (151)
传奇回归:Entry Points Pro 10。 这款传奇指标曾 3 年稳居 MQL5 Market 前三,如今全面重启。 数百条热情好评(两个版本合计 589 条),每天有数千名交易者用它交易,演示版下载 31,000+   MT4+MT5  次。 五年来我读过你们的每一条评价——在第 10 版里,我没有给出许诺,而是把答案直接做进了产品。指标作者自 1999 年入市, 珍视诚信、自己的声誉和自己的客户 。 Entry Points Pro 给出的入场信号严格不重绘。 而且这一次不再只是作者的一面之词,而是可验证的事实:确认信号只在 K 线收盘后标出,自动化测试记录到 零重绘 (在 EURUSD、XAUUSD 和 BTCUSD 上共 2,486,568 次不变量检查——0 次违规)。测试方法完全公开——您可以在策略测试器中自行复现。 购买后请务必第一时间给我发私信。 我会发给您 扩展版说明书《交易者圣经》 ——使用本指标交易的完整指南——并告诉您如何免费获得 赠品:市场扫描器 ,它能同时分析多个品种和多个时间周期,并在一个界面上显示 Entry Points Pro 此刻在哪里表现
ARIPoint
Temirlan Kdyrkhan
1 (4)
ARIPoint is a powerful trading companion designed to generate high-probability entry signals with dynamic TP/SL/DP levels based on volatility. Built-in performance tracking shows win/loss stats, PP1/PP2 hits, and success rates all updated live. Key Features: Buy/Sell signals with adaptive volatility bands Real-time TP/SL/DP levels based on ATR Built-in MA Filter with optional ATR/StdDev volatility Performance stats panel (Success, Profit/Loss, PP1/PP2) Alerts via popup, sound, push, or email Cu
Auto Optimized SpeedAngle 是一款机构级的动量向量化系统,通过持续的前瞻优化(Walk-Forward Optimization, WFO)彻底消除了曲线拟合(curve-fitting)。该指标没有采用在市场 状态转换时容易失效的静态输入参数,而是利用出样外验证(Out-of-Sample, OOS) dynamically 动态重新校准设置,从而确保显示的 信号代表真正的统计优势,而非历史巧合。 核心机构级架构 前瞻优化引擎(Walk-Forward Optimization Engine): 核心算法持续扫描数千种回溯周期(lookback)与阈值组合,严格将数据划分为样本内(in-sample)和样本外(out-of-sample)。只有当参数配置在未知数据环境中证明具备数学优越性时,系统才会对其进行 adoption。 量化目标函数(Quantitative Objective Functions): 优化引擎不一味追求绝对毛利,而是聚焦于机构级的稳定性指标。用户可针对系统质量数(SQN)、期望值(每笔交易的平均 R 倍数)或净 R 值进行优化,从而优
Welcome to ENTRY IN THE ZONE AND SMC MULTI TIMEFRAME  SPECIAL BENEFIT / FOR OUR MQL5 CUSTOMERS FREE ACCESS TO THE NEW TOOL  — COMING SOON — Learn more on our official website  : https://www.fableedge.net Entry In The Zone and SMC Multi Timeframe is a real-time market analysis tool based on Smart Money Concepts (SMC) , designed to analyze market structure, price direction, and key trading zones. It supports both Single-Timeframe and Multi-Timeframe Analysis , providing a clearer view of overall m
Unix Scalper
Issam Kassas
4 (4)
Unix Scalper — MetaTrader 5 购买后,请在 MQL5 上给我发消息,即可免费获得 Smart Universal Expert Advisor,以及在线课程、PDF 手册和私人群组访问权限。 发现交易形态,看清交易计划,选择执行方式。 UNIX Scalper 将市场分析、BUY/SELL/WAIT 决策以及 Entry、Stop Loss、TP1 和 TP2 水平集中在一个清晰的面板中。 看清信号与交易计划 • 明确的决策:BUY、SELL 或 WAIT。 • 明确的价格水平:Entry、Stop Loss、TP1 和 TP2。 • 多时间周期概览:比较面板中各时间周期的信号。 • 辅助分析:趋势、动量、成交量、波动率、支撑与阻力,以及市场质量。 • 灵活的布局:Minimized、Compact、Standard 或 Full。 查看信号,检查价格水平,再判断该交易形态是否符合您的交易规则。 从黄金和比特币开始 建议首先使用的交易品种:XAUUSD 和 BTCUSD。 探索短期剥头皮交易和较高时间周期分析。选择历史K线范围,通过表现曲线查看所选设置
FiboSniper Pro
Van Minh Nguyen
5 (3)
FiboSniper Pro – Multi-Filter Fibonacci System with Auto SL/TP and Control Panel FiboSniper Pro 是一款技术指标,将动态 Fibonacci Envelopes 与多个确认过滤器相结合,以生成经过筛选的 Buy 和 Sell 信号。Fibonacci 水平基于 Moving Average 和 ATR 计算,然后通过 ADX、EMA、RSI、ATR、Volume、Time 和 Candle 结构进行过滤。该指标直接在图表上显示基于 ATR 自动计算的 Stop Loss 和 Take Profit 水平,并提供交互式控制面板,以便快速调整参数。 购买后,请联系我以获取推荐的设置文件和详细使用说明。 使用 Auto Trader X 自动执行 FiboSniper Pro 信号: [Auto Trader X] 用户指南和设置文件: [Click here] 加入官方频道获取最新更新: [Click here] 专为偏好结构化入场和清晰风险管理的交易者设计,适用于 Gold (XAUUSD)、B
M1 Sniper MT5
Oleg Rodin
5 (7)
M1 SNIPER   是一款易于使用的交易指标系统。它是一个专为 M1 时间框架设计的箭头指标。该指标可以作为独立的系统在 M1 时间框架下进行剥头皮交易,也可以作为您现有交易系统的一部分使用。虽然该交易系统专为 M1 时间框架交易而设计,但它也可以用于其他时间框架。我最初设计此方法是为了交易 XAUUSD 和 BTCUSD。但我发现这种方法在其他市场交易中也同样有用。 指标信号既可以顺势交易,也可以逆势交易。我教授一种特殊的交易技巧,帮助您利用指标信号进行双向交易。该方法基于使用特殊的动态支撑位和阻力位区域。 购买后,您可以立即下载 M1 SNIPER 箭头指标。此外,我还为所有 M1 SNIPER 工具用户免费提供下方屏幕截图所示的 Apollo Dynamic SR 指标!这两个指标的组合可以帮助您更轻松、更准确地利用 M1 时间框架进行交易。 购买后请联系我,免费获取交易提示和奖励指标! 祝您交易成功!
Gold Entry Sniper
Tahir Mehmood
5 (21)
Gold Entry Sniper – 专业多周期ATR黄金交易仪表盘,适合黄金剥头皮与波段交易 Gold Entry Sniper 是一款先进的 MetaTrader 5 指标,旨在为 XAUUSD 及其他品种提供精准的 买/卖信号 。基于 ATR 移动止损逻辑 和 多周期分析仪表盘 ,适合剥头皮交易者与波段交易者,帮助识别 高概率黄金入场点 。 主要功能与优势 多周期信号分析 – 同时显示 M1、M5、M15 趋势方向。 基于ATR的动态止损 – 根据波动性自动调整。 专业图表仪表盘 – 展示信号状态、ATR水平、线性回归中线和交易方向。 清晰买卖标记 – 自动箭头与文字标签提示。 离场提示与交易管理 – 自动检测离场信号锁定利润。 全面自定义 – 调整仪表盘位置、颜色、字体及参数。 专为黄金优化 – 适用于 M1至M15 黄金剥头皮 ,也适合外汇、指数与加密货币。 为什么选择 Gold Entry Sniper? 为追求 快速、精准、可视化交易决策 的交易者打造,ATR 与多周期确认结合,帮助你抓住 最佳黄金入场点
让您的交易优势尽在视野之中! M5 Sniper 是 MeanFX 推出的一款全新指标。它将 精准的交易信号 与 自适应 TP/SL 水平 相结合——从而创造出最佳的统计交易机会! 每售出 5 份,价格上涨一次,下一价格为 69$ 购买后请给我发消息,以获取技巧/指南和奖励 EA 它有哪些突出优势? 经过验证的统计表现 ,适用于 Gold XAUUSD( 几乎适用于每一种资产 ,专注于掌握一个时间周期,而不是试图面面俱到却无法获得稳定的结果) 每天每个交易品种 1 至 8 笔交易 ,具有较高的胜率百分比,并让所有统计优势站在我们这一边 图表上 仅显示已确认的 BUY 和 SELL 信号 自适应 TP 和 SL 水平 ,由指标针对每笔交易生成 平均胜率 75%+ 平均 Signal Ratio 最低 1.1+ 警报 和通知也会发送至 手机 **适合 Prop Firm(资金管理公司)**的交易方式 易于理解——适合 所有经验水平 的交易者 创作者提供的个人支持 100% 不重绘、不重新绘制、不滞后 奖励自动化 Expert Advisor(EA) 背后的策略: M5 Sniper 基于
Divergence Bomber
Ihor Otkydach
4.89 (94)
购买该指标的每位用户将额外免费获得以下内容: 原创工具“Bomber Utility”,该工具会自动跟踪每一笔交易,设置止损和止盈点,并根据策略规则自动平仓; 适用于不同交易品种的指标设置文件(Set 文件); 三种不同风险模式下的 Bomber Utility 设置文件:“最低风险”、“平衡风险” 和 “观望策略”; 一套详细的 视频操作手册,帮助您快速完成安装、配置并开始使用本交易系统。 注意: 要获取以上所有赠品,请通过 MQL5 的私人消息系统联系卖家。 我为您介绍原创的自定义指标 “Divergence Bomber”(背离轰炸机),它是一套基于 MACD 背离交易策略 的“全功能”交易系统。 该技术指标的主要任务是识别 价格与 MACD 指标之间的背离,并发出交易信号(包括推送通知),指示未来价格可能的运动方向。平均而言,这些信号的准确率超过 98%。有关该指标如何工作的详细说明,请观看本页面上的视频演示。 该系统使用 止损订单 和 动态回撤平仓机制 来管理交易。 Divergence Bomber 指标的主要特点: 支持交易的品种: AUDCAD、AUDCHF、AUDS
FX Trend MT5 NG
Daniel Stein
5 (6)
FX Trend NG:新一代多市场趋势智能分析工具 概述 FX Trend NG 是一款专业的多时间周期趋势分析与市场监控工具,帮助您在几秒钟内全面了解市场结构。 无需在多个图表之间来回切换,您可以立即看到哪些品种处于趋势中、哪里动能正在减弱,以及哪些时间周期之间存在强烈共振。 限时发布优惠 – 仅需 $30(6个月) 或 $80 终身授权 即可拥有 FX Trend NG 。 已经是 Stein Investments 客户? -> 发送消息 以获取专属客户群访问权限。 需要帮助或安装指导? -> 请访问 Stein Investments 官方页面 。 1. FX Trend NG 的核心优势 三状态趋势逻辑 —— 不只是 Buy 或 Sell • 大多数指标仅显示两种状态:Buy 或 Sell。 • FX Trend NG 增加第三种状态: Fade 。 • Fade 表示趋势强度正在减弱,在完全反转之前提前发出信号。 这种结构化逻辑让您看到趋势变化过程,而不仅仅是简单方向信号。 多时间周期分析(M1 至 MN1) • 从短线交易到中长线交易全面覆盖。 • 快速识别趋势
Tokyo mt5 Indicator
Vasiliy Strukov
5 (7)
Tokyo Indicator(东京指标)直观地展示了趋势方向、潜在交易信号及市场状况。 其采用颜色编码的阶梯式趋势线,以蓝色标识看涨阶段,以洋红色标识看跌阶段。配套的方向箭头会在趋势发生变化时,标示出潜在的买入与卖出机会。 内置的综合仪表盘将当前信号、市场倾向、动能、波动率及信号质量整合于同一视图中,方便交易者在观察价格走势的同时评估指标数据,无需在不同面板间切换。 凭借清晰的图表显示和简洁的市场概览,Tokyo Indicator 支持以系统化的方式进行趋势分析与交易确认。 适用于任何时间周期及各类交易品种,尤其适合黄金交易。 购买后请立即联系我,以获取专属赠品!您可以免费获得我们的“强力支撑与趋势扫描”(Strong Support and Trend Scanner)指标,请私信我! 设置说明与使用手册请见此处。 请注意:我不会在 Telegram 上出售我的 EA 或特殊参数设置(set files);我的 EA 仅在 Mql5 平台上提供,而参数设置文件仅在我的博客(此处链接)上发布。请务必警惕诈骗,切勿从他人处购买任何参数设置! 设置 ShowHUD —— 在图表上显示
RelicusRoad Pro MT5
Relicus LLC
4.96 (24)
RelicusRoad Pro: 量化市场操作系统 终身访问限时 70% 折扣 - 加入 2,000+ 交易员社区 为什么大多数交易者即使拥有“完美”指标也会失败? 因为他们在真空中交易 单一概念 。没有背景的信号是赌博。要持续获胜,您需要 共振 (CONFLUENCE) 。 RelicusRoad Pro 不是一个简单的箭头指标。它是一个完整的 量化市场生态系统 。它描绘价格运行的“公允价值之路”,区分市场噪音和真实的结构性突破。 停止猜测。开始用机构级“路”逻辑进行交易。 核心引擎:“Road” (路) 算法 系统的核心是 Road Algo ,一个实时适应市场条件的动态波动率通道。它投射出 安全线 (平衡) 和价格可能反转的 扩展水平 。 Simple Road: 典型市场的标准结构映射。 Smooth Road: 针对震荡盘整的降噪计算。 Breakout Road: 专为识别波动率扩张和爆发性走势而调整。 1. 算法动量与确认 我们的“剥头皮箭头”不只是简单的交叉。它们利用 高阶多项式逻辑 过滤噪音,确保信号与主周期一致。我们检测动量、价格行为和 Road 结构汇聚的精确入场
Market Structure Order Block Dashboard MT5 是一款专为希望直接在图表上解读市场结构和主要价格反应区域的交易者设计的MT5指标。它结合了BOS、ChoCH、订单块(Order Blocks)、公允价值缺口(FVG)、流动性、Kill Zones、成交量分布图以及一个紧凑的面板,便于快速分析。 本指标面向使用市场结构、ICT和Smart Money概念作为决策框架的交易者。它可以帮助以更结构化的方式识别趋势延续、可能的反转、价格失衡、流动性目标和关注区域。 面向买家的资源 购买后可通过MQL5私信申请获取完整的PDF使用指南和参数配置建议。通过MQL5私信提供直接技术支持。 1.20版本带来两项重要新增: Pending BOS / Pending ChoCH 检测 和 可拖动面板 (按住面板标题栏即可将其拖动到图表任意位置,不影响图表本身)。当K线收于前一摆动点之外时,Pending Breaks 立即显示待确认的结构突破,无需等待经典的摆动确认。 重要 本产品仅为指标。它不会自动开仓、平仓或管理仓位。它不是EA(智能交易系统)。 主要功能 市场
Scalper Vault   是一个专业的剥头皮系统,为您提供成功剥头皮所需的一切。该指标是一个完整的交易系统,可供外汇和二元期权交易者使用。推荐的时间范围是 M5。 该系统为您提供趋势方向的准确箭头信号。它还为您提供顶部和底部信号以及江恩市场水平。无论您拥有何种交易经验,该系统都易于使用。您只需要遵循简单的规则并每天重复该过程。 建议将此系统用于主要货币对。感谢您的关注! 请注意,该指标在策略测试器中可能无法正常工作。因此,我建议仅在模拟或真实账户的真实交易条件下使用该系统。 指示器提供所有类型的警报,包括推送通知。 购买指标后请与我联系。我将免费与您分享我的个人交易建议和出色的奖励指标! 祝您交易愉快,盈利!
您好,交易员! 大多数散户交易者依赖于滞后的网页脚本。真正具有交易优势需要机构化的架构。 Astro AI 指标并非标准的图表叠加层。它是一个编译后的神经网络,包含两个代理,直接运行在您的终端上。 以下是该系统背后的具体技术: 1. 代理 1:分析师(图神经网络 - GNN) 市场并非孤立的价格柱;它们是相互关联的数据网络。 功能:代理 1 使用图神经网络来映射这些复杂的非线性关系。 优势:标准指标仅考虑单一的历史移动平均线,而我们的 GNN 可以实时处理深层的市场结构关系,在散户交易量发挥作用之前揭示隐藏的相关性。 2. 代理 2:执行器(近端策略优化 - PPO) 模式识别只是成功的一半。基于当前市场波动做出正确的决策,才是预测模型与滞后模型之间的区别所在。 功能:代理 2 使用 PPO(一种先进的强化学习算法)来确定最佳入场点。 优势:它持续调整交易策略,而非使用静态的“超买”或“超卖”线。它会分析当前市场状况并计算最可能的成交点。 执行桥接:通过 ONNX 集成到交易终端 如果执行速度慢,模式识别就毫无用处。我们已通过 ONNX(开放神经网络交换平台)
Adaptive Price Action Engine 买指标,免费送EA 自适应多时间框架趋势与K线形态智能分析系统 市场环境始终在变化,不同的市场阶段中,并非所有 Price Action 形态都具有相同的参考价值。 Adaptive Price Action Engine 旨在适应不断变化的市场条件,将 趋势结构、多时间框架分析、K线形态与统计优化 整合到一个统一的分析框架中。 两种自适应模式 Dual Alpha Trend Mode(双 Alpha Trend 模式) 自动搜索适合的 Alpha Trend 参数,并结合低周期与高周期市场结构,使指标能够根据近期市场行为动态调整趋势识别。 Candlestick + Alpha Mode(K线 + Alpha 模式) 将 Alpha Trend 市场状态与 22种多空K线形态 相结合。系统不会简单地对所有形态一视同仁,而是对不同的形态组合进行统计评估,并识别在特定市场环境下表现出更强历史统计特征的配置。 主要功能 趋势参数自动优化 多时间框架市场状态分析 22种多头与空头 Price Action K线形态 对数千种可能
Smart Price Action Concepts — MetaTrader 5 购买后,请在 MQL5 上给我发消息,即可免费获得 Smart Universal Expert Advisor,以及在线课程、PDF 手册和私人群组访问权限。 看清结构,识别区域,制定交易计划。 在一张清晰有序的图表中整合Smart Money Concepts(SMC)、ICT风格分析与价格行为分析。识别市场结构、订单块、流动性参考价位和失衡区域,再通过Smart Panel选择要显示的内容。 更有条理地分析市场 • 市场结构:内部与波段结构、HH/HL/LL/LH、BOS与CHoCH、高周期分析及多周期仪表板。 • 关键区域:内部与波段订单块、供需区域、Fair Value Gaps(公允价值缺口),以及溢价、均衡和折价区域。 • 流动性参考:等高点与等低点、强弱波段高低点,以及前一日、前一周和前一月的高低点。 • 斐波那契工具:根据当前或前一个波段自动识别。 • 交易时段:伦敦、纽约、东京、悉尼和法兰克福时段,伦敦与纽约kill zones、蜡烛倒计时,以及受支持事件的提醒。 使用Sm
Atomic Analyst MT5
Issam Kassas
4.47 (60)
Atomic Analyst — MetaTrader 5 购买后,请在 MQL5 上给我发消息,即可免费获得 Smart Universal Expert Advisor,以及在线课程、PDF 手册和私人群组访问权限。 Atomic Analyst 将价格行为、趋势方向、入场和出场信号、止损位及多个止盈位集中呈现在图表上。 看清信号,理解交易形态 Atomic Analyst 将分析结果整理为清晰的可视化信息: • 买入和卖出箭头,用于识别潜在的入场机会。 • 止损位和多个止盈位,帮助规划交易。 • 趋势、强度和动量读数,用于评估市场方向。 • 多时间周期分析,用于比较更广泛的市场背景。 • 彩色K线和提醒,帮助您跟踪变化的市场条件。 结合辅助分析查看信号,再判断该交易形态是否符合您的交易规则。 从短期形态到更大级别的行情 您可以将 Atomic Analyst 用于剥头皮交易、日内交易,或跟踪持续时间更长的市场走势。 建议从 H1 时间周期开始。建议交易品种包括 EURUSD、AUDUSD 和 XAUUSD。 从信号到自动化 Smart Universal Expert A
Crystal Heikin Ashi Signals
Muhammad Jawad Shabir
5 (4)
Crystal Heikin Ashi Signals—Professional Trend & Signal Detection Indicator Advanced Heikin Ashi Visualization with Intelligent Signal System for Manual & Automated Trading Final Price: $149 ---------> Price goes up $10 after every 10 sales . Limited slots available — act fast . Overview User Guide PDF Crystal Heikin Ashi Signals is a professional-grade MetaTrader 5 indicator that combines pure Heikin Ashi candle visualization with an advanced momentum-shift detection system. Designed for both m
Power Candles MT5
Daniel Stein
4.58 (12)
Power Candles V3 - 自我优化的强度指标 Power Candles V3 把货币与品种的强度直接转化为图表上可执行的交易方案。指标不再仅根据强度给K线着色,而是在后台持续运行实时自动优化,为您正面对的品种给出最佳 Stop Loss、Take Profit 与信号阈值。一键采用,Entry、Stop Loss、Take Profit 线就以精确价格绘制在图表上,提醒消息中直接包含方向。 本工具是 Stein Investments 生态系统的一部分 - 18+ 款工具,加上 Max,您的一对一 AI 交易导师。  随时在线,深入了解每一款指标,在您需要梳理思路的那一刻就在那里。  立即认识他: https://stein.investments 每根收盘K线运行 3,000+ 次交易模拟。9 种强度状态。2 种策略并行测试。一键采用最优配置。 为什么需要这个 大多数强度指标只给您一个数值,然后留下三个问题:相信哪个阈值、用哪个 Stop Loss、走哪个交易方向。Power Candles V3 在每根收盘K线上自动回答这些问题。结果就是一个完整的交易方案 -
作者的更多信息
ATR Long TP Box
Elias Balian Zimmermann
ATR Long Box Anchor MT5 ATR Long Box Anchor MT5 is a visual risk-reward indicator for MetaTrader 5, specifically designed for planning long setups. The indicator creates an ATR-based long box directly on the chart, including entry, stop-loss zone, take-profit zone, and optional risk-reward information. The indicator works with a freely movable anchor point. This anchor defines the desired entry price and the candle whose ATR value is used for the calculation. This allows a long setup to be plann
FREE
QuantSystem Short TP Box
Elias Balian Zimmermann
ATR Short Box Anchor MT5 ATR Short Box Anchor MT5 is a visual risk-reward indicator for MetaTrader 5, specifically designed for planning short setups. The indicator creates an ATR-based short box directly on the chart, including entry, stop-loss zone, take-profit zone, and optional risk-reward information. The indicator works with a freely movable anchor point. This anchor defines the desired entry price and the candle whose ATR value is used for the calculation. This allows a short setup to be
FREE
筛选:
ZZZ8989jonow
54
ZZZ8989jonow 2026.05.21 12:15 

QuantSystem has a good spread of MTF price strength measures to determine an overall bias for market direction. However, for me it was way too heavy on available resources (cpu /data). This was particularly noticeable during US market opening, when price data updating was much slower than usual, while trying to process and feed all the hungry parameters in the indicator. As soon as I disabled it, my price data once again returned to it's usual high speed updating, with negligible lag. As a free indicator it is quite substantial and has many positive attributes, but definitely needs to lighten up a bit (if possible) to be user friendly to me. Also, has extensive information in Overview, but have not had any communication with owner.

Elias Balian Zimmermann
600
来自开发人员的回复 Elias Balian Zimmermann 2026.05.22 12:13
Thank you very much for your detailed and honest feedback. You are absolutely right that the indicator is currently quite feature-rich, especially when several timeframes and multiple components such as EMA, RSI, ADX, MACD and ATR are processed at the same time. During high-volume market sessions this can increase the calculation load, depending on the symbol, broker data feed and chart setup. I really appreciate this feedback, because performance and practical usability are very important to me. I am already working on a lighter and more optimized version with improved update handling, optional calculation modes and a more resource-friendly refresh logic. The goal is to keep the detailed multi-timeframe overview, while reducing CPU and data load as much as possible. Thank you again for testing the indicator and for pointing this out in such a constructive way. Feedback like this helps me improve the tool for real trading conditions.
You are also welcome to contact me privately.
回复评论