QuantSystem MTF Direction Panel

QuantSystem Multi Timeframe Panel

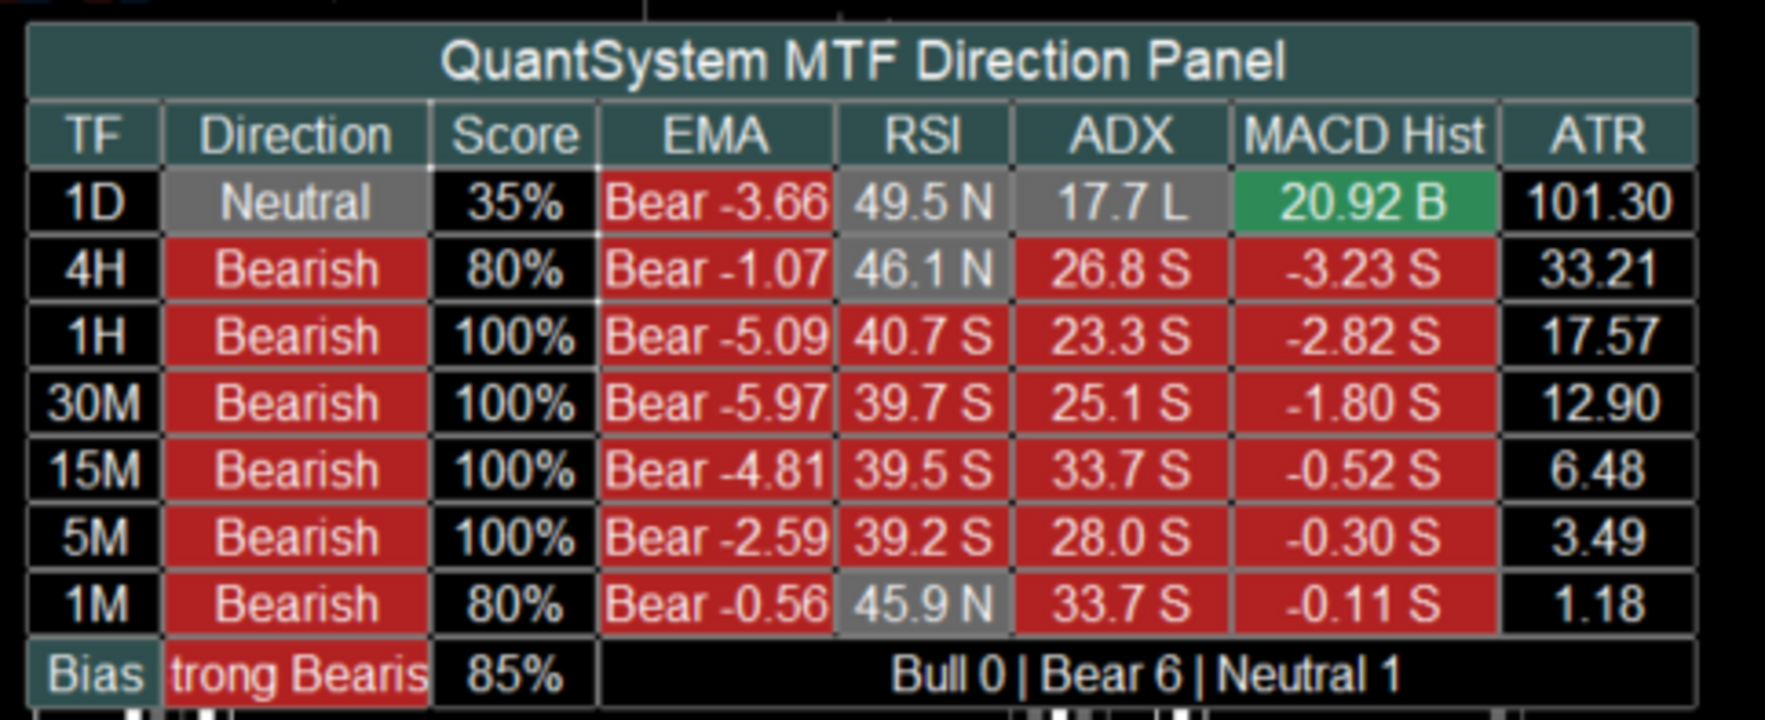
QuantSystem Multi Timeframe Panel is a free MetaTrader 5 indicator that displays the current market direction across several important timeframes in a clean chart dashboard.

The indicator was developed to give traders a fast, clear and structured overview of the current multi-timeframe market situation. Instead of opening each timeframe manually and checking several indicators separately, the panel summarizes the most relevant information directly on the chart.

By default, the tool analyzes the following timeframes: 1D, 4H, 1H, 30M, 15M, 5M and 1M. For each timeframe, the panel calculates an individual market direction based on several technical components such as EMA, RSI, ADX, MACD Histogram and ATR.

The user can decide which values should be displayed in the panel and which components should be included in the score calculation. This allows the panel to be used either in a compact format or as a more detailed analysis dashboard.

The indicator is not designed as a standalone trading system. It is built as a professional market context and orientation tool for manual traders, systematic traders and users of automated trading strategies.

Main Idea of the Indicator

Many traders use multi-timeframe analysis to get a better understanding of the current market structure. However, a common mistake is focusing only on the current chart while ignoring the higher timeframes.

For example, an M1 chart may look bullish in the short term, while 1H, 4H and 1D are still clearly bearish. In such situations, a trader may be trading against the larger market structure without immediately noticing it.

This is exactly where QuantSystem Multi Timeframe Panel is designed to help. The panel shows at a glance which timeframes are bullish, which timeframes are bearish, which timeframes are neutral, how strong the current direction is, whether several timeframes are aligned in the same direction and whether the market is clearly directional or mixed.

This gives the user a fast visual overview without overloading the chart with many separate indicators.

What the Panel Displays

The panel consists of several columns. Some columns are always visible, while others can be enabled or disabled in the input settings.

The columns TF, Direction and Score are always visible.

The TF column shows the corresponding timeframe, for example 1D, 4H, 1H, 30M, 15M, 5M and 1M.

The Direction column shows the calculated direction of each timeframe. Possible values are Bullish, Bearish and Neutral. The direction is not based on only one value. Instead, it is calculated from a weighted combination of different technical components. By default, EMA, RSI, ADX and MACD can be included in this evaluation.

The Score column shows the strength of the calculated direction in percent. A high score means that several active analysis components are pointing in the same direction. A score of 100 percent means that all active score components confirm the same direction. A lower score means that the signals are more mixed or that some components are neutral or opposite.

In addition, the following optional columns can be displayed: EMA, RSI, ADX, MACD Hist and ATR. Each of these columns can be enabled or disabled separately through the inputs. This allows the user to customize the panel and keep the chart clean.

EMA Column

The EMA column shows the direction of the moving average structure.

By default, the indicator uses a Fast EMA with a length of 9 and a Slow EMA with a length of 21.

The logic is simple: if the Fast EMA is above the Slow EMA, the EMA component is evaluated as bullish. If the Fast EMA is below the Slow EMA, the EMA component is evaluated as bearish.

In compact mode, the EMA column does not display both full EMA prices. Instead, it shows the direction and the difference between the Fast EMA and the Slow EMA. This keeps the panel much cleaner and easier to read.

Example: Bull 2.35 means that the Fast EMA is above the Slow EMA. Bear -4.18 means that the Fast EMA is below the Slow EMA.

The EMA difference also gives the user an idea of how far both moving averages are apart. This means the panel does not only show direction, but also provides a basic sense of EMA separation.

RSI Column

The RSI column shows the current RSI value of each timeframe.

By default, the indicator uses an RSI period of 14, an RSI midline of 50 and a neutral zone of 5 points.

With the default settings, this means: RSI above 55 is evaluated as bullish, RSI below 45 is evaluated as bearish and RSI between 45 and 55 is evaluated as neutral.

The RSI value is displayed in a compact format, for example 56.8 B, 43.2 S or 49.5 N.

B stands for bullish, S stands for bearish and N stands for neutral.

The neutral zone is important because RSI values around the 50 level often do not provide a clear directional signal. Without a neutral zone, every small movement above or below 50 would immediately be interpreted as bullish or bearish. The neutral zone makes the evaluation smoother and cleaner.

ADX Column

The ADX column shows trend strength and trend direction using ADX, PlusDI and MinusDI.

By default, the indicator uses an ADX period of 14 and a minimum ADX value of 18.

The logic is: if ADX is below the minimum value, the ADX component is evaluated as weak or neutral. If ADX is above the minimum value and PlusDI is greater than MinusDI, the component is evaluated as bullish. If ADX is above the minimum value and MinusDI is greater than PlusDI, the component is evaluated as bearish.

Example displays are 26.8 B, 31.2 S or 14.5 L.

B stands for bullish, S stands for bearish and L stands for low or too weak.

ADX is useful because it does not only evaluate direction, but also checks whether there is enough trend strength. This can help identify weak or unclear market phases.

MACD Histogram Column

The MACD column does not display MACD Main and MACD Signal as two long values. Instead, it shows the difference between both lines.

The calculation is: MACD Histogram = MACD Main minus MACD Signal.

By default, the indicator uses MACD Fast 12, MACD Slow 26 and MACD Signal 9.

The logic is: if the MACD Histogram is greater than 0, the MACD component is evaluated as bullish. If the MACD Histogram is below 0, the MACD component is evaluated as bearish.

Example displays are 1.25 B or -3.42 S.

This format is much clearer than displaying both full MACD values. The user can immediately see whether MACD momentum is bullish or bearish.

ATR Column

The ATR column shows the current average price movement of each timeframe.

By default, the indicator uses an ATR period of 14.

ATR is currently displayed as a volatility value and is not included in the Direction Score calculation by default. This is intentional, because ATR does not provide a direct bullish or bearish direction. ATR mainly shows how much the market is currently moving.

A higher ATR value means higher market volatility. This can be especially useful in markets such as Gold, indices, Forex or cryptocurrencies, where volatility plays an important role.

How the Direction Is Calculated

The direction of each timeframe is calculated through a weighted point system.

By default, EMA, RSI, ADX and MACD can be included in the score.

The default weighting is: EMA Weight 35, RSI Weight 20, ADX Weight 25 and MACD Weight 20.

Together, this equals 100 points.

If all active components are bearish, the timeframe receives a bearish score of 100 percent. If some components are bullish while others are bearish or neutral, the score is calculated accordingly.

Example: EMA bearish gives 35 points to bearish, RSI neutral gives no points, ADX bearish gives 25 points to bearish and MACD bullish gives 20 points to bullish. The indicator then compares bullish and bearish points. The stronger side determines the direction, as long as the minimum score requirement is reached.

Neutral State

The indicator can also display a neutral state.

This is controlled by the settings Allow Neutral State and Min Directional Score.

By default, the minimum score is set to 60.

This means: if the stronger direction is below 60 percent, the timeframe is evaluated as neutral.

This prevents the indicator from showing a clear direction too quickly when the market situation is actually mixed.

Overall Bias

At the bottom of the panel, the indicator displays an overall market bias.

Possible values are Strong Bullish, Mild Bullish, Mixed, Mild Bearish and Strong Bearish.

This overall bias is based on how many of the analyzed timeframes are bullish, bearish or neutral.

By default, the Strong Alignment Count is set to 5. This means that if at least 5 out of 7 timeframes point in the same direction, the panel displays a strong bias.

Example: if 5 timeframes are bearish, the panel displays Strong Bearish. If 5 timeframes are bullish, the panel displays Strong Bullish.

If there is no clear majority, the panel displays a mixed or milder market condition.

Closed Candle Mode

An important setting is Use Closed Candle Mode.

When this option is enabled, the indicator uses only already closed candles for the higher timeframes.

This is important because values on open higher-timeframe candles can still change while the candle is forming.

For example, a 4H candle can look bullish during its formation, but close bearish by the end of the period. With Closed Candle Mode enabled, the panel works more conservatively and more stable because it only uses confirmed candle values.

If the user wants to see the most current live values, this option can be disabled. The panel will then react faster, but values may change more often during the still-open candle.

Compact Display

The Compact Display setting controls how compactly values are shown inside the panel.

When Compact Display is enabled, the panel shows short and clean values.

Examples: EMA Bear -3.20, RSI 43.5 S, ADX 28.4 S, MACD Hist -1.25 S and ATR 4.80.

When Compact Display is disabled, some values can be displayed in a more detailed format.

For most users, compact mode is recommended because it keeps the panel easier to read and uses less chart space.

Displayed Columns

The user can choose which values are displayed in the panel through the input settings.

The relevant settings are Show EMA, Show RSI, Show ADX, Show MACD and Show ATR.

If a column is disabled, it disappears from the panel. The basic columns TF, Direction and Score always remain visible.

This allows each user to decide whether they want a simple overview or a more detailed analysis panel.

A simple setup can display only TF, Direction and Score. A detailed setup can additionally display EMA, RSI, ADX, MACD Hist and ATR.

Score Components

In addition to the visible columns, the user can choose which components are included in the score calculation.

The relevant settings are Use EMA In Score, Use RSI In Score, Use ADX In Score and Use MACD In Score.

This is important because display and calculation are controlled separately.

For example, a user can display RSI in the panel but exclude RSI from the score calculation. Another user can base the score only on EMA and ADX, while MACD and RSI are shown only as additional information.

This makes the indicator flexible and adaptable to different trading styles.

Adjustable Periods and Parameters

The indicator provides several inputs that allow the user to customize the calculation.

In the EMA Settings, the user can adjust Fast MA Length, Slow MA Length, MA Method, Applied Price, Use EMA In Score and EMA Weight.

In the RSI Settings, the user can adjust RSI Period, RSI Midline, RSI Neutral Zone, Use RSI In Score and RSI Weight.

In the ADX Settings, the user can adjust ADX Period, Minimum ADX, Use ADX In Score and ADX Weight.

In the MACD Settings, the user can adjust MACD Fast, MACD Slow, MACD Signal, Use MACD In Score and MACD Weight.

In the ATR Settings, the user can adjust the ATR Period.

In the Bias Settings, the user can adjust Allow Neutral State, Min Directional Score and Strong Alignment Count.
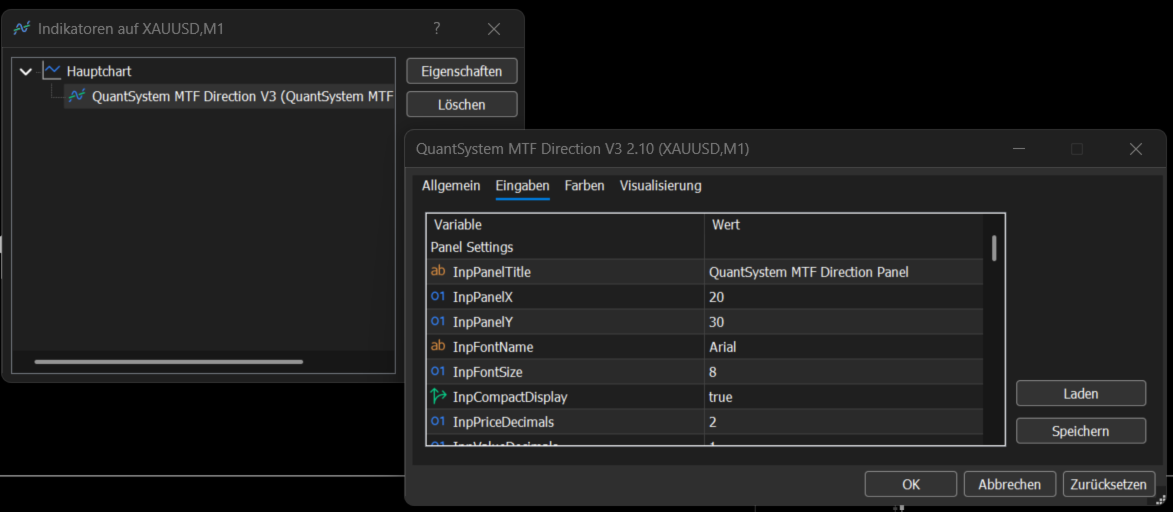
Panel Position and Design

The user can also customize the visual appearance of the panel.

This includes Panel X, Panel Y, Font Name, Font Size, Compact Display, Price Decimals, Value Decimals, MACD Decimals and the colors.

Panel X and Panel Y can be used to move the dashboard on the chart. If the panel should be moved further to the right, Panel X can be increased. If the panel should be moved further down, Panel Y can be increased.

Colors for bullish, bearish, neutral, header, text and borders can also be adjusted.

Alerts

The indicator includes an optional alert function.

If Enable Bias Alerts is activated, an alert can be triggered when the Overall Bias changes.

Examples of possible changes are Strong Bearish to Mixed, Mixed to Strong Bullish or Mild Bullish to Strong Bullish.

This function can be useful if the user wants to be notified when the multi-timeframe structure changes significantly.

Notes About the Screenshots

The screenshots show different display versions of the indicator directly on a MetaTrader 5 chart.

The screenshots show how the panel appears in the main chart window, how multiple timeframes are analyzed at the same time, how Direction and Score are displayed for each timeframe, how optional values such as EMA, RSI, ADX, MACD Histogram and ATR appear in detailed mode and how the Overall Bias is summarized at the bottom of the panel.

The screenshots are visual examples of how the indicator can look in practical chart use. Depending on the symbol, timeframe, broker data, enabled inputs and selected panel position, the display may differ slightly.

Suitable Markets

The indicator can generally be used on all markets available in MetaTrader 5.

Examples include Gold, Forex, indices, cryptocurrencies, commodities and stock CFDs.

The panel can be especially useful in markets where multi-timeframe structure plays an important role, for example XAUUSD, EURUSD, GBPUSD, US100, US500, BTCUSD and ETHUSD.

The indicator is not limited to a specific symbol.

Practical Use

The indicator can be used for different purposes, for example as a fast multi-timeframe market overview, as a trend filter for manual trades, as additional confirmation before an entry, for identifying mixed market phases, for comparing short-term and long-term timeframes and for supporting the analysis of trend strength, momentum and volatility.

One possible use case: if 1D, 4H and 1H are bearish while M1 is temporarily bullish, the user can quickly recognize that the short-term move may only be a correction within a larger bearish structure.

On the other hand, strong alignment across several timeframes can indicate a clearer market phase.

Important Notice

QuantSystem Multi Timeframe Panel is not a standalone trading system and does not provide guaranteed buy or sell signals.

The indicator is designed only for technical market analysis and for better understanding the current multi-timeframe structure.

Trading involves risk. Technical indicators, historical price movement or current market structures do not guarantee future results. Every user should perform their own testing, adjust the settings to their own trading style and use appropriate risk management.


Önerilen ürünler
Let us introduce the Heikin Ashi RSI Oscillator! This indicator combines the concepts of Heikin Ashi candles with the RSI (Relative Strength Index) to produce an oscillator-like format that can be used to filter out some of the noise associated with standard RSI readings. This provides traders with a smoother representation of market conditions. Here are some articles to read more about the RSI and Heikin Ashi candles: https://www.investopedia.com/terms/r/rsi.asp https://www.investopedia.com/ter
Divergent Stochastic Filter II Catch Reversals Early, Filter Noise, Trade with Confidence The Edge: Why This Stochastic is Different  Every trader knows the Stochastic oscillator. But knowing when to trust its signals, that's the real challenge. The Divergent Stochastic Filter II transforms this classic indicator into a precision reversal detection system by adding critical elements: divergence intelligence, signal filtering and exhaustion detection.  While standard Stochastic oscillators fire s
"   Çoklu Sembol İzleme   " yardımcı programı, halihazırda açık olan tüm pozisyonlar için Kaybı Durdur'u hareket ettirir (çoklu sembol izleme). Öncelikle manuel ticarete yardımcı olmayı amaçlamaktadır. Yardımcı program için döviz çiftinin adına veya bireysel tanımlayıcıya (Sihirli sayı) göre herhangi bir kısıtlama yoktur - yardımcı program kesinlikle şu anda açık olan tüm pozisyonları işler. "   Trailing Stop   " ve "   Trailing Step   " parametrelerinin ölçü birimi puandır (1.00055 fiyatı ile
Axiom Point
Tatiana Savkevych
Axiom Point — Precision Structural Breakout Indicator Axiom Point is a high-performance analytical indicator designed to identify high-probability reversal zones using price-action behaviour and adaptive balance filtering. The indicator applies a multi-layer analytical model to detect moments when price transitions beyond its normal equilibrium area, indicating a potential shift in market momentum. Unlike conventional trend-following tools, Axiom Point focuses on so-called points of no return —
"Ayarlanabilir Fraktallar" - fraktal göstergesinin gelişmiş bir versiyonudur, çok kullanışlı bir ticaret aracıdır! - Bildiğimiz gibi Standart fraktallar MT5  göstergesinin hiç ayarı yoktur - bu, yatırımcılar için çok elverişsizdir. - Ayarlanabilir Fraktallar bu sorunu çözmüştür - gerekli tüm ayarlara sahiptir: - Göstergenin ayarlanabilir periyodu (önerilen değerler - 7'nin üzerinde). - Fiyatın Yüksek/Düşük noktalarına ayarlanabilir mesafe. - Fraktal oklarının ayarlanabilir tasarımı. - Gösterged
IX Power MT5
Daniel Stein
4.92 (13)
IX Power: Endeksler, Emtialar, Kripto Paralar ve Forex Piyasaları için İçgörüler Genel Bakış IX Power , endeksler, emtialar, kripto paralar ve forex sembollerinin gücünü analiz etmek için tasarlanmış çok yönlü bir araçtır. FX Power , tüm kullanılabilir döviz çiftlerinin verilerini kullanarak döviz çiftleri için maksimum doğruluk sağlarken, IX Power yalnızca temel sembolün piyasa verilerine odaklanır. Bu, IX Power 'ı forex dışındaki piyasalar için ideal ve daha basit forex analizleri için güven
SuperTrend Indicator for MT5
Vijaykumar Jayantilal Panchal
Supertrend, Olivier Sebam tarafından yatırımcıların eğilimleri belirlemelerine ve bir finansal varlığı ne zaman alıp ne zaman satacaklarını bilmelerine yardımcı olmak için - yukarıda belirtildiği gibi - geliştirilen nispeten popüler olmayan bir teknik göstergedir. Gösterge, TradingView ve MetaTrader'da varsayılan olarak bulunmaz. Yine de piyasada özel yapım Supertrend göstergelerini bulabilirsiniz. Bir grafiğe uygulandığında, süper trend göstergesi iki rengiyle görünür. Değiştirilebilir olsala
MT5 için "2 Hareketli Ortalamalı WPR" Kripto Forex Göstergesi, Yeniden Boyama Yok. - WPR, scalping için en iyi osilatörlerden biridir. - "WPR ve 2 Hareketli Ortalama" Göstergesi, WPR osilatörünün Hızlı ve Yavaş Hareketli Ortalamalarını görmenizi sağlar. - Gösterge, fiyat düzeltmelerini çok erken görme fırsatı sunar. - Bu göstergeyi parametreler aracılığıyla kurmak çok kolaydır, herhangi bir zaman diliminde kullanılabilir. - Resimlerde Alış ve Satış giriş koşullarını görebilirsiniz. - WPR MA'la
Pip Movement Alert MT5 ile piyasa momentumunun önünde olun; birden fazla sembolle hassas pip hareketlerini izlemek ve traderları uyarmak için tasarlanmış çok yönlü bir çoklu para birimi göstergesi, forex, hisse senedi, kripto para ve emtia ticareti için idealdir. Forex Factory ve Reddit’in r/Forex gibi işlem topluluklarında övülmekte ve Investopedia ile TradingView’deki tartışmalarda ani piyasa değişikliklerini tespit etme yeteneğiyle öne çıkmakta olup, hızlı fiyat hareketlerini sermayeye çevirm
FREE
Divergence Hunter - Professional Multi-Oscillator Divergence Detection System Overview Divergence Hunter is a professional-grade technical indicator designed to automatically detect and visualize price-oscillator divergences across multiple timeframes. Built for serious traders who understand the power of divergence trading, this indicator combines precision detection algorithms with an intuitive visual interface. Key Features Multiple Oscillator Support: RSI (Relative Strength Index) MACD (Mo
FREE
Trade history
Andriy Konovalov
5 (2)
The indicator plots charts of profit taken at the Close of candles for closed (or partially closed) long and short positions individually. The indicator allows to filter deals by the current symbol, specified expert ID (magic number) and the presence (absence) of a substring in a deal comment, to set the start time and the periodicity of profit reset (daily, weekly or monthly) to calculate the profit chart. The indicator also displays the floating (not fixed) profit of the opened positions at th
Short Description Swing Timing Breakout EA is a smart Expert Advisor for MetaTrader 5 that combines trend filtering, momentum timing, and dynamic risk management to capture high-probability swing and breakout opportunities. Full Description Swing Timing Breakout EA is a professional trading robot designed for MetaTrader 5, suitable for traders who want a balance between automation, control, and disciplined risk management. This EA uses a trend-following and momentum confirmation approach ,
Show Pips for MT5
Roman Podpora
4.54 (28)
Bu bilgi göstergesi her zaman hesaptaki güncel durumdan haberdar olmak isteyenler için faydalı olacaktır. VERSION MT 4 -   More useful indicators Gösterge, puan cinsinden kâr, yüzde ve para birimi gibi verilerin yanı sıra mevcut çiftin spreadini ve mevcut zaman diliminde çubuğun kapanmasına kadar geçen süreyi görüntüler. Bilgi satırını grafiğe yerleştirmek için birkaç seçenek vardır: Fiyatın sağında (fiyatın arkasında); Yorum olarak (grafiğin sol üst köşesinde); Ekranın seçilen köşesinde. Bilgi
FREE
CCI Fixed Dual
Edoardo Centorame
CCI FIXED DUAL nedir CCI FIXED DUAL, hassas bir şekilde şunları belirlemek için tasarlanmış profesyonel bir Trend Direction Filterdır: piyasanın baskın yönü hareketin yapısal kalitesi ana trend ile hızlanma aşamaları arasındaki tutarlılık Doğrudan bir giriş göstergesi değildir. Klasik bir osilatör değildir. Bu, traderın ne zaman işlem yapması ve ne zaman işlem YAPMAMASI gerektiğine karar vermesine yardımcı olmak için tasarlanmış bir bağlam aracıdır ve piyasa gürültüsünü ve yorumlama hatalarını ö
EUR 8 of 8
Tomas Michalek
Plug & Play portfolio - series of high-quality EURUSD H1 strategies for maximized success. The eighth strategy, the last one from the EUR-8 portfolio , uses BollingerBands mean reversal method for setting up the pending order. To have a whole portfolio of strategies, which trades for you is incredibly efficient, don't miss that opportunity. Check my other strategies today! and assemble your portfolio. Benefits for you Plug & Play system , designed to have   simple initial setup . That's saved
Knowledge of the strength and weakness of each currency is vital for every forex trader. Our   Currency Strength Meter indicator   measures the strength of eight major currencies (USD, EUR, GBP, CHF, JPY, CAD, AUD, NZD) by using the Relative Strength Index indicator, also known as RSI. The Currency Strength Meter indicator shows you, simply and quickly, when a currency is oversold, overbought, or in "normal area". This way, you can identify which currency is the strongest and the weakest. Our
Unlock the power of Smart Money Concepts (SMC) with the cleanest FVG indicator on the market. Smart FVG Pro is not just another gap detector. It is designed for professional traders who need to filter out noise and focus on high-probability reversal zones. Unlike standard indicators that clutter your chart with every minor gap, Smart FVG Pro uses advanced filtering logic (Trend + Volatility) and a unique "Smart Mitigation" system to automatically remove invalidated zones, keeping your chart clea
Order Blocks Scan MT5
Reza Aghajanpour
5 (1)
**   All Symbols   x   All Time frames   scan just by pressing scanner button ** Discount : Only 4   of 5 copy  is 35$. ***   Contact me  to send you instruction   and add you in "Order Block group" for sharing or seeing experiences with other users. Introduction: The central banks and financial institutions mainly drive the market,   Order block is considered a market behavior that indicates accumulation of orders from banks and institutions, then   the market tends to make a sharp move(Imbala
Genel Bakış Candle Timer Countdown Pro, mevcut mumun kapanışına kadar olan süreyi pürüzsüz ve doğru bir şekilde geri sayım olarak gösterir ve dairesel ilerleme yayı ile görsel destek sağlar. Özellikler Kesintisiz geri sayım Dairesel ilerleme halkası 6 konum seçeneği 3 renk modu Son geri sayım vurgusu Bağlantı durumu algılama Yeni mum uyarıları Düşük CPU kullanımı Kurulum MQL5 Market’ten indirin Grafiğe ekleyin Ayarları yapılandırın Uyumluluk MetaTrader 5 Build 2500+ Tüm semboller Tüm zaman dilim
LT Rainbow Trend
Thiago Duarte
5 (1)
Do you, like me, like to trade with the trend? Then this indicator will help you! Rainbow Trend is a trend indicator, which uses several Moving Averages on the chart. It measures different trend strenght zones for different periods: very long term, long term, mid term, short term and very short term. Each zone has its color, and it is possible to have sound alert when the prices leaves a zone and enters another. Its configuration is very simple. If you find any bug or have any suggestions, conta
FuturePath Forecast – Predict Your Next Move! See potential price movements instantly with AI_Path! Combines trend slope and smooth cycles to create a clear forecast path on your chart. Perfect for traders who want an edge and smarter decisions in real time. Visual Forecasting: Instantly see where the market could go next. Trend + Cycle Analysis: Combines linear trend slope with smooth sinusoidal patterns for realistic projections. Customizable Horizon: Adjust the number of bars to forecast acc
Introducing the   Range Predictor : Your Ultimate Guide to Future Trading Ranges!   Imagine having the power to see into the future of market moves— Range Predictor   brings this dream to life. Designed to deliver real-time,   predictive support and resistance levels , this tool goes beyond standard indicators, offering trend direction insights and precise range   forecasts . Whether you're a day trader or a swing trader, the   Range Predictor   is your all-in-one toolkit for mastering the ma
Gösterge, tarihsel olanlarla karşılaştırılabilecek güncel teklifler oluşturur ve bu temelde bir fiyat hareketi tahmini yapar. Gösterge, istenen tarihe hızlı navigasyon için bir metin alanına sahiptir. Seçenekler: Sembol - göstergenin göstereceği sembolün seçimi; SymbolPeriod - göstergenin veri alacağı dönemin seçimi; GöstergeRenk - gösterge rengi; Ters - doğru tırnakları tersine çevirir, yanlış - orijinal görünüm; Sonraki, tarihi girebileceğiniz ve 'enter' tuşuna basarak hemen atlayab
Trades History Visualizer is a MetaTrader 5 indicator that displays your trading history directly on the chart, providing a clear visual representation of past trades with additional information. Key Features: Visual trade history display with entry arrows Entry, Stop Loss, and Take Profit horizontal lines Color-coded connector lines between entry and exit points (green for profit, red for loss) Risk-Reward ratio display for each closed trade Profit/Loss amount display option Pip display option
RED ZONE Monitor Loss-Cut & Break-Even Risk Monitor for Averaging Traders (MT5) RED ZONE Monitor is a risk management indicator for traders who use averaging, scaling-in, or multiple open positions . It visually displays: The loss-cut (liquidation) risk zone The break-even price Based on current open positions, lots, and margin conditions This indicator does not provide entry signals. It does not promise profits. It shows where your account actually fails if price moves against you. What RED ZO
Fibo Channels
Jeffrey Quiatchon
Fibo Daily Channel Indicator The  Indicator is a powerful tool for traders, providing precise daily support and resistance levels based on Fibonacci retracement and extension calculations. This indicator automatically draws key pivot points (PP, R1, R2, S1, S2) as well as additional extension levels (R3, R4, S3, S4), helping traders identify potential reversal and breakout zones with ease. It includes customizable alerts and push notifications, allowing traders to receive updates whenever the pr
Least Square MA Description: The Least Square Moving Average indicator allows you to assess the direction of the market movement and its possible reversals. The indicator is a line that is displayed in the price window. Input parameters: LSMA_Period - the period for calculating the moving average using the least squares method; Prediction - the number of candles used to construct the predicted moving average using the least squares method, provided that its rate (falling or growing remains); Dis
AutoStructure
Evgeniy Grebenuik
AutoStructure — Your Key to Precise Market Entry in Forex! AutoStructure is a professional Forex indicator designed for traders who value precision, speed, and full control over the market. With just one click, you'll be able to: Automatically draw key support and resistance levels Visualize FVG zones (Fair Value Gaps) to spot profitable reversals Analyze Order Blocks across multiple timeframes Build Fibonacci levels based on real price action Perfectly suited for both scalpers and position t
SDZ Trend Pro
Van Toan Nguyen
Overview SDZ Trend Pro is a professional Expert Advisor work for all symbol, recommend  XAUUSD (Gold) trading on the H1 timeframe . It combines dynamic price action patterns, EMA filters, and strict session-based trading logic to identify precise market entries with optimal risk control. This EA is ideal for traders who prefer structured, time-filtered trading during active market hours. ️ Core Features Dynamic Stop Loss (SL) logic Automatically sets SL based on candle pattern Chooses the
Trend Lines v2 MT5
Quang Huy Quach
5 (1)
Trend Lines v2 MT5 is an intelligent auto trendline indicator that instantly detects key dynamic support and resistance zones. Built on pivot high/low structure, it delivers a clear and accurate view of market trends across all timeframes. Features Fully automatic trendline drawing based on precise pivot points. Filters out noise – only clean and reliable trendlines are shown. Control the number of lines to keep your chart neat and easy to read. Flexible customization: colors, line thickness, ra
FREE
Bu ürünün alıcıları ayrıca şunları da satın alıyor
ARIPoint
Temirlan Kdyrkhan
1 (1)
ARIPoint is a powerful trading companion designed to generate high-probability entry signals with dynamic TP/SL/DP levels based on volatility. Built-in performance tracking shows win/loss stats, PP1/PP2 hits, and success rates all updated live. Key Features: Buy/Sell signals with adaptive volatility bands Real-time TP/SL/DP levels based on ATR Built-in MA Filter with optional ATR/StdDev volatility Performance stats panel (Success, Profit/Loss, PP1/PP2) Alerts via popup, sound, push, or email Cu
SuperScalp Pro
Van Minh Nguyen
4.63 (24)
SuperScalp Pro – Gelişmiş Çoklu Filtre Scalping Gösterge Sistemi SuperScalp Pro, işlem fırsatlarını belirlemeye yardımcı olmak için klasik Supertrend ile birden fazla akıllı onay filtresini birleştiren gelişmiş bir scalping göstergesidir. M1’den H4’e kadar farklı zaman dilimlerinde verimli şekilde çalışır ve XAUUSD, BTCUSD ile majör Forex pariteleri için optimize edilmiştir. Gösterge, net Al ve Sat sinyalleri sunar ve ATR tabanlı otomatik giriş fiyatı, stop loss ve take profit seviyeleri hesapla
Divergence Bomber
Ihor Otkydach
4.9 (89)
Bu göstergeyi satın alan herkese aşağıdaki ekstra içerikler ücretsiz olarak sunulmaktadır: Her işlemi otomatik olarak yöneten, Stop Loss ve Take Profit seviyelerini ayarlayan ve işlemleri strateji kurallarına göre kapatan özel yardımcı araç: "Bomber Utility" Göstergenin farklı varlıklar üzerinde kullanılmasına yönelik ayar dosyaları (set dosyaları) Bomber Utility için 3 farklı modda kullanım sunan ayar dosyaları: "Minimum Risk", "Dengeli Risk" ve "Bekle-Gör Stratejisi" Bu ticaret stratejisini hı
Entry In The Zone and SMC Multi Timeframe is a real-time 2-in-1 market analysis tool that combines market structure analysis and a No Repaint BUY / SELL signal system into a single indicator, built on Smart Money Concepts (SMC) — a widely adopted framework used by professional traders to understand market structure. This indicator helps you see the market more clearly, make decisions based on structure rather than guesswork, and focus on high-probability zones where price is more likely to react
Gold Entry Sniper
Tahir Mehmood
5 (9)
Gold Entry Sniper – Altın Scalping & Swing Trading için Profesyonel Çoklu Zaman Çerçeveli ATR Paneli Gold Entry Sniper , XAUUSD ve diğer enstrümanlar için doğru al/sat sinyalleri veren, ATR Trailing Stop mantığı ve çoklu zaman çerçevesi analizi ile geliştirilmiş gelişmiş bir MetaTrader 5 göstergesidir. Temel Özellikler ve Avantajlar Çoklu Zaman Çerçevesi Analizi – M1, M5, M15 trendlerini tek panelde gösterir. ATR Tabanlı Trailing Stop – Volatiliteye göre dinamik olarak ayarlanır. Profesyonel Gra
Power Candles V3 - Kendi Kendini Optimize Eden Güç Göstergesi Power Candles V3, döviz ve enstrüman gücünü, eklendiği her grafikte eyleme geçirilebilir bir ticaret planına dönüştürür. Sadece mumları renklendirmek yerine, arka planda canlı bir otomatik optimizasyon çalıştırır ve önünüzdeki sembol için en iyi Stop Loss, Take Profit ve sinyal eşiğini size sunar. Tek bir tıklama ile canlı ticarete uyarlanır - giriş, Stop Loss ve Take Profit ışınları grafikte tam fiyatlarla görünür ve uyarılar yön bil
SignalTech MT5 is a fully rule based trading system for EURUSD, USDCHF, USDJPY, AUDUSD, NZDUSD, EURJPY, AUDJPY, NZDJPY, CADJPY.  All the winning trades with chart setups are published on the comments page. 2025-12 1174 Pips 2026-01 2624 Pips 2026-02 2937 Pips 2026-03 2165 Pips 2026-04 2243 Pips It can generate signals with Buy/Sell Arrows and Pop-Up/Sound Alerts. Each signal has clear Entry and Stop Loss levels, which should be automatically flagged on the chart, as well as potential Targets 1,
Bu indikatörü satın alırsanız, Profesyonel Trade Manager’ımı  + EA ÜCRETSİZ olarak alacaksınız. Öncelikle, bu Ticaret Sistemi'nin Non-Repainting, Non-Redrawing ve Non-Lagging Göstergesi olduğunu vurgulamak önemlidir, bu da hem manuel hem de robot ticareti için ideal hale getirir. Online kurs, kılavuz ve ön ayarları indir. "Smart Trend Trading System MT5", yeni ve deneyimli tüccarlar için özelleştirilmiş kapsamlı bir ticaret çözümüdür. 10'dan fazla premium göstergeyi birleştiriyor ve 7'den fazla
RelicusRoad Pro MT5
Relicus LLC
4.96 (24)
RelicusRoad Pro: Kantitatif Piyasa İşletim Sistemi ÖMÜR BOYU ERİŞİMDE %70 İNDİRİM (SINIRLI SÜRE) - 2.000+ TRADER'A KATILIN Neden çoğu trader "mükemmel" indikatörlere rağmen başarısız olur? Çünkü tekil kavramları boşlukta trade ederler. Bağlamı olmayan bir sinyal kumardır. Sürekli kazanmak için KONFLÜANS (UYUM) gerekir. RelicusRoad Pro basit bir ok indikatörü değildir. Tam bir Kantitatif Piyasa Ekosistemi dir. Tescilli volatilite modellemesini kullanarak fiyatın ilerlediği "Adil Değer Yolu"nu har
MetaTrader 5 için Akıllı Çok Katmanlı Kırılım ve Geri Çekilme Dedektörü "Akıllı, Basit, Hızlı!" Yüksek olasılıklı kırılım girişlerini kaçırmaktan bıktınız mı? Kırılımları trend yönü ve para birimi momentumuyla hizalamaya çalışarak birden fazla grafiği saatlerce tarayıp — yine de hareketi kaçırıyor musunuz? Break Pullback, tüm bunları tek bir göstergede çözüyor. Break Pullback Nedir? Break Pullback, piyasa yapısı, kırılım ve trend devamı kurulumlarında işlem yapan yatırımcılar için özel olarak
Gann Made Easy , bay teorisini kullanarak ticaretin en iyi ilkelerine dayanan, profesyonel ve kullanımı kolay bir Forex ticaret sistemidir. WD Gann. Gösterge, Zararı Durdur ve Kâr Al Seviyeleri dahil olmak üzere doğru SATIN AL ve SAT sinyalleri sağlar. PUSH bildirimlerini kullanarak hareket halindeyken bile işlem yapabilirsiniz. Satın alma işleminden sonra, alım satım talimatlarını ve harika ek göstergeleri ücretsiz olarak almak için lütfen benimle iletişime geçin! Muhtemelen Gann ticaret yöntem
Tanıtım       Quantum Breakout PRO   , Breakout Bölgeleri ile ticaret yapma şeklinizi değiştiren çığır açan MQL5 Göstergesi! 13 yılı aşkın ticaret tecrübesine sahip deneyimli tüccarlardan oluşan bir ekip tarafından geliştirilmiştir.       Kuantum Breakout PRO       yenilikçi ve dinamik koparma bölgesi stratejisiyle ticaret yolculuğunuzu yeni zirvelere taşımak için tasarlanmıştır. Kuantum Breakout Göstergesi, size 5 kar hedefi bölgesi ile kırılma bölgelerinde sinyal okları ve kırılma kutusuna da
Azimuth Pro
Ottaviano De Cicco
5 (7)
Azimuth Pro V2: Synthetic Fractal Structure and Confirmed Entries for MT5 Overview Azimuth Pro is a multi-level swing structure indicator by Merkava Labs . Four nested swing layers, swing-anchored VWAP, ABC pattern detection, three-timeframe structural filtering, and closed-bar confirmed entries — one chart, one workflow from micro-swings to macro-cycles. This is not a blind signal product. It is a structure-first workflow for traders who care about location, context, and timing. V2 Launch Offe
Öncelikle, bu Ticaret Aracının Non-Repainting, Non-Redrawing ve Non-Lagging Gösterge olduğunu vurgulamakta fayda var, bu da onu profesyonel ticaret için ideal hale getiriyor. Çevrimiçi kurs, kullanıcı kılavuzu ve demo. Akıllı Fiyat Hareketi Kavramları Göstergesi, hem yeni hem de deneyimli tüccarlar için çok güçlü bir araçtır. İleri ticaret fikirlerini, Inner Circle Trader Analizi ve Smart Money Concepts Ticaret Stratejileri gibi 20'den fazla kullanışlı göstergeyi bir araya getirerek bir araya
Önce dürüst olalım. Hiçbir gösterge tek başına sizi kârlı yapmaz. Eğer biri size aksini söylüyorsa, size bir hayal satıyordur. Mükemmel al/sat okları gösteren her gösterge, kusursuzmuş gibi görünecek şekilde yapılabilir — sadece geçmişin doğru bir bölümünü yakınlaştırıp kazanan işlemleri ekran görüntüsü almanız yeterlidir. Biz bunu yapmıyoruz.  SMC Intraday Formula bir araçtır. Piyasa yapısını sizin için okur, en yüksek olasılıklı fiyat bölgelerini belirler ve şu anda akıllı paranın izinin nası
Quantum TrendPulse
Bogdan Ion Puscasu
5 (25)
SuperTrend   ,   RSI   ve   Stochastic'in   gücünü tek bir kapsamlı göstergede birleştirerek işlem potansiyelinizi en üst düzeye çıkaran nihai işlem aracı olan   Quantum TrendPulse'u   tanıtıyoruz. Hassasiyet ve verimlilik arayan yatırımcılar için tasarlanan bu gösterge, piyasa trendlerini, momentum değişimlerini ve en uygun giriş ve çıkış noktalarını güvenle belirlemenize yardımcı olur. Temel Özellikler: SuperTrend Entegrasyonu:   Güncel piyasa trendlerini kolayca takip edin ve karlılık dalgası
FX Trend MT5 NG
Daniel Stein
5 (4)
FX Trend NG: Yeni Nesil Çoklu Piyasa Trend Zekâsı Genel Bakış FX Trend NG , çoklu zaman dilimlerinde çalışan profesyonel bir trend analiz ve piyasa izleme aracıdır. Piyasanın yapısını saniyeler içinde anlamanızı sağlar. Birden fazla grafik arasında geçiş yapmak yerine, hangi enstrümanların trendde olduğunu, momentumun nerede zayıfladığını ve hangi zaman dilimlerinin uyumlu olduğunu anında görebilirsiniz. Lansman Teklifi – FX Trend NG sadece $30 (6 Ay) veya $80 Ömür Boyu Lisans ile edinin. Zate
Atomic Analyst MT5
Issam Kassas
3.94 (31)
Öncelikle belirtmek gerekir ki bu Ticaret Göstergesi Yeniden Çizim Yapmaz, Gecikmez ve Gecikme Göstermez, bu da hem manuel hem de robot ticareti için ideal hale getirir. Kullanıcı kılavuzu: ayarlar, girişler ve strateji. Atom Analisti, Piyasada Daha İyi Bir Avantaj Bulmak İçin Fiyatın Gücünü ve Momentumunu Kullanan PA Fiyat Hareketi Göstergesidir. Gürültüleri ve Yanlış Sinyalleri Kaldırmaya ve Ticaret Potansiyelini Artırmaya Yardımcı Olan Gelişmiş Filtrelerle Donatılmıştır. Birden fazla katmanl
Meridian Pro
Ottaviano De Cicco
5 (2)
Meridian Pro 2.00: Professional Multi-Timeframe Trend Matrix for MT5 Meridian Pro 2.00 is a professional adaptive trend matrix for MetaTrader 5. It combines the original Meridian trend engine, a clean chart ribbon, closed-bar signal arrows, an 8-timeframe dashboard, Fuel momentum, weighted consensus, synthetic HTF processing and chart-native higher-timeframe context lines. The goal is simple: read current trend, multi-timeframe structure, strength, momentum and EA-ready state from one discipline
Btmm state engine pro
Garry James Goodchild
5 (4)
BTMM State Engine Pro is a MetaTrader 5 indicator for traders who use the Beat The Market Maker approach: Asian session context, kill zone timing, level progression, peak formation detection, and a multi-pair scanner from a single chart. It combines cycle state logic with a built-in scanner dashboard so you do not need the same tool on many charts at once. What it does Draws the Asian session range; session times can follow broker server offset or be set in inputs. Tracks level progression (L
Market Structure Order Block Dashboard MT5, piyasa yapısını ve ana fiyat reaksiyon bölgelerini doğrudan grafikte okumak isteyen traderlar için tasarlanmış bir MT5 göstergesidir. BOS, ChoCH, Order Blocks, Fair Value Gaps (FVG), Likidite, Kill Zones, Volume Profile ve hızlı analiz için kompakt bir paneli bir araya getirir. Bu gösterge, piyasa yapısını, ICT ve Smart Money kavramlarını karar çerçevesi olarak kullanan traderlara yöneliktir. Trend devamlarını, olası tersine dönüşleri, fiyat dengesizli
KT Alpha Hunter Arrows MT5
KEENBASE SOFTWARE SOLUTIONS
Çoğu ok göstergesi size yalnızca bir sinyal verir ve geri kalan her şeyi sizin çözmenizi bekler. KT Alpha Hunter Arrows ise size tam bir işlem planı sunar. Her sinyal oku, hazır çizilmiş tam bir planla birlikte görünür: giriş çizgisi, stop loss, dört take profit seviyesi ve bu sembol ile zaman diliminin o anda işlem yapmaya değer olup olmadığını gösteren canlı edge değerlendirmesi. Dahil edilen Trade Manager EA, siz işleme girdikten sonra yönetimi üstlenir. Böylece piyasa gürültülü ve stresli ha
RFI levels PRO MT5
Roman Podpora
3.67 (3)
Bu gösterge, fiyat dönüş noktalarını ve fiyat geri dönüş bölgelerini doğru bir şekilde gösterir.       Başlıca oyuncular   . Yeni trendlerin nerede oluştuğunu görüyorsunuz ve her işlem üzerinde kontrolü elinizde tutarak, azami hassasiyetle kararlar alıyorsunuz. TREND LINES PRO   göstergesiyle birlikte kullanıldığında maksimum potansiyelini ortaya koyar.  VERSION MT4 Göstergenin gösterdiği şey: Yeni bir trendin başlangıcında aktivasyonla birlikte tersine dönüş yapıları ve tersine dönüş seviyeler
Grabber System MT5
Ihor Otkydach
4.83 (23)
Size mükemmel bir teknik gösterge olan Grabber’ı tanıtıyorum. Bu araç, kullanıma hazır bir “her şey dahil” işlem stratejisi olarak çalışır. Tek bir yazılım kodu içinde güçlü piyasa teknik analiz araçları, işlem sinyalleri (oklar), uyarı işlevleri ve push bildirimleri entegre edilmiştir. Bu göstergeyi satın alan herkes aşağıdaki hediyeleri ücretsiz olarak alır: Açık emirleri otomatik yönetmek için Grabber Yardımcı Aracı Kurulum, yapılandırma ve nasıl işlem yapılacağını adım adım anlatan video kıl
Top indicator for MT5   providing accurate signals to enter a trade without repainting! It can be applied to any financial assets:   forex, cryptocurrencies, metals, stocks, indices .  Watch  the video  (6:22) with an example of processing only one signal that paid off the indicator! MT4 version is here It will provide pretty accurate trading signals and tell you when it's best to open a trade and close it. Most traders improve their trading results during the first trading week with the help of
Bu gösterge paneli, seçilen semboller için mevcut en son   harmonik kalıpları   gösterir, böylece zamandan tasarruf edersiniz ve daha verimli olursunuz /   MT4 sürümü . Ücretsiz Gösterge:   Basic Harmonic Pattern Gösterge sütunları Symbol :   seçilen semboller görünecektir Trend:   yükseliş veya düşüş Pattern :   desen türü (gartley, kelebek, yarasa, yengeç, köpekbalığı, cypher veya ABCD) Entry :   giriş fiyatı SL:   zararı durdur fiyatı TP1:   1. kar alma fiyatı TP2:   2. kar alma fiyatı TP
FX Power MT5 NG
Daniel Stein
5 (31)
FX Power: Daha Akıllı Ticaret Kararları için Para Birimlerinin Gücünü Analiz Edin Genel Bakış FX Power , her piyasa koşulunda başlıca para birimlerinin ve altının gerçek gücünü anlamak için vazgeçilmez bir araçtır. Güçlü para birimlerini alıp zayıf olanları satarak, FX Power ticaret kararlarınızı basitleştirir ve yüksek olasılıklı fırsatları ortaya çıkarır. İster trendlere sadık kalın ister Delta'nın aşırı değerlerini kullanarak tersine dönüşleri öngörün, bu araç ticaret tarzınıza mükemmel bir
TREND ÇİZGİLERİ PRO       Piyasanın gerçek yön değiştirdiği noktayı anlamaya yardımcı olur. Gösterge, gerçek trend dönüşlerini ve büyük oyuncuların piyasaya yeniden girdiği noktaları gösterir. Anlıyorsun   BOS hatları   Daha yüksek zaman dilimlerindeki trend değişiklikleri ve önemli seviyeler, karmaşık ayarlar veya gereksiz gürültü olmadan gösterilir. Sinyaller yeniden çizilmez ve çubuk kapandıktan sonra grafikte kalır. MT4 SÜRÜMÜ   -   RFI LEVELS PRO   göstergesiyle   birlikte kullanıldığında m
Super Signal Market Slayer No repaint | Alta precisione | Indicatore di trend intelligente multi-mercato Nel trading, la vera difficoltà non è aprire un’operazione, ma riconoscere chiaramente quando un trend sta realmente iniziando. Market Slayer nasce proprio per questo. È un indicatore intelligente senza repaint, progettato specificamente per il trading intraday. Grazie a conferme multilivello e filtri di trend, fornisce segnali Buy / Sell chiari e affidabili solo nei momenti chiave. Vantaggi
OmniSync Projection
Antonio-alin Teculescu
5 (1)
Chronos Fractal Engine is an innovative price projection indicator for MetaTrader 5, designed to transform your technical analysis by intelligently identifying and projecting historical price patterns. Built upon an advanced correlation algorithm and the fractal principles of the market, this powerful tool visualizes potential future price movements, giving you a unique edge in your trading decisions. What is Chronos Fractal Engine? At its core, the Chronos Fractal Engine employs a sophisticat
Yazarın diğer ürünleri
QuantSystems BTC Adaptive EA QuantSystems BTC Adaptive EA is a MetaTrader 5 Expert Advisor for automated trading on BTCUSD. The EA was developed to evaluate market movements systematically and execute trading decisions based on predefined rules. It is designed to reduce manual decision-making and to run automatically once it has been configured by the user. The EA focuses on an adaptive trading approach for BTCUSD on the M15 timeframe. The internal strategy settings are preconfigured, so the use
QuantSystem Gold Reversion EA QuantSystem Gold Reversion EA is a MetaTrader 5 Expert Advisor for automated trading on XAUUSD. The EA was developed to systematically evaluate movements in the gold market and execute trading decisions based on predefined rules. It is designed to reduce manual decision-making and to run automatically once it has been configured by the user. The EA focuses on a structured reversion approach for XAUUSD on the M30 timeframe. The internal strategy settings are preconfi
Filtrele:
Değerlendirme yok
Değerlendirmeye yanıt